
PUBLISHER: Global Market Insights Inc. | PRODUCT CODE: 2019111

PUBLISHER: Global Market Insights Inc. | PRODUCT CODE: 2019111
Ultrasonic Heat Meters Market Opportunity, Growth Drivers, Industry Trend Analysis, and Forecast 2026 - 2035
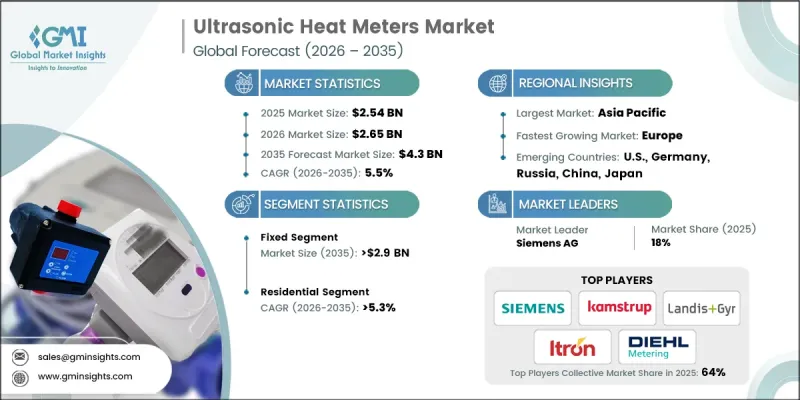
The Global Ultrasonic Heat Meters Market was valued at USD 2.54 billion in 2025 and is estimated to grow at a CAGR of 5.5% to reach USD 4.3 billion by 2035.
Ultrasonic heat meters are devices that calculate thermal energy consumption or transfer in heating and cooling systems by measuring the flow rate of fluid and temperature difference using ultrasonic sound waves. The market is driven by the expansion of advanced heating infrastructure, growing demand for real-time energy monitoring, and increasing deployment in district heating, HVAC, industrial, and residential systems. The meters' lack of moving parts, high precision, low maintenance, and non-invasive installation make them attractive for modern energy systems. Rising investments in smart infrastructure, renewable heating solutions, and sustainable energy systems are further accelerating market growth. The emphasis on accurate energy measurement, cost-efficient heat management, and eco-friendly solutions is shaping the market landscape, while digitalization and energy optimization initiatives are encouraging widespread adoption globally.
| Market Scope | |
|---|---|
| Start Year | 2025 |
| Forecast Year | 2026-2035 |
| Start Value | $2.54 Billion |
| Forecast Value | $4.3 Billion |
| CAGR | 5.5% |
The fixed ultrasonic heat meters segment is anticipated to reach USD 2.9 billion by 2035, driven by precise measurements, ease of installation, and negligible pressure loss. Investments in advanced energy management systems and infrastructure upgrades further boost adoption. Rapid industrialization and the push toward hybrid and renewable solutions are also key growth factors.
The residential segment is projected to grow at a CAGR of 5.3% by 2035 as urbanization, new housing developments, and demand for personalized billing systems drive deployment. Accurate heat monitoring across apartments and homes is increasing, while smart metering technologies are enabling energy optimization, further supporting market expansion.
U.S. Ultrasonic Heat Meters Market is expected to reach USD 160 million by 2035, fueled by rising energy costs, diverse building ownership structures, and regulatory mandates on renewable energy and emission reductions. Adoption of real-time monitoring and individualized billing for heat consumption, along with smart energy management integration, is creating significant opportunities for growth.
Prominent players in the Global Ultrasonic Heat Meters Market include Apator S.A., Axioma Metering UAB, Badger Meter, BMETERS, Caleffi S.p.A., Danfoss, Diehl Stiftung & Co. KG, Engelmann Sensor GmbH, GWF MessSysteme, Honeywell International, iCenta Controls, ista Energy Solutions Limited, Itron, Kamstrup, Landis+Gyr AG, Metron FMC, QUNDIS GmbH, Siemens, Smarthome, and ZENNER International GmbH & Co. KG. Companies in the Ultrasonic Heat Meters Market strengthen their position by investing in R&D for high-precision, low-maintenance devices, expanding smart metering solutions, and integrating products with digital energy platforms. Strategic partnerships with utility providers and infrastructure developers enhance adoption and market reach. Firms target emerging markets with customized products suited to local regulations and heating systems. Sustainable manufacturing practices, cost-efficient production, and comprehensive after-sales support, including remote monitoring and maintenance services, reinforce brand trust and market presence.
Table of Contents
Chapter 1 Methodology & Scope
- 1.1 Research design
- 1.2 Quality commitment
- 1.2.1 GMI AI policy & data integrity commitment
- 1.2.1.1 Source consistency protocol
- 1.2.1 GMI AI policy & data integrity commitment
- 1.3 Research trail & Confidence Scoring
- 1.3.1 Research trail components
- 1.3.2 Scoring components
- 1.4 Data Collection
- 1.4.1 Partial list of primary sources
- 1.5 Data mining sources
- 1.5.1 Paid sources
- 1.5.1.1 Sources, by region
- 1.5.1 Paid sources
- 1.6 Base estimates and calculations
- 1.6.1 Base year calculation for any one approach
- 1.7 Forecast model
- 1.8 Research transparency addendum
- 1.8.1 Source attribution framework
- 1.8.2 Quality assurance metrics
- 1.8.3 Our commitment to trust
- 1.9 Market definitions
Chapter 2 Executive Summary
- 2.1 Industry 360-degree synopsis, 2022 - 2035
- 2.2 Business trends
- 2.3 Product trends
- 2.4 Application trends
- 2.5 Regional trends
Chapter 3 Industry Insights
- 3.1 Industry ecosystem
- 3.2 Regulatory landscape
- 3.3 Industry impact forces
- 3.3.1 Growth drivers
- 3.3.2 Industry pitfalls & challenges
- 3.4 Growth potential analysis
- 3.5 Porter's analysis
- 3.5.1 Bargaining power of suppliers
- 3.5.2 Bargaining power of buyers
- 3.5.3 Threat of new entrants
- 3.5.4 Threat of substitutes
- 3.6 PESTEL analysis
- 3.6.1 Political factors
- 3.6.2 Economic factors
- 3.6.3 Social factors
- 3.6.4 Technological factors
- 3.6.5 Legal factors
- 3.6.6 Environmental factors
- 3.7 Cost structure analysis
- 3.8 Price trend analysis, 2022-2035
- 3.8.1 By Application
- 3.8.2 By Region
- 3.9 Emerging opportunities & trends
- 3.9.1 Digitalization & IoT integration
- 3.10 Investment analysis & future outlook
Chapter 4 Competitive landscape, 2026
- 4.1 Introduction
- 4.2 Company market share analysis, by region, 2025
- 4.2.1 North America
- 4.2.2 Europe
- 4.2.3 Asia Pacific
- 4.2.4 Middle East
- 4.3 Competitive positioning matrix
- 4.4 Key developments
- 4.4.1 Mergers & acquisitions
- 4.4.2 Partnerships & collaborations
- 4.4.3 New product launches
- 4.4.4 Expansion plans & funding
Chapter 5 Market Size and Forecast, By Product, 2022 - 2035 (USD Million & ‘000 Units)
- 5.1 Key trends
- 5.2 Fixed
- 5.3 Portable
Chapter 6 Market Size and Forecast, By Application, 2022 - 2035 (USD Million & ‘000 Units)
- 6.1 Key trends
- 6.2 Residential
- 6.3 Commercial
- 6.3.1 College/University
- 6.3.2 Office Building
- 6.3.3 Government Building
- 6.3.4 Others
- 6.4 Industrial
Chapter 7 Market Size and Forecast, By Region, 2022 - 2035 (USD Million & ‘000 Units)
- 7.1 Key trends
- 7.2 North America
- 7.2.1 U.S.
- 7.2.2 Canada
- 7.3 Europe
- 7.3.1 Germany
- 7.3.2 Poland
- 7.3.3 Sweden
- 7.3.4 Denmark
- 7.3.5 Finland
- 7.3.6 Italy
- 7.3.7 UK
- 7.4 Asia Pacific
- 7.4.1 China
- 7.4.2 Japan
- 7.4.3 South Korea
Chapter 8 Company Profiles
- 8.1 Apator S.A.
- 8.2 Axioma Metering UAB
- 8.3 Badger Meter
- 8.4 BMETERS
- 8.5 Caleffi S.p.A.
- 8.6 Danfoss
- 8.7 Diehl Stiftung & Co. KG
- 8.8 Engelmann Sensor GmbH
- 8.9 GWF MessSysteme
- 8.10 Honeywell International
- 8.11 iCenta Controls
- 8.12 ista Energy Solutions Limited
- 8.13 Itron
- 8.14 Kamstrup
- 8.15 Landis+Gyr AG
- 8.16 Metron FMC
- 8.17 QUNDIS GmbH
- 8.18 Siemens
- 8.19 Smarthome
- 8.20 ZENNER International GmbH & Co. KG

