
PUBLISHER: Global Market Insights Inc. | PRODUCT CODE: 2019113

PUBLISHER: Global Market Insights Inc. | PRODUCT CODE: 2019113
U.S. E-Bike Market Opportunity, Growth Drivers, Industry Trend Analysis, and Forecast 2026 - 2035
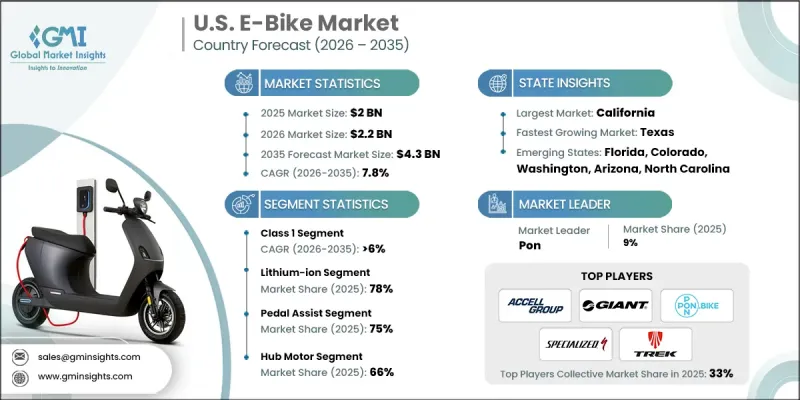
U.S. E-Bike Market was valued at USD 2 billion in 2025 and is estimated to grow at a CAGR of 7.8% to reach USD 4.3 billion by 2035.
The U.S. e-bike market is driven by increasing traffic congestion and rising fuel costs, which are encouraging consumers to adopt cost-effective commuting alternatives. E-bikes are gaining popularity as they offer a practical solution for short-distance travel, reducing travel time while addressing parking challenges. The U.S. e-bike market is also benefiting from growing environmental awareness, as consumers seek transportation options that minimize emissions and operational expenses. In addition, evolving urban infrastructure and changing consumer preferences are accelerating the shift toward micro-mobility solutions. The U.S. e-bike market continues to strengthen as technological advancements improve performance, usability, and overall riding experience, making these vehicles an attractive option for a wide range of users across urban and suburban areas.
| Market Scope | |
|---|---|
| Start Year | 2025 |
| Forecast Year | 2026-2035 |
| Start Value | $2 Billion |
| Forecast Value | $4.3 Billion |
| CAGR | 7.8% |
The U.S. e-bike market is further supported by favorable policy frameworks that promote sustainable transportation adoption. Government-led initiatives, including financial incentives and infrastructure investments, are encouraging consumers to transition toward electric mobility. Expansion of dedicated cycling pathways and improved safety measures are enhancing rider confidence and supporting daily usage. At the same time, advancements in battery systems, motor efficiency, and lightweight materials are improving product performance. Enhanced features such as longer travel range, faster charging capabilities, and integrated digital functionalities are contributing to increased consumer acceptance and market growth.
The Class 1 segment accounted for 61% share in 2025 and is expected to grow at a CAGR of 6% from 2026 to 2035. This segment is gaining traction due to its suitability for daily commuting and its compatibility with existing cycling infrastructure. These pedal-assist models provide a balanced riding experience while aligning with regulatory frameworks, making them widely accepted across various regions. Growing infrastructure accessibility is further supporting the adoption of Class 1 e-bikes, strengthening their position in the market.
The lithium-ion battery segment held a 78% share in 2025 and is projected to grow at a CAGR of 7% through 2035. Increasing demand for reliable energy storage and extended travel range is driving the adoption of lithium-ion technology. These batteries offer higher energy density, reduced weight, and longer lifecycle compared to conventional alternatives, improving convenience for both commuting and recreational use. Continuous advancements in battery technology are further enhancing efficiency and performance within the market.
California E-Bike Market held a 17% share and generated USD 128.2 million in 2025. The U.S. e-bike market in this region is expanding due to strong environmental policies and ambitious climate objectives that encourage the adoption of electric mobility solutions. Supportive initiatives focused on awareness, infrastructure development, and incentives are influencing consumer behavior, driving the transition toward eco-friendly transportation alternatives.
Key players operating in the U.S. E-Bike Market include Trek Bicycle, Specialized Bicycle Components, Giant Manufacturing, Merida Industry, Accell, Pon, Shimano, Yamaha, Aventon, and Canyon Bicycles. Companies in the U.S. E-Bike Market are strengthening their competitive position through innovation, strategic partnerships, and market expansion initiatives. Many manufacturers are investing in advanced battery technologies, lightweight frame designs, and smart connectivity features to enhance product differentiation. Expanding distribution networks and collaborating with retailers are helping companies improve market reach and accessibility. Firms are also focusing on increasing production capacity to meet growing demand while optimizing costs. In addition, branding strategies centered on sustainability and performance are attracting environmentally conscious consumers. Companies are further entering new regional markets and diversifying product portfolios to capture a broader customer base and reinforce long-term growth.
Table of Contents
Chapter 1 Methodology
- 1.1 Research approach
- 1.2 Quality Commitments
- 1.2.1 GMI AI policy & data integrity commitment
- 1.2.1.1 Source consistency protocol
- 1.2.1 GMI AI policy & data integrity commitment
- 1.3 Research Trail & Confidence Scoring
- 1.3.1 Research Trail Components
- 1.3.2 Scoring Components
- 1.4 Data Collection
- 1.4.1 Partial list of primary sources
- 1.5 Data mining sources
- 1.5.1 Paid sources
- 1.5.2 Sources, by region
- 1.6 Base estimates and calculations
- 1.6.1 Base year calculation for any one approach
- 1.7 Forecast model
- 1.7.1 Quantified market impact analysis
- 1.7.1.1 Mathematical impact of growth parameters on forecast
- 1.7.1 Quantified market impact analysis
- 1.8 Research transparency addendum
- 1.8.1 Source attribution framework
- 1.8.2 Quality assurance metrics
- 1.8.3 Our commitment to trust
Chapter 2 Executive Summary
- 2.1 Industry 360° synopsis, 2022 - 2035
- 2.2 Key market trends
- 2.2.1 Regional
- 2.2.2 Class
- 2.2.3 Battery
- 2.2.4 Motor
- 2.2.5 Propulsion
- 2.2.6 Ownership
- 2.2.7 Power Output
- 2.2.8 Application
- 2.2.9 Sales Channel
- 2.3 TAM Analysis, 2026-2035
- 2.4 CXO perspectives: Strategic imperatives
Chapter 3 Industry Insights
- 3.1 Industry ecosystem analysis
- 3.1.1 Supplier landscape
- 3.1.2 Profit margin analysis
- 3.1.3 Cost structure
- 3.1.4 Value addition at each stage
- 3.1.5 Factor affecting the value chain
- 3.1.6 Disruptions
- 3.2 Industry impact forces
- 3.2.1 Growth drivers
- 3.2.1.1 Rising demand for sustainable urban mobility
- 3.2.1.2 Expansion of cycling infrastructure
- 3.2.1.3 Technological advancements in battery and motor systems
- 3.2.1.4 Growth of last-mile delivery and micro-mobility services
- 3.2.1.5 Increasing popularity of recreational and fitness cycling
- 3.2.2 Industry pitfalls and challenges
- 3.2.2.1 High upfront purchase cost
- 3.2.2.2 Battery replacement and maintenance costs
- 3.2.2.3 Regulatory and classification variations
- 3.2.2.4 Supply chain dependency
- 3.2.3 Market opportunities
- 3.2.3.1 Expansion of cargo and utility e-bikes
- 3.2.3.2 Integration of smart and connected features
- 3.2.3.3 Growth of subscription and bike-sharing models
- 3.2.3.4 Corporate and government incentive programs
- 3.2.1 Growth drivers
- 3.3 Growth potential analysis
- 3.4 Regulatory landscape
- 3.4.1 Northeast
- 3.4.1.1 Complete Streets Act (New York)
- 3.4.1.2 Bicycle Helmet Law (Massachusetts)
- 3.4.2 Midwest
- 3.4.2.1 Share the Road Law (Minnesota)
- 3.4.2.2 Bicycle Safety Act (Illinois)
- 3.4.3 Southwest
- 3.4.3.1 Florida Bicycle Safety Statute
- 3.4.3.2 Virginia Traffic Safety Code - Bicycles
- 3.4.4 West
- 3.4.4.1 Oregon Bicycle Bill
- 3.4.4.2 Washington State Bicycle Safety Act
- 3.4.1 Northeast
- 3.5 Major market trends and disruptions
- 3.6 Future market trends
- 3.7 Porter's analysis
- 3.8 PESTEL analysis
- 3.9 Technology and innovation landscape
- 3.9.1 Current technological trends
- 3.9.2 Emerging technologies
- 3.10 Price analysis (Driven by Primary Research)
- 3.10.1 Historical Price Trend Analysis
- 3.10.2 Pricing Strategy by Player Type (Premium / Value / Cost-plus)
- 3.11 Trade data analysis (Driven by Paid Research)
- 3.11.1 Import/export volume & value trends
- 3.11.2 Key trade corridors & tariff impact
- 3.12 Cost breakdown analysis
- 3.13 Patent analysis (Driven by Primary Research)
- 3.14 Sustainability and environmental aspects
- 3.14.1 Sustainable practices
- 3.14.2 Waste reduction strategies
- 3.14.3 Energy efficiency in production
- 3.14.4 Eco-friendly Initiatives
- 3.14.5 Carbon footprint considerations
- 3.15 Impact of AI & generative AI on the market
- 3.15.1 AI-driven disruption of existing business models
- 3.15.2 GenAI use cases & adoption roadmap by segment
- 3.15.3 Risks, limitations & regulatory considerations
- 3.16 Capacity & production landscape (Driven by Primary Research)
- 3.16.1 Installed capacity by region & key producer
- 3.16.2 Capacity utilization rates & expansion pipelines
- 3.17 Forecast assumptions & scenario analysis (Driven by Primary Research)
- 3.17.1 Base Case - key macro & industry variables driving CAGR
- 3.17.2 Optimistic Scenarios - Favorable macro and industry tailwinds
- 3.17.3 Pessimistic Scenario - Macroeconomic slowdown or industry headwinds
Chapter 4 Competitive Landscape, 2025
- 4.1 Introduction
- 4.2 Company market share analysis
- 4.2.1 Northeast
- 4.2.2 Midwest
- 4.2.3 Southwest
- 4.2.4 West
- 4.3 Competitive analysis of major market players
- 4.4 Competitive positioning matrix
- 4.5 Key developments
- 4.5.1 Mergers & acquisitions
- 4.5.2 Partnerships & collaborations
- 4.5.3 New Product Launches
- 4.5.4 Expansion Plans and funding
- 4.6 Company tier benchmarking
- 4.6.1 Tier classification criteria & qualifying thresholds
- 4.6.2 Tier positioning matrix by revenue, geography & innovation
Chapter 5 Market Estimates & Forecast, By Class, 2022 - 2035 ($Mn, Units)
- 5.1 Key trends
- 5.2 Class 1
- 5.3 Class 2
- 5.4 Class 3
Chapter 6 Market Estimates & Forecast, By Battery, 2022 - 2035 ($Mn, Units)
- 6.1 Key trends
- 6.2 Lead-acid
- 6.3 Lithium-ion
- 6.4 Others
Chapter 7 Market Estimates & Forecast, By Motor, 2022 - 2035 ($Mn, Units)
- 7.1 Key trends
- 7.2 Hub motor
- 7.3 Mid motor
Chapter 8 Market Estimates & Forecast, By Propulsion, 2022 - 2035 ($Mn, Units)
- 8.1 Key trends
- 8.2 Pedal assist
- 8.3 Throttle control
Chapter 9 Market Estimates & Forecast, By Ownership, 2022 - 2035 ($Mn, Units)
- 9.1 Key trends
- 9.2 Shared
- 9.3 Personal
Chapter 10 Market Estimates & Forecast, By Power Output, 2022 - 2035 ($Mn, Units)
- 10.1 Key trends
- 10.2 Below 250W
- 10.3 250W to 750W
- 10.4 Above 750W
Chapter 11 Market Estimates & Forecast, By Application, 2022 - 2035 ($Mn, Units)
- 11.1 Key trends
- 11.2 City/Urban
- 11.3 Trekking
- 11.4 Cargo
- 11.5 Mountain/Off-Road
- 11.6 Others
Chapter 12 Market Estimates & Forecast, By Sales Channel, 2022 - 2035 ($Mn, Units)
- 12.1 Key trends
- 12.2 Online
- 12.3 Offline
Chapter 13 Market Estimates & Forecast, By Region, 2022 - 2035 ($Mn, Units)
- 13.1 Key trends
- 13.2 Northeast
- 13.2.1 Maine
- 13.2.2 New Hampshire
- 13.2.3 Vermont
- 13.2.4 Massachusetts
- 13.2.5 Rhode Island
- 13.2.6 Connecticut
- 13.2.7 New Jersey
- 13.2.8 New York
- 13.2.9 Pennsylvania
- 13.3 Midwest
- 13.3.1 Ohio
- 13.3.2 Michigan
- 13.3.3 Indiana
- 13.3.4 Illinois
- 13.3.5 Wisconsin
- 13.3.6 Minnesota
- 13.3.7 Iowa
- 13.3.8 Missouri
- 13.3.9 North Dakota
- 13.3.10 South Dakota
- 13.3.11 Nebraska
- 13.3.12 Kansas
- 13.4 South
- 13.4.1 Delaware
- 13.4.2 Maryland
- 13.4.3 Virginia
- 13.4.4 West Virginia
- 13.4.5 North Carolina
- 13.4.6 South Carolina
- 13.4.7 Georgia
- 13.4.8 Florida
- 13.4.9 Alabama
- 13.4.10 Kentucky
- 13.4.11 Mississippi
- 13.4.12 Tennessee
- 13.4.13 Arkansas
- 13.4.14 Louisiana
- 13.4.15 Oklahoma
- 13.4.16 Texas
- 13.5 West
- 13.5.1 Montana
- 13.5.2 Idaho
- 13.5.3 Wyoming
- 13.5.4 Colorado
- 13.5.5 New Mexico
- 13.5.6 Arizona
- 13.5.7 Utah
- 13.5.8 Nevada
- 13.5.9 Washington
- 13.5.10 Oregon
- 13.5.11 California
- 13.5.12 Alaska
- 13.5.13 Hawaii
Chapter 14 Company Profiles
- 14.1 Global players
- 14.1.1 Accell
- 14.1.2 Canyon Bicycles
- 14.1.3 Giant Manufacturing
- 14.1.4 Merida Industry
- 14.1.5 Pon Holdings
- 14.1.6 Shimano
- 14.1.7 Specialized Bicycle Components
- 14.1.8 Trek Bicycle
- 14.1.9 Yamaha Motor
- 14.2 Regional Players
- 14.2.1 Aventon
- 14.2.2 Juiced Bikes
- 14.2.3 Lectric eBikes
- 14.2.4 Pedego Electric Bikes
- 14.2.5 Rad Power Bikes
- 14.2.6 Ride1UP
- 14.3 Emerging Players
- 14.3.1 Blix Electric Bikes
- 14.3.2 Himiway
- 14.3.3 KHS Bicycles
- 14.3.4 MOD BIKES
- 14.3.5 Velotric
- 14.3.6 VanMoof

