
PUBLISHER: Global Market Insights Inc. | PRODUCT CODE: 2019137

PUBLISHER: Global Market Insights Inc. | PRODUCT CODE: 2019137
Automotive Display Market Opportunity, Growth Drivers, Industry Trend Analysis, and Forecast 2026 - 2035
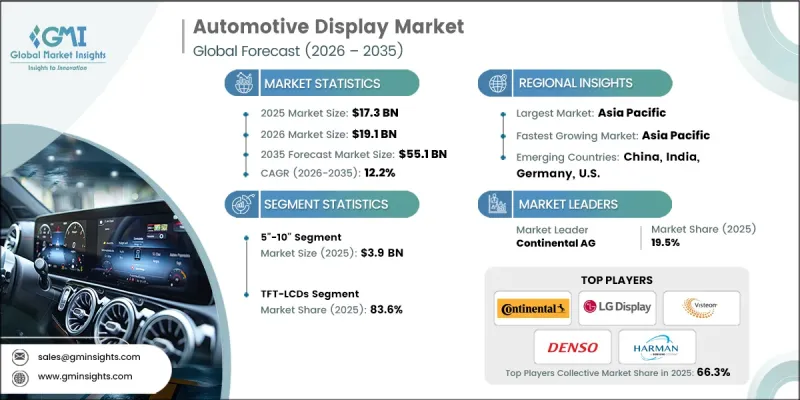
The Global Automotive Display Market was valued at USD 17.3 billion in 2025 and is estimated to grow at a CAGR of 12.2% to reach USD 55.1 billion by 2035.
The market is driven by the shift toward fully digital cockpits that feature high-resolution instrument clusters and large center stacks. Consumers are increasingly seeking intuitive ways to interact with vehicles for infotainment, navigation, and connectivity, prompting OEMs to install multiple displays across vehicle interiors. Automakers are integrating artificial intelligence, augmented reality (AR) head-up displays, and adaptive interfaces to personalize the driving experience while enhancing safety. These intelligent displays provide real-time navigation, ADAS insights, and predictive content based on driver behavior, transforming dashboards from static panels into interactive hubs. Growing demand for high-end display technologies, including OLED, QLED, curved, and ultra-wide formats, is particularly strong in luxury and performance vehicles. Manufacturers are also emphasizing sustainability and energy efficiency, driving innovation in materials and display panels to reduce power consumption while delivering superior visual performance.
| Market Scope | |
|---|---|
| Start Year | 2025 |
| Forecast Year | 2026-2035 |
| Start Value | $17.3 Billion |
| Forecast Value | $55.1 Billion |
| CAGR | 12.2% |
The 5"-10" display segment reached USD 3.9 billion in 2025. These sizes remain the most widely deployed across passenger and commercial vehicles, offering excellent visibility, functionality, and integration in instrument clusters, infotainment screens, and center dashboards. The segment's dominance reflects widespread OEM adoption, providing a balance of clarity, usability, and cost-effectiveness for in-vehicle applications.
The OLED display segment is expected to grow at a CAGR of 15.1% through 2035. The growth is driven by the increasing incorporation of OLED panels in premium and electric vehicles, as consumers demand high-contrast, flexible, and curved displays. Technological advancements have enabled energy-efficient panels with vibrant colors, making them ideal for digital cockpits and infotainment systems, while also supporting lightweight and flexible dashboard designs.
North America Automotive Display Market accounted for 20.9% share in 2025. The region is benefiting from the integration of multiple digital cockpit systems, infotainment solutions, and advanced vehicle instrument clusters designed to enhance the user experience in electric and connected vehicles. OEMs with strong regional presence and technological expertise are driving the adoption of larger, higher-resolution displays. Increasing consumer preference for personalized, interactive interfaces is expected to sustain growth across the U.S. and Canada.
Key players in the Global Automotive Display Market include Blaupunkt, Continental AG, Denso Corporation, HARMAN International, Hyundai Mobis, LG DISPLAY CO., LTD., Magneti Marelli, Mitsubishi Electric, MTA S.p.A., New Vision Display (Shenzhen) Co., Ltd., Nippon Seiki Co., Ltd., Nuline Technologies, Panasonic Automotive Systems, Pricol Ltd., Robert Bosch GmbH, SHARP, Visteon Corporation, and YAZAKI Corporation. Companies in the automotive display market are strengthening their position through continuous innovation in display technologies, including OLED, QLED, and ultra-wide formats. They are investing in R&D to improve resolution, contrast, energy efficiency, and integration with AR and AI-enabled vehicle systems. Strategic partnerships with OEMs and technology providers allow them to embed displays into connected and electric vehicles while expanding global distribution networks. Businesses are also focusing on customization, offering flexible, modular, and adaptive display solutions tailored to regional consumer preferences. Marketing, after-sales support, and software upgrades further enhance user experience and long-term adoption, enabling these companies to maintain a competitive advantage and capture a larger market share.
Table of Contents
Chapter 1 Methodology and Scope
- 1.1 Market scope and definition
- 1.2 Research design
- 1.2.1 Research approach
- 1.2.2 Data collection methods
- 1.3 Data mining sources
- 1.3.1 Global
- 1.3.2 Regional/Country
- 1.4 Base estimates and calculations
- 1.4.1 Base year calculation
- 1.4.2 Key trends for market estimation
- 1.5 Primary research and validation
- 1.5.1 Primary sources
- 1.6 Forecast model
- 1.7 Research assumptions and limitations
Chapter 2 Executive Summary
- 2.1 Industry 360° synopsis, 2022 - 2035
- 2.2 Key market trends
- 2.2.1 Technology trends
- 2.2.2 Display type trends
- 2.2.3 Screen Size trends
- 2.2.4 Vehicle type trends
- 2.2.5 Technology trends
- 2.2.6 Regional trends
- 2.3 TAM Analysis, 2026-2035
- 2.4 CXO perspectives: Strategic imperatives
Chapter 3 Industry Insights
- 3.1 Industry ecosystem analysis
- 3.1.1 Supplier Landscape
- 3.1.2 Profit Margin
- 3.1.3 Cost structure
- 3.1.4 Value addition at each stage
- 3.1.5 Factor affecting the value chain
- 3.1.6 Disruptions
- 3.2 Industry impact forces
- 3.2.1 Growth drivers
- 3.2.1.1 The rise of electric vehicles industry
- 3.2.1.2 Incorporation of ADAS in automotive
- 3.2.1.3 Growing demand for connected vehicles
- 3.2.1.4 Consumers preference towards larger display
- 3.2.1.5 Rising demand for in-car infotainment systems
- 3.2.2 Industry pitfalls and challenges
- 3.2.2.1 Threats of cyberattacks and data breaching
- 3.2.2.2 Semiconductor shortage affects production
- 3.2.3 Market opportunities
- 3.2.3.1 Expansion of OLED and advanced display adoption
- 3.2.3.2 Integration of AR/VR and heads-up displays
- 3.2.1 Growth drivers
- 3.3 Growth potential analysis
- 3.4 Regulatory landscape
- 3.4.1 North America
- 3.4.2 Europe
- 3.4.3 Asia Pacific
- 3.4.4 Latin America
- 3.4.5 Middle East & Africa
- 3.5 Porter's analysis
- 3.6 PESTEL analysis
- 3.7 Price trends (Driven by Primary Research)
- 3.7.1 Historical Price Analysis (2023-2026)
- 3.7.2 Price Trend Drivers
- 3.7.3 Regional Price Variations
- 3.7.4 Price Forecast (2027-2036)
- 3.8 Pricing Strategies (Driven by Primary Research)
- 3.8.1 Emerging Business Models
- 3.9 Trade Data Analysis (Driven by Primary Research)
- 3.9.1 Import/Export Value Trends
- 3.9.2 Key Trade Corridors & Tariff Impact
- 3.10 Impact of AI & Generative AI on the Market
- 3.10.1 AI-Driven Disruption of Existing Business Models
- 3.10.2 GenAI Use Cases & Adoption Roadmap by Segment
- 3.10.3 Risks, Limitations & Regulatory Considerations
- 3.11 Capacity & Production Landscape (Driven by Primary Research)
- 3.11.1 Installed Capacity by Region & Key Producer
- 3.11.2 Capacity Utilization Rates & Expansion Pipelines
Chapter 4 Competitive Landscape, 2025
- 4.1 Introduction
- 4.2 Company market share analysis
- 4.2.1 By region
- 4.2.1.1 North America
- 4.2.1.2 Europe
- 4.2.1.3 Asia Pacific
- 4.2.1.4 Latin America
- 4.2.1.5 Middle East & Africa
- 4.2.2 Market concentration analysis
- 4.2.1 By region
- 4.3 Competitive benchmarking of key players
- 4.3.1 Financial performance comparison
- 4.3.1.1 Revenue
- 4.3.1.2 Profit margin
- 4.3.1.3 R&D
- 4.3.2 Product portfolio comparison
- 4.3.2.1 Product range breadth
- 4.3.2.2 Technology
- 4.3.2.3 Innovation
- 4.3.3 Geographic presence comparison
- 4.3.3.1 Global footprint analysis
- 4.3.3.2 Service network coverage
- 4.3.3.3 Market penetration by region
- 4.3.4 Competitive positioning matrix
- 4.3.4.1 Leaders
- 4.3.4.2 Challengers
- 4.3.4.3 Followers
- 4.3.4.4 Niche players
- 4.3.5 Strategic outlook matrix
- 4.3.1 Financial performance comparison
- 4.4 Key developments
- 4.4.1 Mergers and acquisitions
- 4.4.2 Partnerships and collaborations
- 4.4.3 Technological advancements
- 4.4.4 Expansion and investment strategies
- 4.4.5 Digital transformation initiatives
- 4.5 Emerging/ startup competitors landscape
Chapter 5 Market Estimates and Forecast, By Technology, 2022 - 2035 (USD Million & Units)
- 5.1 Key trends
- 5.2 TFT-LCDs
- 5.3 OLEDs
Chapter 6 Market Estimates and Forecast, By Display Type, 2022 - 2035 (USD Million & Units)
- 6.1 Key trends
- 6.2 Center Stack Displays
- 6.3 Instrument Cluster Displays
- 6.3.1 Digital instrument panels
- 6.3.2 Driver information displays
- 6.3.3 Speedometer/tachometer screens
- 6.3.4 Others
- 6.4 Rear-seat Entertainment Displays
- 6.5 Head-Up Displays (HUD)
- 6.6 Others
Chapter 7 Market Estimates and Forecast, By Screen Size, 2022 - 2035 (USD Million & Units)
- 7.1 Key trends
- 7.2 Less than 5"
- 7.3 5" to 10"
- 7.4 Above 10"
Chapter 8 Market Estimates and Forecast, By Vehicle Type, 2022 - 2035 (USD Million & Units)
- 8.1 Key trends
- 8.2 Passenger Cars
- 8.2.1 Hatchback
- 8.2.2 Sedan
- 8.2.3 Utility Vehicle
- 8.3 Commercial Vehicles
- 8.3.1 Light Commercial Vehicles (LCV)
- 8.3.2 Heavy Commercial Vehicles (HCV)
Chapter 9 Market Estimates and Forecast, By Region, 2022 - 2035 (USD Million & Units)
- 9.1 Key trends
- 9.2 North America
- 9.2.1 U.S.
- 9.2.2 Canada
- 9.3 Europe
- 9.3.1 Germany
- 9.3.2 UK
- 9.3.3 France
- 9.3.4 Spain
- 9.3.5 Italy
- 9.3.6 Russia
- 9.3.7 Rest of Europe
- 9.4 Asia Pacific
- 9.4.1 China
- 9.4.2 India
- 9.4.3 Japan
- 9.4.4 Australia
- 9.4.5 South Korea
- 9.4.6 Rest of Asia-Pacific
- 9.5 Latin America
- 9.5.1 Brazil
- 9.5.2 Mexico
- 9.5.3 Argentina
- 9.5.4 Rest of Latin America
- 9.6 Middle East and Africa
- 9.6.1 South Africa
- 9.6.2 Saudi Arabia
- 9.6.3 UAE
- 9.6.4 Rest of Middle East and Africa
Chapter 10 Company Profiles
- 10.1 Global Key Players
- 10.1.1 Continental AG
- 10.1.2 Denso Corporation
- 10.1.3 HARMAN International
- 10.1.4 LG DISPLAY CO., LTD.
- 10.1.5 Mitsubishi Electric
- 10.1.6 Panasonic Automotive Systems
- 10.1.7 Robert Bosch GmbH
- 10.1.8 Visteon Corporation
- 10.2 Regional key players
- 10.2.1 North America
- 10.2.1.1 ON Semiconductor (onsemi)
- 10.2.1.2 Littelfuse, Inc.
- 10.2.1.3 Powerex, Inc.
- 10.2.2 Asia Pacific
- 10.2.2.1 Hyundai Mobis
- 10.2.2.2 Nippon Seiki Co., Ltd.
- 10.2.2.3 Pricol Ltd.
- 10.2.2.4 YAZAKI
- 10.2.2.5 SHARP
- 10.2.3 Europe
- 10.2.3.1 Magneti Marelli
- 10.2.1 North America
- 10.3 Niche Players/Disruptors
- 10.3.1 Blaupunkt
- 10.3.2 MTA S.p.A. (Italy)
- 10.3.3 New Vision Display (Shenzhen) Co, Ltd.
- 10.3.4 Nuline Technologies

