
PUBLISHER: Global Market Insights Inc. | PRODUCT CODE: 2019176

PUBLISHER: Global Market Insights Inc. | PRODUCT CODE: 2019176
Guar Complex Market Opportunity, Growth Drivers, Industry Trend Analysis, and Forecast 2026 - 2035
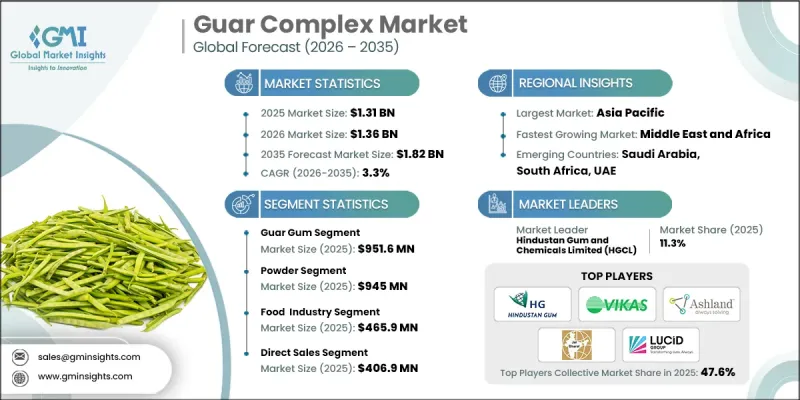
The Global Guar Complex Market was valued at USD 1.31 billion in 2025 and is estimated to grow at a CAGR of 3.3% to reach USD 1.82 billion by 2035.
The guar complex market encompasses a structured value chain that begins with the cultivation and supply of guar seeds and extends to the processing of derivatives such as guar gum, splits, and powder. The crop is primarily cultivated in semi-arid regions due to its low water requirements and ability to withstand harsh climatic conditions, which supports consistent raw material availability. The guar complex industry plays a vital role across multiple sectors due to its functionality as a natural thickening and binding agent. Guar-derived products are widely recognized for their ability to regulate viscosity, improve stability, and enhance water retention in formulations. These functional benefits support their widespread use across diverse industrial applications. In recent years, advancements in processing technologies have significantly improved product quality and operational efficiency. Manufacturers are increasingly adopting modern milling, purification, and viscosity control techniques to meet application-specific requirements. Automation and enhanced quality monitoring systems are also contributing to reduced waste and improved consistency. Growing emphasis on plant-based and biodegradable materials is further accelerating demand within the guar complex market.
| Market Scope | |
|---|---|
| Start Year | 2025 |
| Forecast Year | 2026-2035 |
| Start Value | $1.31 Billion |
| Forecast Value | $1.82 Billion |
| CAGR | 3.3% |
The guar gum segment accounted for USD 951.6 million in 2025. Its widespread utilization is driven by its strong thickening and stabilizing properties, making it suitable for a variety of applications across multiple industries. Market trends are increasingly focused on achieving consistent product performance, tailored functional attributes, and alignment with clean-label requirements. In addition, guar meals continue to generate demand due to their nutritional profile and cost-effectiveness, supporting their use in feed-related applications. The cultivation and processing of guar crops remain closely linked to the need for reliable downstream products that support consistent supply and application performance across different end-use sectors.
The food segment reached USD 465.9 million in 2025. Demand within this segment is driven by the need for effective texture control, stabilization, and moisture management in product formulations. Manufacturers are increasingly focusing on achieving uniform consistency and reliable processing outcomes. Functional requirements such as viscosity control, structural stability, and resistance to temperature variations are key considerations in product development. Maintaining consistent product characteristics during processing and storage is essential, which continues to support the use of guar-based ingredients. The ability to enhance formulation performance while ensuring stability and uniformity remains a key factor driving adoption across food-related applications.
North America Guar Complex Market is projected to grow from USD 249.4 million in 2025 to USD 319.1 million by 2035, reflecting steady expansion over the forecast period. Growth in the region is supported by sustained demand across food processing, industrial applications, and personal care sectors. Market dynamics are influenced by the need for reliable supply chains, consistent product quality, and technical support. Demand is also shaped by increasing preference for plant-based materials with verified performance standards. In the United States, buyers prioritize products that maintain consistent viscosity, meet defined quality specifications, and ensure timely delivery. Stable sourcing strategies and inventory management practices are contributing to balanced market conditions, while continued demand for processed goods supports overall growth in the guar complex market.
Key companies operating in the Global Guar Complex Market include Agro Gums, Ashland Global Holdings Inc., Dabur India Ltd., Hindustan Gum and Chemicals Limited (HGCL), Vikas WSP Limited, Guar Resources LLC, India Glycols Limited, Jai Bharat Gum and Chemicals Ltd., Lamberti S.p.A., Lucid Group, and Neelkanth Polymers. Companies in the guar complex market are focusing on strengthening their market position through investments in advanced processing technologies and quality enhancement initiatives. Many players are prioritizing product innovation to develop customized solutions that meet specific industry requirements. Strategic collaborations and long-term supply agreements are being used to secure raw material availability and expand market reach. Companies are also improving operational efficiency by adopting automation and advanced quality control systems. In addition, there is a growing emphasis on sustainable practices, including the promotion of plant-based and biodegradable products. Expanding distribution networks and maintaining consistent product standards are further supporting customer retention and long-term growth.
Table of Contents
Chapter 1 Methodology & Scope
- 1.1 Market scope and definition
- 1.2 Research design
- 1.2.1 Research approach
- 1.2.2 Data collection methods
- 1.3 Data mining sources
- 1.3.1 Global
- 1.3.2 Regional/Country
- 1.4 Base estimates and calculations
- 1.4.1 Base year calculation
- 1.4.2 Key trends for market estimation
- 1.5 Primary research and validation
- 1.5.1 Primary sources
- 1.6 Forecast model
- 1.7 Research assumptions and limitations
Chapter 2 Executive Summary
- 2.1 Industry 360° synopsis
- 2.2 Key market trends
- 2.2.1 Type
- 2.2.2 Form
- 2.2.3 Application
- 2.2.4 Distribution Channel
- 2.2.5 Regional
- 2.3 TAM Analysis, 2026-2035
- 2.4 CXO perspectives: Strategic imperatives
- 2.5 Future outlook and strategic recommendations
Chapter 3 Industry Insights
- 3.1 Industry ecosystem analysis
- 3.1.1 Supplier landscape
- 3.1.2 Profit margin
- 3.1.3 Value addition at each stage
- 3.1.4 Factor affecting the value chain
- 3.1.5 Disruptions
- 3.2 Industry impact forces
- 3.2.1 Growth drivers
- 3.2.1.1 Growing demand for natural thickening agents across industries
- 3.2.1.2 Expansion of oilfield applications supporting guar consumption growth
- 3.2.1.3 Increasing preference for plant based functional ingredients
- 3.2.2 Pitfalls/challenge
- 3.2.2.1 Price volatility due to seasonal supply variations frequently
- 3.2.2.2 Limited storage infrastructure impacting raw material quality levels
- 3.2.3 Opportunities
- 3.2.3.1 Growing use in processed food applications worldwide steadily
- 3.2.3.2 Product customization for diverse industrial application requirements needs
- 3.2.1 Growth drivers
- 3.3 Growth potential analysis
- 3.4 Regulatory landscape
- 3.4.1 North America
- 3.4.2 Europe
- 3.4.3 Asia Pacific
- 3.4.4 Latin America
- 3.4.5 Middle East & Africa
- 3.5 Porter's analysis
- 3.6 PESTEL analysis
- 3.7 Technology and innovation landscape
- 3.7.1 Current technological trends
- 3.7.2 Emerging technologies
- 3.8 Price trends
- 3.8.1 By region
- 3.8.2 By type
- 3.9 Future market trends
- 3.10 Technology and innovation landscape
- 3.10.1 Current technological trends
- 3.10.2 Emerging technologies
- 3.11 Patent landscape
- 3.12 Trade statistics (HS code)
- 3.12.1 Major importing countries
- 3.12.2 Major exporting countries
- 3.13 Sustainability and environmental aspects
- 3.13.1 Sustainable practices
- 3.13.2 Waste reduction strategies
- 3.13.3 Energy efficiency in production
- 3.13.4 Eco-friendly initiatives
- 3.14 Carbon footprint consideration
Chapter 4 Competitive Landscape, 2025
- 4.1 Introduction
- 4.2 Company market share analysis
- 4.2.1 By region
- 4.2.1.1 North America
- 4.2.1.2 Europe
- 4.2.1.3 Asia Pacific
- 4.2.1.4 LATAM
- 4.2.1.5 MEA
- 4.2.1 By region
- 4.3 Company matrix analysis
- 4.4 Competitive analysis of major market players
- 4.5 Competitive positioning matrix
- 4.6 Key developments
- 4.6.1 Mergers & acquisitions
- 4.6.2 Partnerships & collaborations
- 4.6.3 New product launches
- 4.6.4 Expansion plans
Chapter 5 Market Estimates and Forecast, By Type, 2022-2035 (USD Million) (Kilo Tons)
- 5.1 Key trends
- 5.2 Guar gum
- 5.3 Guar meal
- 5.4 Guar seeds
Chapter 6 Market Estimates and Forecast, By Form, 2022-2035 (USD Million) (Kilo Tons)
- 6.1 Key trends
- 6.2 Powder
- 6.3 Granules
- 6.4 Liquid
Chapter 7 Market Estimates and Forecast, By Application, 2022-2035 (USD Million) (Kilo Tons)
- 7.1 Key trends
- 7.2 Food Industry
- 7.3 Bakery & Confectionery
- 7.4 Dairy & Frozen Desserts
- 7.5 Sauces & Dressings
- 7.6 Beverages Industry
- 7.7 Others
Chapter 8 Market Estimates and Forecast, By Distribution Channel, 2022-2035 (USD Million) (Kilo Tons)
- 8.1 Key trends
- 8.2 Direct sales
- 8.3 Indirect sales
- 8.4 Online retail
- 8.5 Specialty stores
- 8.6 Supermarkets/hypermarkets
- 8.7 Others
Chapter 9 Market Estimates and Forecast, By Region, 2022-2035 (USD Million) (Kilo Tons)
- 9.1 Key trends
- 9.2 North America
- 9.2.1 U.S.
- 9.2.2 Canada
- 9.3 Europe
- 9.3.1 Germany
- 9.3.2 UK
- 9.3.3 France
- 9.3.4 Spain
- 9.3.5 Italy
- 9.3.6 Rest of Europe
- 9.4 Asia Pacific
- 9.4.1 China
- 9.4.2 India
- 9.4.3 Japan
- 9.4.4 Australia
- 9.4.5 South Korea
- 9.4.6 Rest of Asia Pacific
- 9.5 Latin America
- 9.5.1 Brazil
- 9.5.2 Mexico
- 9.5.3 Argentina
- 9.5.4 Rest of Latin America
- 9.6 Middle East and Africa
- 9.6.1 Saudi Arabia
- 9.6.2 South Africa
- 9.6.3 UAE
- 9.6.4 Rest of Middle East and Africa
Chapter 10 Company Profiles
- 10.1 Agro Gums
- 10.2 Ashland Global Holdings Inc.
- 10.3 Dabur India Ltd.
- 10.4 Hindustan Gum and Chemicals Limited (HGCL)
- 10.5 Vikas WSP Limited
- 10.6 Guar Resources LLC
- 10.7 India Glycols Limited
- 10.8 Jai Bharat Gum and Chemicals Ltd.
- 10.9 Lamberti S.p.A.
- 10.10 Lucid Group
- 10.11 Neelkanth Polymers

