
PUBLISHER: Global Market Insights Inc. | PRODUCT CODE: 2019221

PUBLISHER: Global Market Insights Inc. | PRODUCT CODE: 2019221
Parametric Insurance Market Opportunity, Growth Drivers, Industry Trend Analysis, and Forecast 2026 - 2035
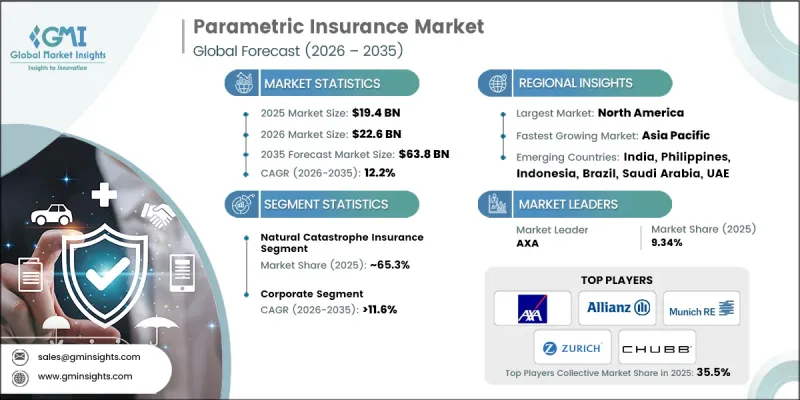
The Global Parametric Insurance Market was valued at USD 19.4 billion in 2025 and is estimated to grow at a CAGR of 12.2% to reach USD 63.8 billion by 2035.
The market is propelled by a rising global emphasis on financial resilience against climate volatility and operational disruptions, driving demand for innovative risk transfer solutions. Parametric insurance is becoming a preferred mechanism across sectors, including agriculture, energy, infrastructure, travel, and disaster management. Unlike conventional indemnity policies, parametric products deliver predetermined payouts triggered by measurable events such as rainfall, wind speed, earthquake magnitude, or temperature thresholds. This approach allows organizations to address exposure to unpredictable environmental and operational risks while avoiding lengthy claims assessments. Market expansion is further supported by the integration of advanced analytics, real-time data collection, and predictive modeling, enabling insurers to offer accurate, data-driven solutions that enhance trust and operational efficiency across diverse industries.
| Market Scope | |
|---|---|
| Start Year | 2025 |
| Forecast Year | 2026-2035 |
| Start Value | $19.4 Billion |
| Forecast Value | $63.8 Billion |
| CAGR | 12.2% |
Parametric insurance has evolved into highly data-driven instruments, relying on IoT devices, satellite monitoring, weather stations, and analytics platforms to verify triggers and automate settlements. Insurers are prioritizing the accuracy of indices, data transparency, and machine-learning-enabled forecasting to ensure dependable payouts. Underwriting increasingly incorporates geospatial analytics and climate modeling to support predictive risk assessment and maintain customer confidence.
The natural catastrophe insurance segment held 65.3% share in 2025 and is expected to expand at a CAGR of 11.3% through 2035. The growing frequency and severity of climate-related disasters such as hurricanes, floods, earthquakes, and droughts are driving demand for rapid liquidity solutions. Parametric insurance allows automatic payouts when predefined thresholds are exceeded, bypassing prolonged damage evaluation processes.
The corporate segment held a 49% share in 2025 and is forecasted to grow at a CAGR of 11.6% from 2026 to 2035. Large enterprises across sectors such as energy, agriculture, aviation, logistics, and infrastructure are increasingly using parametric insurance to mitigate financial exposure from climate events, operational disruptions, and supply chain risks. Rapid payouts triggered by environmental or operational events help companies minimize losses and maintain continuity.
U.S. Parametric Insurance Market held a 79.2% share, generating USD 5.5 billion in 2025. Growth is fueled by the rising frequency of severe storms, floods, hurricanes, and wildfires, leading businesses, infrastructure operators, and government entities to seek fast liquidity solutions. Parametric insurance ensures rapid financial support through predefined triggers, reducing the time and complexity of traditional loss assessments.
Key players in the Global Parametric Insurance Market include Chubb, Aon, Allianz, Swiss Re, Zurich, AXA, Lloyd's, Marsh & McLennan, Munich Re, and Berkshire Hathaway Specialty Insurance. Companies in the Parametric Insurance Market are strengthening their foothold by investing in advanced data analytics, predictive modeling, and IoT-based monitoring to enhance trigger accuracy and claim automation. Strategic collaborations with reinsurers and climate research organizations enable broader coverage offerings and improved risk assessment. Firms are expanding their regional presence to access emerging markets with growing disaster exposure. Product innovation, including customized solutions for corporates and governments, helps differentiate offerings. Additionally, companies focus on transparency, customer education, and digital platforms to streamline the purchase and claims process, building trust and increasing market penetration.
Table of Contents
Chapter 1 Methodology
- 1.1 Research approach
- 1.2 Quality Commitments
- 1.2.1 GMI AI policy & data integrity commitment
- 1.2.1.1 Source consistency protocol
- 1.2.1 GMI AI policy & data integrity commitment
- 1.3 Research Trail & Confidence Scoring
- 1.3.1 Research Trail Components
- 1.3.2 Scoring Components
- 1.4 Data Collection
- 1.4.1 Partial list of primary sources
- 1.5 Data mining sources
- 1.5.1 Paid sources
- 1.5.1.1 Sources, by region
- 1.5.1 Paid sources
- 1.6 Base estimates and calculations
- 1.6.1 Base year calculation for any one approach
- 1.7 Forecast
- 1.7.1 Quantified market impact analysis
- 1.7.1.1 Mathematical impact of growth parameters on forecast
- 1.7.1 Quantified market impact analysis
- 1.8 Research transparency addendum
- 1.8.1 Source attribution framework
- 1.8.2 Quality assurance metrics
- 1.8.3 Our commitment to trust
Chapter 2 Executive Summary
- 2.1 Industry 360° synopsis, 2022 - 2035
- 2.2 Key market trends
- 2.2.1 Regional
- 2.2.2 Coverage
- 2.2.3 Distribution Channel
- 2.2.4 Application
- 2.2.5 End Use
- 2.3 TAM Analysis, 2026-2035
- 2.4 CXO perspectives: Strategic imperatives
Chapter 3 Industry Insights
- 3.1 Industry ecosystem analysis
- 3.1.1 Supplier landscape
- 3.1.2 Profit margin analysis
- 3.1.3 Cost structure
- 3.1.4 Value addition at each stage
- 3.1.5 Factor affecting the value chain
- 3.1.6 Disruptions
- 3.2 Industry impact forces
- 3.2.1 Growth drivers
- 3.2.1.1 Rising frequency of climate-related disasters
- 3.2.1.2 Faster claims settlement compared to traditional insurance
- 3.2.1.3 Growing adoption in agriculture and food security programs
- 3.2.1.4 Expansion of advanced weather and data analytics infrastructure
- 3.2.2 Industry pitfalls and challenges
- 3.2.2.1 Limited awareness among businesses and consumers
- 3.2.2.2 Regulatory and legal uncertainty in some regions
- 3.2.3 Market opportunities
- 3.2.3.1 Expansion into emerging markets with high climate exposure
- 3.2.3.2 Increasing demand from renewable energy operators
- 3.2.3.3 Development of parametric coverage for supply chain disruptions
- 3.2.3.4 Integration with climate adaptation and sustainability initiatives
- 3.2.1 Growth drivers
- 3.3 Growth potential analysis
- 3.4 Regulatory guideline
- 3.4.1 North America
- 3.4.1.1 U.S.: Parametric Insurance Regulatory Recognition & State-Level Approvals
- 3.4.1.2 Canada: Climate Risk Insurance Programs & Index-Based Coverage Frameworks
- 3.4.2 Europe
- 3.4.2.1 Germany: Climate Risk Insurance Policies & Parametric Innovation Programs
- 3.4.2.2 UK: Innovative Insurance Regulation & Lloyd’s Parametric Market Development
- 3.4.2.3 France: Climate Risk Financing & Parametric Insurance Regulations
- 3.4.2.4 Italy: Natural Catastrophe Insurance Reforms & Parametric Solutions
- 3.4.3 Asia Pacific
- 3.4.3.1 China: Parametric Insurance Pilots & Agricultural Index Insurance Programs
- 3.4.3.2 India: Weather-Based Crop Insurance & Disaster Risk Financing Programs
- 3.4.3.3 Japan: Parametric Catastrophe Insurance & Disaster Risk Innovation
- 3.4.3.4 Australia: Climate Risk Insurance Initiatives & Parametric Market Development.
- 3.4.4 Latin America
- 3.4.4.1 Brazil: National Urban Mobility Plan & ITS Deployment Programs
- 3.4.4.2 Mexico: Catastrophe Bond & Parametric Disaster Insurance Framework
- 3.4.4.3 Argentina: Agricultural Climate Risk Insurance Policies
- 3.4.5 MEA
- 3.4.5.1 UAE: Climate Risk Insurance Innovation & Regulatory Sandboxes
- 3.4.5.2 Saudi Arabia: Vision 2030 Financial Sector Development Program
- 3.4.5.3 South Africa: Climate Risk Insurance & Agricultural Index Programs
- 3.4.1 North America
- 3.5 Porter's analysis
- 3.6 PESTEL analysis
- 3.7 Technology and Innovation landscape
- 3.7.1 Current technological trends
- 3.7.2 Emerging technologies
- 3.8 Patent analysis (Driven by Primary Research)
- 3.9 Sustainability and environmental impact analysis
- 3.9.1 Sustainable practices
- 3.9.2 Waste reduction strategies
- 3.9.3 Energy efficiency in production
- 3.9.4 Eco-friendly initiatives
- 3.9.5 Carbon footprint considerations
- 3.10 Future outlook & opportunities
- 3.11 Impact of AI & Generative AI on the Market
- 3.11.1 AI-Driven Disruption of Existing Business Models
- 3.11.2 GenAI Use Cases & Adoption Roadmap by Segment
- 3.11.3 Risks, Limitations & Regulatory Considerations
- 3.12 Global Investment Landscape and Strategic Opportunities
- 3.12.1 InsurTech Venture Capital and Growth Equity
- 3.12.2 Catastrophe Bond and Insurance-Linked Securities (ILS) Growth
- 3.12.3 Sovereign and Regional Risk Pool Capitalization
- 3.12.4 Embedded Parametric Insurance and Distribution Innovation
- 3.12.5 Climate Adaptation and Resilience Infrastructure Financing
- 3.13 Forecast assumptions & scenario analysis (Driven by Primary Research)
- 3.13.1 Base Case - key macro & industry variables driving CAGR
- 3.13.2 Optimistic Scenarios - Favorable Macro and Industry Tailwinds
- 3.13.3 Pessimistic Scenario - Macroeconomic slowdown or industry headwinds
Chapter 4 Competitive Landscape, 2025
- 4.1 Introduction
- 4.2 Company market share analysis
- 4.2.1 North America
- 4.2.2 Europe
- 4.2.3 Asia Pacific
- 4.2.4 Latin America
- 4.2.5 MEA
- 4.3 Competitive analysis of major market players
- 4.4 Competitive positioning matrix
- 4.5 Key developments
- 4.5.1 Mergers & acquisitions
- 4.5.2 Partnerships & collaborations
- 4.5.3 New Product Launches
- 4.5.4 Expansion Plans and funding
- 4.6 Company Tier Benchmarking
- 4.6.1 Tier Classification Criteria & Qualifying Thresholds
- 4.6.2 Tier Positioning Matrix by Revenue, Geography & Innovation
Chapter 5 Market Estimates & Forecast, By Coverage, 2022 - 2035 ($Bn)
- 5.1 Key trends
- 5.2 Natural Catastrophe Insurance
- 5.2.1 Typhoon and Storm Coverage
- 5.2.2 Earthquake Protection
- 5.2.3 Flood Risk Coverage
- 5.2.4 Wildfire and Drought Protection
- 5.3 Specialty Parametric Insurance
- 5.3.1 Event Cancellation (sports, concerts, tourism)
- 5.3.2 Marine & Aviation Delay
- 5.3.3 Construction Delay-in-Start-Up (DSU)
- 5.3.4 Space/Satellite Risks
- 5.3.5 Infrastructure project risk
- 5.4 Others
Chapter 6 Market Estimates & Forecast, By Distribution Channel, 2022 - 2035 ($Bn)
- 6.1 Key trends
- 6.2 Direct sales
- 6.3 Brokers/Agents
- 6.4 Online platforms
- 6.5 Banks
- 6.6 Others
Chapter 7 Market Estimates & Forecast, By Application 2022 - 2035 ($Bn)
- 7.1 Key trends
- 7.2 Manufacturing and Industrial
- 7.3 Agriculture and Food Production
- 7.4 Technology and Telecommunications
- 7.5 Energy and Utilities
- 7.6 BFSI
- 7.7 Transportation and Logistics
- 7.8 Government and Public Sector
- 7.9 Others
Chapter 8 Market Estimates & Forecast, By End Use, 2022 - 2035 ($Bn)
- 8.1 Key trends
- 8.2 Individual
- 8.3 Corporate
- 8.4 Government
Chapter 9 Market Estimates & Forecast, By Region, 2022 - 2035 ($Bn)
- 9.1 Key trends
- 9.2 North America
- 9.2.1 US
- 9.2.2 Canada
- 9.3 Europe
- 9.3.1 Germany
- 9.3.2 UK
- 9.3.3 France
- 9.3.4 Italy
- 9.3.5 Spain
- 9.3.6 Russia
- 9.3.7 Netherlands
- 9.3.8 Belgium
- 9.4 Asia Pacific
- 9.4.1 China
- 9.4.2 India
- 9.4.3 Japan
- 9.4.4 Australia
- 9.4.5 Singapore
- 9.4.6 Thailand
- 9.4.7 South Korea
- 9.4.8 Philippines
- 9.4.9 Indonesia
- 9.5 Latin America
- 9.5.1 Brazil
- 9.5.2 Mexico
- 9.5.3 Argentina
- 9.6 MEA
- 9.6.1 South Africa
- 9.6.2 Saudi Arabia
- 9.6.3 UAE
Chapter 10 Company Profiles
- 10.1 Global Players
- 10.1.1 Allianz
- 10.1.2 AXA
- 10.1.3 Berkshire Hathaway
- 10.1.4 Chubb
- 10.1.5 Generali Group
- 10.1.6 Hannover Re
- 10.1.7 Lloyd's
- 10.1.8 Munich Re
- 10.1.9 SCOR
- 10.1.10 Swiss Re
- 10.1.11 Zurich
- 10.2 Regional Players
- 10.2.1 Everest Re
- 10.2.2 Liberty Mutual Reinsurance
- 10.2.3 PartnerRe
- 10.2.4 RenaissanceRe Holdings
- 10.2.5 Tokio Marine HCC
- 10.2.6 Transatlantic
- 10.3 Emerging Players
- 10.3.1 Beazley
- 10.3.2 KB Insurance
- 10.3.3 Samsung Fire & Marine Insurance

