
PUBLISHER: Global Market Insights Inc. | PRODUCT CODE: 2027522

PUBLISHER: Global Market Insights Inc. | PRODUCT CODE: 2027522
Gardening Tools Market Opportunity, Growth Drivers, Industry Trend Analysis, and Forecast 2026 - 2035
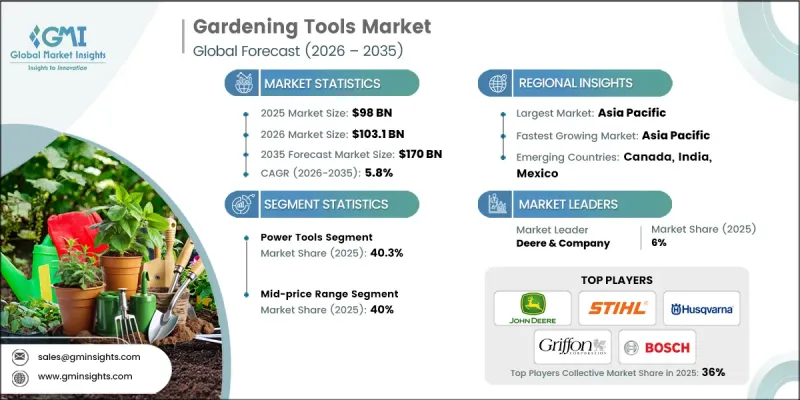
The Global Gardening Tools Market was valued at USD 98 billion in 2025 and is estimated to grow at a CAGR of 5.8% to reach USD 170 billion by 2035.
The market is undergoing a significant transformation, driven by three key trends that are reshaping the design, production, and use of gardening tools worldwide. First, traditional heavy, fuel-powered tools are being replaced by lighter, eco-friendly, and ergonomically optimized alternatives. Manufacturers are now offering carbon-fiber-handled, battery-operated, sensor-enabled tools that deliver equal or higher performance while improving durability, energy efficiency, and user comfort. Advances in lithium-ion battery and brushless motor technologies allow electric tools to achieve 90%-95% efficiency of conventional gasoline tools while reducing noise and environmental impact. Another major trend is the adoption of modular, multi-attachment tools powered by universal battery platforms. These systems allow a single battery to operate multiple tools such as trimmers, chainsaws, blowers, and edgers, cutting storage, transport, and purchase costs while enhancing convenience for both homeowners and professionals.
| Market Scope | |
|---|---|
| Start Year | 2025 |
| Forecast Year | 2026-2035 |
| Start Value | $98 Billion |
| Forecast Value | $170 Billion |
| CAGR | 5.8% |
The power tools segment accounted for 40.3% share in 2025, reflecting growing consumer demand for high-performance, cordless equipment. These tools handle heavy-duty gardening tasks with minimal physical effort, appealing to professional landscapers and DIY enthusiasts alike. Their versatility, efficiency, and convenience make them the preferred choice in both residential and commercial settings, reinforcing their dominance in the market.
The mid-price range segment held a 40% share in 2025. This segment attracts consumers seeking a balance between affordability and durability, particularly the growing "prosumer" demographic that demands high-quality tools without a premium price tag. Mid-range tools offer reliability and performance, meeting the needs of both hobbyists and semi-professional users while driving steady market growth.
U.S. Gardening Tools Market generated USD 22.8 billion, equivalent to 88.6% share in 2025, and is projected to grow at a CAGR of 6.2% through 2035. Growth is fueled by a strong DIY culture, increasing adoption of battery-operated power equipment, and the rising trend of transforming lawns into personalized garden spaces. Millennial homeowners and urban gardening enthusiasts are driving demand, while a well-established retail infrastructure, including large home improvement stores and a robust e-commerce ecosystem, ensures easy access to hand and power tools. Rapid adoption of ergonomic designs and smart gardening technologies also shortens replacement cycles, boosting both residential and professional landscaping tool sales.
Key players operating in the Global Gardening Tools Market include Husqvarna AB, Makita Corporation, Briggs & Stratton LLC, Robert Bosch GmbH, AriensCo, Fiskars Corporation, Deere & Company, Bully Tools Inc., Stanley Black & Decker Inc., The Toro Company, Yamabiko Corporation, STIHL Holding AG & Co. KG, Techtronic Industries Co. Ltd. (TTI), Honda Motor Co. Ltd., Kubota Corporation, Griffon Corporation Inc., and Zenport Industries. Companies in the Gardening Tools Market are strengthening their presence through product innovation, distribution expansion, and digital marketing initiatives. Manufacturers focus on developing lightweight, durable, and battery-powered tools while integrating ergonomic designs and smart technology. Partnerships with home improvement retailers and e-commerce platforms help widen product availability and reach. Brands emphasize lifestyle-driven marketing campaigns, highlighting convenience, sustainability, and performance benefits to engage urban and suburban consumers. Strategic investments in modular and multi-attachment systems reduce costs and improve customer value, while expansion into emerging markets enhances competitiveness. Continuous R&D, after-sales support, and promotional strategies ensure brand loyalty and long-term market leadership.
Table of Contents
Chapter 1 Research Methodology
- 1.1 Research approach
- 1.2 Quality Commitments
- 1.2.1 GMI AI policy & data integrity commitment
- 1.2.1.1 Source consistency protocol
- 1.2.1 GMI AI policy & data integrity commitment
- 1.3 Research Trail & Confidence Scoring
- 1.3.1 Research Trail Components
- 1.3.2 Scoring Components
- 1.4 Data Collection
- 1.4.1 Partial list of primary sources
- 1.5 Data mining sources
- 1.5.1 Paid sources
- 1.5.1.1 Sources, by region
- 1.5.1 Paid sources
- 1.6 Base estimates and calculations
- 1.6.1 Base year calculation for any one approach
- 1.7 Forecast model
- 1.7.1 Quantified market impact analysis
- 1.7.1.1 Mathematical impact of growth parameters on forecast
- 1.7.1 Quantified market impact analysis
- 1.8 Research transparency addendum
- 1.8.1 Source attribution framework
- 1.8.2 Quality assurance metrics
- 1.8.3 Our commitment to trust
Chapter 2 Executive Summary
- 2.1 Industry 360° synopsis, 2022-2035
- 2.2 Key market trends
- 2.2.1 Region
- 2.2.1.1 North America
- 2.2.1.2 Europe
- 2.2.1.3 Asia Pacific
- 2.2.1.4 Middle East & Africa
- 2.2.1.5 Latin America
- 2.2.2 Product Type
- 2.2.3 Price Range
- 2.2.4 End Use
- 2.2.5 Distribution Channel
- 2.2.1 Region
Chapter 3 Industry Insights
- 3.1 Industry ecosystem analysis
- 3.1.1 Factor affecting the value chain
- 3.1.2 Profit Margin Analysis by Value Chain Stage (Driven by Primary Research)
- 3.1.3 Disruptions
- 3.1.4 Manufacturers
- 3.1.5 Distributors
- 3.2 Industry Impact forces
- 3.2.1 Growth drivers
- 3.2.2 Industry pitfalls & challenges
- 3.2.3 Opportunities
- 3.3 Growth potential analysis
- 3.4 Supply Chain Analysis
- 3.4.1 Global Supply Chain Structure
- 3.4.2 Raw Material Sourcing (Steel, Aluminium, Plastics, Electronics)
- 3.4.3 Component Manufacturing & Tier Supplier Network
- 3.4.4 Final Assembly & Production Footprint
- 3.4.5 China Sourcing Dynamics & Risks
- 3.4.6 China Exit & China+1 Strategies
- 3.4.7 Alternative Manufacturing Hubs (Mexico, Taiwan, Vietnam, India)
- 3.5 Technology and innovation landscape
- 3.5.1 Current technological trends
- 3.5.2 Emerging technologies
- 3.6 Price trends Analysis (Driven by Primary Research)
- 3.6.1 Historical Price Trend Analysis (Driven by Primary Research) (2022-2025)
- 3.6.2 Pricing Strategy by Player Type (Premium / Value / Cost-plus) (Driven by Primary Research)
- 3.6.3 Price Variation by Product Type & End-Use
- 3.6.4 Geographic Price Benchmarking
- 3.6.5 Impact of Raw Material Costs on Pricing
- 3.6.6 Regional Price Variations & Purchasing Power Parity
- 3.6.7 Private Label vs Branded Pricing Dynamics
- 3.7 Regulatory landscape
- 3.7.1 Global Regulatory Landscape
- 3.7.1.1 North America (EPA, CPSC, OSHA)
- 3.7.1.2 Europe (CE Marking, REACH, RoHS)
- 3.7.1.3 Asia Pacific
- 3.7.1.3.1 China Standards (GB, CCC)
- 3.7.1.3.2 Japan Standards (JIS, PSE)
- 3.7.1.3.3 Taiwan Standards & Import Requirements
- 3.7.1.3.4 India Standards (BIS)
- 3.7.1.4 Latin America (MERCOSUR Regulations, Brazil ANVISA)
- 3.7.1.5 Middle East & Africa (GCC Standardization, SASO)
- 3.7.2 Labelling & Safety Disclosure Requirements
- 3.7.3 Impact on Market Entry & Product Development
- 3.7.1 Global Regulatory Landscape
- 3.8 Patent Landscape (Driven by Primary Research)
- 3.8.1 Patent Filing Trends by Technology Category (2022-2025)
- 3.8.2 Key Patent Holders & Innovation Leaders
- 3.8.3 Technology Domain Analysis (Hand Tools vs Power Tools)
- 3.8.4 Geographic Distribution of Patent Activity
- 3.8.5 Key Patent Citations & White Space Analysis
- 3.8.6 Emerging Technology Patents (Robotics, IoT, Battery Tech)
- 3.9 Porter’s analysis
- 3.10 PESTEL analysis
- 3.11 Trade Data Analysis (Driven by paid database)
- 3.11.1 Import/Export Volume & Value Trends (2022-2025)
- 3.11.2 Key Trade Corridors & Routes
- 3.11.2.1 China to North America/Europe Trade Flows
- 3.11.2.2 Taiwan Export Markets & Manufacturing Role
- 3.11.2.3 Mexico to US (USMCA Benefits)
- 3.11.2.4 Intra-Asia Trade Dynamics
- 3.11.3 HS Code Classification & Tariff Structure
- 3.11.4 Tariff Impact Analysis by Product Type
- 3.11.5 Non-Tariff Barriers & Trade Restrictions
- 3.11.6 Trade Policy Changes & Future Outlook (2025-2027)
- 3.12 Impact of AI & Generative AI on the Market
- 3.12.1 AI-Driven Disruption of Existing Business Models
- 3.12.2 GenAI Use Cases & Adoption Roadmap by Segment
- 3.13 Capacity & Production Landscape (Driven by Primary Research)
- 3.13.1 Installed Capacity by Region & Key Producer (Driven by Primary Research)
- 3.13.1.1 North America Manufacturing Footprint
- 3.13.1.2 Europe Manufacturing Footprint
- 3.13.1.3 Asia Pacific Manufacturing Footprint (China, Taiwan, Vietnam, India)
- 3.13.2 Capacity Utilization Rates & Expansion Pipelines (Driven by Primary Research)
- 3.13.1 Installed Capacity by Region & Key Producer (Driven by Primary Research)
Chapter 4 Competitive Landscape, 2025
- 4.1 Introduction
- 4.2 Company market share analysis
- 4.2.1 By region
- 4.2.1.1 North America
- 4.2.1.2 Europe
- 4.2.1.3 Asia Pacific
- 4.2.1.3.1 China
- 4.2.1.3.2 India
- 4.2.1.3.3 Japan
- 4.2.1.3.4 South Korea
- 4.2.1.3.5 Australia
- 4.2.1.3.6 Taiwan
- 4.2.1.4 Middle East & Africa
- 4.2.1.5 Latin America
- 4.2.1 By region
- 4.3 Competitive positioning matrix
- 4.4 Strategic outlook matrix
- 4.5 Company matrix analysis
- 4.6 Key developments
- 4.6.1 Mergers & acquisitions
- 4.6.2 Partnerships & collaborations
- 4.6.3 New Product Launches
- 4.6.4 Expansion Plans
Chapter 5 Market Estimates & Forecast, By Product Type, 2022-2035 (USD Billion) (Million Units)
- 5.1 Key trends
- 5.2 Hand tools
- 5.2.1 Shovels and spades
- 5.2.2 Pruners and shears
- 5.2.3 Rakes
- 5.2.4 Trowels
- 5.2.5 Hoes
- 5.2.6 Forks
- 5.3 Power tools
- 5.3.1 Lawn mowers
- 5.3.2 Leaf Blowers
- 5.3.3 Hedge trimmers
- 5.3.4 Tillers
- 5.4 Watering equipment
- 5.4.1 Hoses
- 5.4.2 Sprinklers
- 5.4.3 Watering cans
- 5.4.4 Drip irrigation systems
- 5.5 Others
- 5.5.1 Plant supports
- 5.5.2 Garden gloves
- 5.5.3 Tool storage
- 5.5.4 Compost bins
Chapter 6 Market Estimates & Forecast, By Price Range, 2022-2035 (USD Billion) (Million Units)
- 6.1 Key trends
- 6.2 Low
- 6.3 Mid
- 6.4 High
Chapter 7 Market Estimates & Forecast, By End Use, 2022-2035 (USD Billion) (Million Units)
- 7.1 Key trends
- 7.2 Residential
- 7.2.1 Single-Family Homes
- 7.2.2 Multi-Family Housing & Condominiums
- 7.2.3 Urban Gardening & Rooftop Gardens
- 7.3 Commercial
- 7.3.1 Professional Landscaping Services
- 7.3.2 Municipal & Government Properties
- 7.3.3 Golf Courses & Sports Facilities
- 7.3.4 Hotels & Hospitality
- 7.3.5 Corporate Campuses & Business Parks
Chapter 8 Market Estimates & Forecast, By Distribution Channel, 2022-2035 (USD Billion) (Million Units)
- 8.1 Key trends
- 8.2 Online
- 8.2.1 E-commerce
- 8.2.2 Company websites
- 8.3 Offline
- 8.3.1 Supermarkets
- 8.3.2 Specialty stores
- 8.3.3 Others (Departmental stores, etc.)
Chapter 9 Market Estimates & Forecast, By Region, 2022-2035 (USD Billion) (Million Units)
- 9.1 Key trends
- 9.2 North America
- 9.2.1 U.S.
- 9.2.2 Canada
- 9.3 Europe
- 9.3.1 UK
- 9.3.2 Germany
- 9.3.3 France
- 9.3.4 Italy
- 9.3.5 Spain
- 9.3.6 Russia
- 9.4 Asia Pacific
- 9.4.1 China
- 9.4.2 India
- 9.4.3 Japan
- 9.4.4 South Korea
- 9.4.5 Australia
- 9.4.6 Taiwan
- 9.5 Latin America
- 9.5.1 Brazil
- 9.5.2 Mexico
- 9.6 MEA
- 9.6.1 South Africa
- 9.6.2 Saudi Arabia
- 9.6.3 UAE
Chapter 10 Company Profiles
- 10.1 AriensCo
- 10.2 Briggs & Stratton LLC
- 10.3 Bully Tools Inc.
- 10.4 Deere & Company
- 10.5 Fiskars Corporation
- 10.6 Griffon Corporation Inc.
- 10.7 Honda Motor Co. Ltd.
- 10.8 Husqvarna AB
- 10.9 Kubota Corporation
- 10.10 Makita Corporation
- 10.11 Robert Bosch GmbH
- 10.12 Stanley Black & Decker Inc.
- 10.13 STIHL Holding AG & Co. KG
- 10.14 Techtronic Industries Co. Ltd. (TTI)
- 10.15 The Toro Company
- 10.16 Yamabiko Corporation
- 10.17 Zenport Industries

