
PUBLISHER: Global Market Insights Inc. | PRODUCT CODE: 2027527

PUBLISHER: Global Market Insights Inc. | PRODUCT CODE: 2027527
North America Electric Bus Market Opportunity, Growth Drivers, Industry Trend Analysis, and Forecast 2026 - 2035
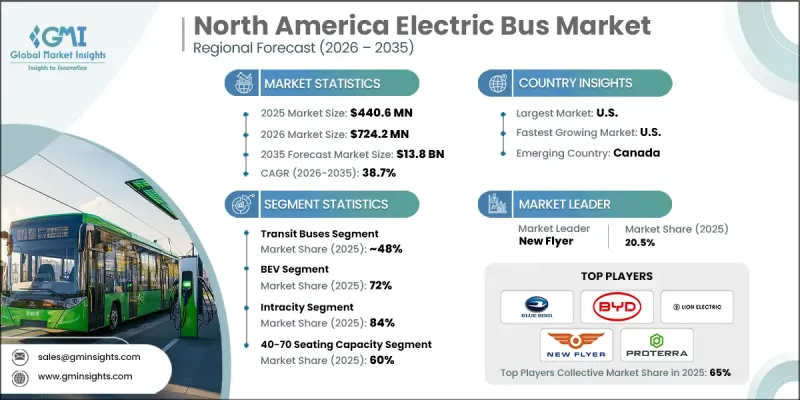
North America Electric Bus Market was valued at USD 440.6 million in 2025 and is estimated to grow at a CAGR of 38.7% to reach USD 13.8 billion by 2035.
The market is experiencing rapid transformation as regulatory frameworks and sustainability targets reshape public transportation systems. Strong policy direction across the United States and Canada is accelerating the shift toward zero-emission mobility, creating a structured pathway for widespread electric bus adoption. Electrification goals for public transit fleets are encouraging agencies to transition away from conventional propulsion systems, resulting in increased procurement activity. Financial incentives and funding programs are further supporting this transition by reducing capital barriers and enabling fleet modernization. At the same time, continuous improvements in battery technology, including higher energy density and faster charging capabilities, are enhancing operational efficiency and route flexibility. Advancements in charging infrastructure are also minimizing downtime and improving fleet utilization. The growing emphasis on cleaner transportation solutions across municipal and institutional sectors is reinforcing long-term demand, positioning electric buses as a central component of future mobility strategies in North America.
| Market Scope | |
|---|---|
| Start Year | 2025 |
| Forecast Year | 2026-2035 |
| Start Value | $440.6 Million |
| Forecast Value | $13.8 Billion |
| CAGR | 38.7% |
Public funding initiatives and supportive regulatory policies are playing a crucial role in driving adoption across the region. Financial assistance programs are helping transit agencies offset the initial investment required for electric buses and related infrastructure. These efforts are enabling fleet expansion while easing budget constraints. In parallel, ongoing technological advancements are improving performance metrics such as range, durability, and charging efficiency, making electric buses increasingly viable for large-scale deployment. The push toward electrified school transportation is also contributing to market growth, supported by rising awareness of environmental and health considerations and increased institutional adoption.
The transit bus segment held a 48% share in 2025 and is projected to grow at a CAGR of 40% from 2026 to 2035. Transit authorities across major urban areas are accelerating electrification initiatives to meet emission reduction targets and improve air quality. This shift is driving consistent demand through large-volume procurement cycles, encouraging manufacturers to scale production and strengthen supply capabilities.
The battery electric buses segment accounted for 72% share in 2025 and is expected to grow at a CAGR of 39% through 2035. Declining battery costs combined with improvements in energy storage technology are enhancing affordability and performance. Increased driving range and reduced system weight are lowering total ownership costs, making battery electric buses a preferred choice over conventional and alternative fuel options. Strong regulatory preference for fully zero-emission technologies is further accelerating adoption.
California Electric Bus Market held a 31% share, generating USD 125 million in 2025. The state's regulatory environment is a key factor behind this leadership position, with clear mandates supporting the transition to zero-emission fleets. These policies provide long-term visibility for manufacturers and encourage large-scale procurement. Additionally, financial incentives for vehicle acquisition, infrastructure development, and workforce training are supporting faster adoption across transit agencies.
Key companies operating in the North America Electric Bus Market include BYD, New Flyer, Proterra, Blue Bird, Gillig, Lion Electric, GreenPower Motor, Motor Coach Industries, Yutong Bus, and Thomas Built Buses. Companies in the North America Electric Bus Market are strengthening their competitive position through strategic investments in technology, partnerships, and capacity expansion. Significant focus is placed on advancing battery systems, improving vehicle performance, and enhancing charging solutions to meet evolving operational requirements. Collaborations with public transit agencies and infrastructure providers are helping accelerate deployment and ensure seamless integration. Manufacturers are also expanding production facilities and supply chain networks to support rising demand. Customization of electric bus models for different transit needs is becoming a key differentiator. Additionally, companies are leveraging government incentives and financing solutions to improve affordability while strengthening after-sales service and maintenance capabilities to build long-term customer relationships.
Table of Contents
Chapter 1 Methodology
- 1.1 Research approach
- 1.2 Quality Commitments
- 1.2.1 GMI AI policy & data integrity commitment
- 1.2.1.1 Source consistency protocol
- 1.2.1 GMI AI policy & data integrity commitment
- 1.3 Research Trail & Confidence Scoring
- 1.3.1 Research Trail Components
- 1.3.2 Scoring Components
- 1.4 Data Collection
- 1.4.1 Partial list of primary sources
- 1.5 Data mining sources
- 1.5.1 Paid sources
- 1.5.2 Sources, by region
- 1.6 Base estimates and calculations
- 1.6.1 Base year calculation
- 1.7 Forecast model
- 1.7.1 Quantified market impact analysis
- 1.7.1.1 Mathematical impact of growth parameters on forecast
- 1.7.1 Quantified market impact analysis
- 1.8 Research transparency addendum
- 1.8.1 Source attribution framework
- 1.8.2 Quality assurance metrics
- 1.8.3 Our commitment to trust
Chapter 2 Executive Summary
- 2.1 Industry 360° synopsis, 2022 - 2035
- 2.2 Key market trends
- 2.2.1 Regional
- 2.2.2 Vehicle
- 2.2.3 Propulsion
- 2.2.4 Service
- 2.2.5 Seating Capacity
- 2.3 TAM Analysis, 2026-2035
- 2.4 CXO perspectives: Strategic imperatives
Chapter 3 Industry Insights
- 3.1 Industry ecosystem analysis
- 3.1.1 Supplier landscape
- 3.1.2 Profit margin analysis
- 3.1.3 Cost structure
- 3.1.4 Value addition at each stage
- 3.1.5 Factor affecting the value chain
- 3.1.6 Disruptions
- 3.2 Industry impact forces
- 3.2.1 Growth drivers
- 3.2.1.1 Government emission reduction mandates & zero-emission policies
- 3.2.1.2 Expansion of public transit electrification programs
- 3.2.1.3 Advancements in battery and charging technologies
- 3.2.1.4 Rising urbanization and smart city initiatives
- 3.2.2 Industry pitfalls and challenges
- 3.2.2.1 High upfront vehicle and infrastructure costs
- 3.2.2.2 Charging infrastructure limitations
- 3.2.2.3 Grid capacity and energy management issues
- 3.2.2.4 Battery lifecycle and replacement costs
- 3.2.3 Market opportunities
- 3.2.3.1 Expansion of fleet electrification targets
- 3.2.3.2 Integration of smart charging and V2G technologies
- 3.2.3.3 Growth in school bus electrification
- 3.2.3.4 Public-private partnerships
- 3.2.1 Growth drivers
- 3.3 Growth potential analysis
- 3.4 Technology and innovation landscape
- 3.4.1 Current technological trends
- 3.4.2 Emerging technologies
- 3.5 Price analysis (Driven by Primary Research)
- 3.5.1 Historical Price Trend Analysis
- 3.5.2 Pricing Strategy by Player Type (Premium / Value / Cost-plus)
- 3.6 Regulatory landscape
- 3.6.1 U.S.
- 3.6.1.1 Environmental Protection Agency (EPA)
- 3.6.1.2 National Highway Traffic Safety Administration (NHTSA)
- 3.6.1.3 Occupational Safety and Health Administration (OSHA)
- 3.6.1.4 Federal transit administration (FTA) regulations
- 3.6.1.5 State-level zero-emission bus mandates
- 3.6.2 Canada
- 3.6.2.1 Transport Canada
- 3.6.2.2 Canadian Motor Vehicle Safety Standards (CMVSS)
- 3.6.2.3 Environment and Climate Change Canada (ECCC)
- 3.6.2.4 Provincial zero-emission transit policies
- 3.6.2.5 Utility and grid interconnection regulations
- 3.6.1 U.S.
- 3.7 Porter’s analysis
- 3.8 PESTEL analysis
- 3.9 Trade data analysis (Driven by Paid Research)
- 3.9.1 Import/export volume & value trends
- 3.9.2 Key trade corridors & tariff impact
- 3.10 Impact of AI & generative AI on the market
- 3.10.1 AI-driven disruption of existing business models
- 3.10.2 GenAI use cases & adoption roadmap by segment
- 3.10.3 Risks, limitations & regulatory considerations
- 3.11 Capacity & production landscape (Driven by Primary Research)
- 3.11.1 Installed capacity by region & key producer
- 3.11.2 Capacity utilization rates & expansion pipelines
- 3.12 Cost breakdown analysis
- 3.13 Patent analysis (Driven by Primary Research)
- 3.14 Major market trends and disruptions
- 3.15 Future market trends
- 3.16 Sustainability and environmental aspects
- 3.16.1 Sustainable practices
- 3.16.2 Waste reduction strategies
- 3.16.3 Energy efficiency in production
- 3.16.4 Eco-friendly Initiatives
- 3.16.5 Carbon footprint considerations
- 3.17 Forecast assumptions & scenario analysis (Driven by Primary Research)
- 3.17.1 Base Case - key macro & industry variables driving CAGR
- 3.17.2 Optimistic Scenarios - Favorable macro and industry tailwinds
- 3.17.3 Pessimistic Scenario - Macroeconomic slowdown or industry headwinds
Chapter 4 Competitive Landscape, 2025
- 4.1 Introduction
- 4.2 Company market share analysis
- 4.2.1 U.S.
- 4.2.2 Canada
- 4.3 Competitive analysis of major market players
- 4.4 Competitive positioning matrix
- 4.5 Key developments
- 4.5.1 Mergers & acquisitions
- 4.5.2 Partnerships & collaborations
- 4.5.3 New Product Launches
- 4.5.4 Expansion Plans and funding
- 4.6 Company tier benchmarking
- 4.6.1 Tier classification criteria & qualifying thresholds
- 4.6.2 Tier positioning matrix by revenue, geography & innovation
Chapter 5 Market Estimates & Forecast, By Vehicle, 2022 - 2035 ($Mn, Units)
- 5.1 Key trends
- 5.2 Transit buses
- 5.2.1 Standard 12 m city buses
- 5.2.2 Articulated buses
- 5.2.3 Others
- 5.3 Coach buses
- 5.3.1 Intercity scheduled coaches
- 5.3.2 Luxury and sleeper coaches
- 5.3.3 Others
- 5.4 School buses
- 5.5 Shuttle and airport buses
- 5.6 Others
Chapter 6 Market Estimates & Forecast, By Service, 2022 - 2035 ($Mn, Units)
- 6.1 Key trends
- 6.2 Intercity
- 6.3 Intracity
Chapter 7 Market Estimates & Forecast, By Propulsion, 2022 - 2035 ($Mn, Units)
- 7.1 Key trends
- 7.2 BEV
- 7.3 FCEV
- 7.4 PHEV
- 7.5 HEV
Chapter 8 Market Estimates & Forecast, By Seating Capacity, 2022 - 2035 ($Mn, Units)
- 8.1 Key trends
- 8.2 Below 40
- 8.3 40-70
- 8.4 Above 70
Chapter 9 Market Estimates & Forecast, By Region, 2022 - 2035 ($Mn, Units)
- 9.1 Key trends
- 9.2 U.S.
- 9.2.1 Northeast
- 9.2.1.1 Maine
- 9.2.1.2 New Hampshire
- 9.2.1.3 Vermont
- 9.2.1.4 Massachusetts
- 9.2.1.5 Rhode Island
- 9.2.1.6 Connecticut
- 9.2.1.7 New Jersey
- 9.2.1.8 New York
- 9.2.1.9 Pennsylvania
- 9.2.2 Midwest
- 9.2.2.1 Ohio
- 9.2.2.2 Michigan
- 9.2.2.3 Indiana
- 9.2.2.4 Illinois
- 9.2.2.5 Wisconsin
- 9.2.2.6 Minnesota
- 9.2.2.7 Iowa
- 9.2.2.8 Missouri
- 9.2.2.9 North Dakota
- 9.2.2.10 South Dakota
- 9.2.2.11 Nebraska
- 9.2.2.12 Kansas
- 9.2.3 South
- 9.2.3.1 Delaware
- 9.2.3.2 Maryland
- 9.2.3.3 Virginia
- 9.2.3.4 West Virginia
- 9.2.3.5 North Carolina
- 9.2.3.6 South Carolina
- 9.2.3.7 Georgia
- 9.2.3.8 Florida
- 9.2.3.9 Alabama
- 9.2.3.10 Kentucky
- 9.2.3.11 Mississippi
- 9.2.3.12 Tennessee
- 9.2.3.13 Arkansas
- 9.2.3.14 Louisiana
- 9.2.3.15 Oklahoma
- 9.2.3.16 Texas
- 9.2.4 West
- 9.2.4.1 Montana
- 9.2.4.2 Idaho
- 9.2.4.3 Wyoming
- 9.2.4.4 Colorado
- 9.2.4.5 New Mexico
- 9.2.4.6 Arizona
- 9.2.4.7 Utah
- 9.2.4.8 Nevada
- 9.2.4.9 Washington
- 9.2.4.10 Oregon
- 9.2.4.11 California
- 9.2.4.12 Alaska
- 9.2.4.13 Hawaii
- 9.2.1 Northeast
- 9.3 Canada
- 9.3.1 British Columbia
- 9.3.2 Alberta
- 9.3.3 Saskatchewan
- 9.3.4 Manitoba
- 9.3.5 Ontario
- 9.3.6 Quebec
- 9.3.7 New Brunswick
- 9.3.8 Nova Scotia
- 9.3.9 Prince Edward Island
- 9.3.10 Newfoundland and Labrador
Chapter 10 Company Profiles
- 10.1 Global Players
- 10.1.1 BYD
- 10.1.2 Gillig
- 10.1.3 Motor Coach Industries
- 10.1.4 New Flyer
- 10.1.5 Nova Bus
- 10.1.6 Prevost
- 10.1.7 Yutong Bus
- 10.2 Regional Players
- 10.2.1 Blue Bird
- 10.2.2 ElDorado National
- 10.2.3 GreenPower Motor Company
- 10.2.4 Lion Electric
- 10.2.5 Micro Bird
- 10.2.6 Proterra
- 10.2.7 Thomas Built Buses
- 10.2.8 Vicinity Motor
- 10.3 Emerging Players
- 10.3.1 ARBOC
- 10.3.2 Lightning eMotors
- 10.3.3 Phoenix Motorcars
- 10.3.4 SEA Electric
- 10.3.5 Trans Tech Bus

