
PUBLISHER: Global Market Insights Inc. | PRODUCT CODE: 2027543

PUBLISHER: Global Market Insights Inc. | PRODUCT CODE: 2027543
Yogurt Drinks Market Opportunity, Growth Drivers, Industry Trend Analysis, and Forecast 2026 - 2035
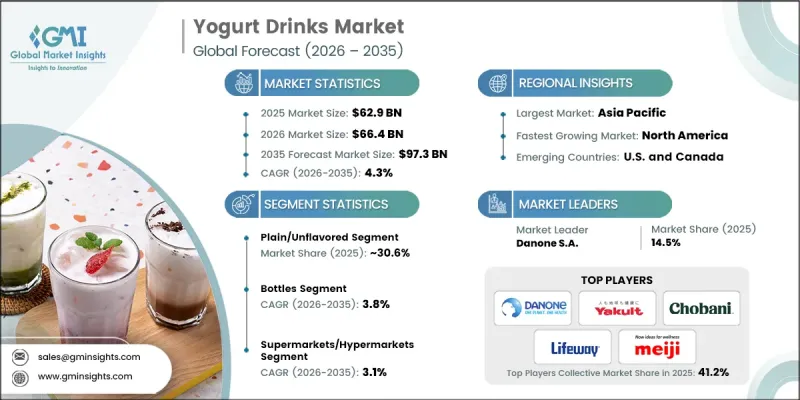
The Global Yogurt Drinks Market was valued at USD 62.9 billion in 2025 and is estimated to grow at a CAGR of 4.3% to reach USD 97.3 billion by 2035.
Market growth is driven by rising consumer awareness of health and wellness, particularly the demand for functional beverages that support digestion, immunity, and overall well-being. Increasing interest in plant-based alternatives is expanding the market, as consumers seek dairy-free options aligned with vegan lifestyles and lactose-free dietary preferences. At the same time, manufacturers are focusing on innovation by enriching yogurt drinks with added nutrients, vitamins, and probiotics to enhance their functional appeal. Flavor diversification continues to attract a broad consumer base, while packaging innovations are improving convenience and sustainability. Bottled formats remain dominant due to portability and branding advantages, while alternative packaging options are gaining traction among consumers seeking environmentally responsible choices. These combined trends highlight a shift toward premium, health-focused, and convenient beverage solutions that continue to shape market expansion.
| Market Scope | |
|---|---|
| Start Year | 2025 |
| Forecast Year | 2026-2035 |
| Start Value | $62.9 Billion |
| Forecast Value | $97.3 Billion |
| CAGR | 4.3% |
The plain or unflavored yogurt drinks segment accounted for 30.6% share in 2025 and is expected to grow at a CAGR of 2.6% through 2035. This segment remains highly relevant among health-conscious consumers who prioritize low sugar content, high protein levels, and probiotic benefits. The broader yogurt drinks market continues to evolve with a wide variety of flavor profiles designed to meet diverse consumer preferences and dietary requirements, ensuring consistent demand across multiple segments.
The bottles segment held a 44.3% share in 2025 and is projected to grow at a CAGR of 3.8% from 2026 to 2035. Their widespread adoption is supported by ease of use, portability, and availability across multiple retail channels. Bottles also provide strong branding opportunities, allowing manufacturers to effectively communicate product benefits and nutritional value. In addition, alternative packaging formats are emerging to meet the needs of consumers seeking convenience and environmentally friendly solutions, contributing to ongoing innovation in product presentation.
North America Yogurt Drinks Market is expected to grow at a CAGR of 4.8% during 2026 to 2035. The region represents a mature yet expanding market, supported by strong consumer demand for functional and premium beverages. Increasing awareness of health benefits, combined with a preference for innovative and value-added products, is driving adoption. The United States and Canada play a leading role in shaping market trends, particularly in the areas of plant-based formulations and probiotic beverages. Distribution is supported by a well-developed retail network, including supermarkets, convenience stores, and growing e-commerce platforms, which enhance product accessibility and visibility.
Key players operating in the Global Yogurt Drinks Market include Danone S.A., Nestle S.A., Yakult Honsha Co., Ltd., Chobani LLC, Arla Foods, Fonterra Co-operative Group, Lifeway Foods Inc., Meiji Holdings Co., Ltd., Morinaga Milk Industry, Muller Group (UK), Nippon Luna Co., Ltd., and Yotsuba Milk Products. Companies in the Yogurt Drinks Market are implementing strategies such as expanding product portfolios with functional and plant-based offerings to meet evolving consumer preferences. Investments in research and development are enabling the creation of innovative formulations with enhanced nutritional benefits and improved taste profiles. Strategic partnerships and distribution agreements are helping companies strengthen their global reach and improve market penetration. Brands are also focusing on sustainable packaging solutions and eco-friendly production methods to align with environmental goals. Additionally, marketing initiatives that emphasize health benefits, convenience, and premium quality are being used to attract and retain consumers, while digital platforms are leveraged to boost brand visibility and engagement.
Table of Contents
Chapter 1 Methodology & Scope
- 1.1 Research approach
- 1.2 Quality Commitments
- 1.2.1 GMI AI policy & data integrity commitment
- 1.2.1.1 Source consistency protocol
- 1.2.1 GMI AI policy & data integrity commitment
- 1.3 Research Trail & Confidence Scoring
- 1.3.1 Research Trail Components
- 1.3.2 Scoring Components
- 1.4 Data Collection
- 1.4.1 Partial list of primary sources
- 1.5 Data mining sources
- 1.5.1 Paid sources
- 1.5.1.1 Sources, by region
- 1.5.1 Paid sources
- 1.6 Base estimates and calculations
- 1.6.1 Base year calculation for any one approach
- 1.7 Forecast model
- 1.7.1 Quantified market impact analysis
- 1.7.1.1 Mathematical impact of growth parameters on forecast
- 1.7.1 Quantified market impact analysis
- 1.8 Research transparency addendum
- 1.8.1 Source attribution framework
- 1.8.2 Quality assurance metrics
- 1.8.3 Our commitment to trust
Chapter 2 Executive Summary
- 2.1 Industry 360° synopsis
- 2.2 Key market trends
- 2.2.1 Regional
- 2.2.2 Flavor Type
- 2.2.3 Packaging Type
- 2.2.4 Distribution Channel
- 2.3 TAM Analysis, 2025-2034
- 2.4 CXO perspectives: Strategic imperatives
Chapter 3 Industry Insights
- 3.1 Industry ecosystem analysis
- 3.1.1 Supplier landscape
- 3.1.2 Profit margin
- 3.1.3 Value addition at each stage
- 3.1.4 Factor affecting the value chain
- 3.1.5 Disruptions
- 3.2 Industry impact forces
- 3.2.1 Growth drivers
- 3.2.1.1 Rising consumer preference for probiotic beverages supporting digestive health and immunity worldwide
- 3.2.1.2 Expanding flavored yogurt drink varieties attracting younger consumers and diverse taste preferences globally
- 3.2.1.3 Rapid growth of organized retail and e-commerce distribution channels globally
- 3.2.2 Industry pitfalls and challenges
- 3.2.2.1 High refrigeration and cold chain logistics requirements increasing distribution costs globally
- 3.2.2.2 Rising lactose intolerance concerns among consumers limiting traditional dairy yogurt drink consumption
- 3.2.2.3 Intense competition from plant-based probiotic beverages and alternative functional drinks
- 3.2.3 Market opportunities
- 3.2.3.1 Increasing demand for functional beverages with probiotics vitamins and added nutrients
- 3.2.3.2 Rapid market expansion across Asia Pacific driven by urbanization and lifestyle changes
- 3.2.3.3 Innovation in sustainable packaging and portable formats improving consumer convenience and appeal
- 3.2.1 Growth drivers
- 3.3 Growth potential analysis
- 3.4 Regulatory landscape
- 3.4.1 North America
- 3.4.2 Europe
- 3.4.3 Asia Pacific
- 3.4.4 Latin America
- 3.4.5 Middle East & Africa
- 3.5 Porter’s analysis
- 3.6 PESTEL analysis
- 3.7 Price trends
- 3.7.1 By region
- 3.7.2 By flavor
- 3.8 Future market trends
- 3.9 Technology and Innovation landscape
- 3.9.1 Current technological trends
- 3.9.2 Emerging technologies
- 3.10 Patent Landscape
- 3.11 Trade statistics (HS code)
- 3.11.1 Major importing countries
- 3.11.2 Major exporting countries
- 3.12 Sustainability and environmental aspects
- 3.12.1 Sustainable practices
- 3.12.2 Waste reduction strategies
- 3.12.3 Energy efficiency in production
- 3.12.4 Eco-friendly initiatives
Chapter 4 Competitive Landscape, 2025
- 4.1 Introduction
- 4.2 Company market share analysis
- 4.2.1 By region
- 4.2.1.1 North America
- 4.2.1.2 Europe
- 4.2.1.3 Asia Pacific
- 4.2.1.4 LATAM
- 4.2.1.5 MEA
- 4.2.1 By region
- 4.3 Company matrix analysis
- 4.4 Competitive analysis of major market players
- 4.5 Competitive positioning matrix
- 4.6 Key developments
- 4.6.1 Mergers & acquisitions
- 4.6.2 Partnerships & collaborations
- 4.6.3 New Product Launches
- 4.6.4 Expansion Plans
Chapter 5 Market Estimates and Forecast, By Flavor Type, 2022-2035 (USD Million) (Kilo Tons)
- 5.1 Key trends
- 5.2 Plain/Unflavored
- 5.3 Strawberry
- 5.4 Blueberry
- 5.5 Mango
- 5.6 Peach
- 5.7 Vanilla
- 5.8 Mixed Berries
- 5.9 Others
Chapter 6 Market Estimates and Forecast, By Packaging Type, 2022-2035 (USD Million) (Kilo Tons)
- 6.1 Key trends
- 6.2 Bottles
- 6.3 Tetra Packs/Cartons
- 6.4 Cups & Containers
- 6.5 Pouches & Flexible
- 6.6 Premium & Specialty
Chapter 7 Market Estimates and Forecast, By Distribution Channel, 2022-2035 (USD Million) (Kilo Tons)
- 7.1 Key trends
- 7.2 Supermarkets/Hypermarkets
- 7.3 Convenience Stores
- 7.4 Specialty Health/Organic Stores
- 7.5 Online Retailers/E-commerce
- 7.6 Foodservice Channels
- 7.7 Pharmacy & Healthcare
- 7.8 Others
Chapter 8 Market Estimates and Forecast, By Region, 2022-2035 (USD Million) (Kilo Tons)
- 8.1 Key trends
- 8.2 North America
- 8.2.1 U.S.
- 8.2.2 Canada
- 8.3 Europe
- 8.3.1 Germany
- 8.3.2 UK
- 8.3.3 France
- 8.3.4 Spain
- 8.3.5 Italy
- 8.3.6 Rest of Europe
- 8.4 Asia Pacific
- 8.4.1 China
- 8.4.2 India
- 8.4.3 Japan
- 8.4.4 Australia
- 8.4.5 South Korea
- 8.4.6 Rest of Asia Pacific
- 8.5 Latin America
- 8.5.1 Brazil
- 8.5.2 Mexico
- 8.5.3 Argentina
- 8.5.4 Rest of Latin America
- 8.6 Middle East and Africa
- 8.6.1 Saudi Arabia
- 8.6.2 South Africa
- 8.6.3 UAE
- 8.6.4 Rest of Middle East and Africa
Chapter 9 Company Profiles
- 9.1 Arla Foods
- 9.2 Chobani LLC
- 9.3 Danone S.A.
- 9.4 Fonterra Co-operative Group
- 9.5 Lifeway Foods Inc.
- 9.6 Meiji Holdings Co., Ltd.
- 9.7 Morinaga Milk Industry
- 9.8 Muller Group (UK)
- 9.9 Nestle S.A.
- 9.10 Nippon Luna Co., Ltd.
- 9.11 Yakult Honsha Co., Ltd.
- 9.12 Yotsuba Milk Products

