
PUBLISHER: Global Market Insights Inc. | PRODUCT CODE: 2027588

PUBLISHER: Global Market Insights Inc. | PRODUCT CODE: 2027588
Sodium Dichromate Market Opportunity, Growth Drivers, Industry Trend Analysis, and Forecast 2026 - 2035
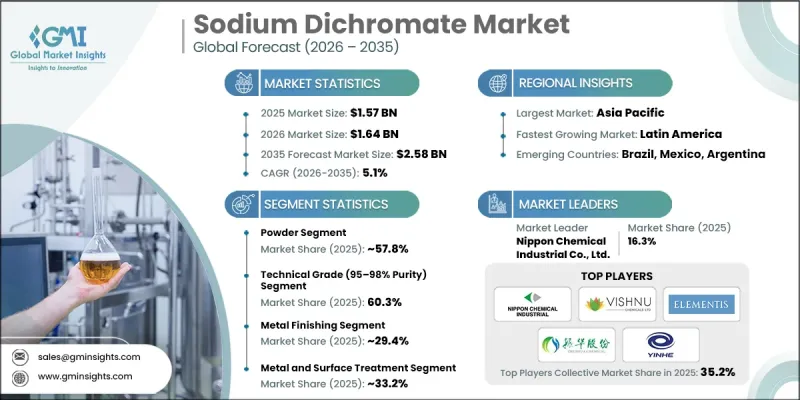
The Global Sodium Dichromate Market was valued at USD 1.57 billion in 2025 and is estimated to grow at a CAGR of 5.1% to reach USD 2.58 billion by 2035.
The global sodium dichromate industry is expanding steadily as industrial sectors continue to rely on this compound for a wide range of manufacturing processes. Demand is being driven by its role as a strong oxidizing agent and its effectiveness in protecting materials from degradation. Industries are increasingly prioritizing product durability and performance, which is strengthening the need for high-quality chemical inputs. Sodium dichromate plays a critical role in enabling the production of various industrial materials while also supporting longer product lifecycles. At the same time, evolving environmental considerations are influencing market dynamics, as regulatory frameworks encourage safer handling practices and the adoption of more sustainable alternatives where possible. Despite this shift, the compound remains essential in several regulated applications due to its functional reliability. Its versatility across multiple industrial processes continues to support consistent demand, while ongoing industrialization in emerging regions further contributes to overall market expansion.
| Market Scope | |
|---|---|
| Start Year | 2025 |
| Forecast Year | 2026-2035 |
| Start Value | $1.57 Billion |
| Forecast Value | $2.58 Billion |
| CAGR | 5.1% |
The powder segment accounted for 57.8% share in 2025 and is expected to grow at a CAGR of 4.8% through 2035. This form remains widely preferred due to its ease of handling, efficient solubility, and adaptability across different industrial processes. Its practicality in manufacturing environments has contributed to its strong adoption across various end-use applications.
Technical grade sodium dichromate, with a purity range of 95-98%, held a share of 60.3% in 2025 and is anticipated to grow at a CAGR of 5.2% during 2026-2035. This segment continues to lead due to its cost-effectiveness and suitability for large-scale industrial operations. The increasing pace of industrial development in emerging economies is further supporting demand for this grade, as it meets performance requirements across diverse applications.
North America Sodium Dichromate Market accounted for 25.2% share in 2025, reflecting a well-established and regulated industry environment. Strong compliance standards and safety regulations influence production and application practices across the region. Industrial demand remains stable, supported by advanced manufacturing capabilities and ongoing modernization efforts. While regulatory pressures may limit certain uses, they are also encouraging the development of safer and more sustainable solutions, ensuring continued market relevance.
Key companies operating in the Sodium Dichromate Market include Vishnu Chemicals Limited, Elementis plc (YILDIRIM Group), Nippon Chemical Industrial Co., Ltd., Soda Sanayii A.S., AD International, TNJ Chemical, NPCC, Brother Enterprises Holding Co., Ltd., Zhenhua Chemical (Hubei Zhenhua Chemical Co., Ltd.), Yinhe Group (China Yinhe Chemical Industry Group), Chongqing Changyuan Chemical (Changyuan Group), Dhairya International, and Choice Organochem LLP. Companies in the Global Sodium Dichromate Market are implementing strategic initiatives to strengthen their market position and enhance competitiveness. A major focus is placed on improving production efficiency and ensuring compliance with evolving environmental regulations. Investments in research and development are enabling companies to optimize product quality and expand application capabilities. Firms are also strengthening supply chain networks to ensure consistent availability and cost control. Geographic expansion into developing markets is a key strategy to capture rising industrial demand. Additionally, companies are forming strategic alliances and partnerships to enhance technological expertise and broaden their market reach.
Table of Contents
Chapter 1 Methodology & Scope
- 1.1 Market scope and definition
- 1.2 Research design
- 1.2.1 Research approach
- 1.2.2 Data collection methods
- 1.3 Data mining sources
- 1.3.1 Global
- 1.3.2 Regional/Country
- 1.4 Base estimates and calculations
- 1.4.1 Base year calculation
- 1.4.2 Key trends for market estimation
- 1.5 Primary research and validation
- 1.5.1 Primary sources
- 1.6 Forecast model
- 1.7 Research assumptions and limitations
Chapter 2 Executive Summary
- 2.1 Industry 360° synopsis
- 2.2 Key market trends
- 2.2.1 Regional
- 2.2.2 Form
- 2.2.3 Grade
- 2.2.4 Application
- 2.2.5 End use industry
- 2.3 TAM Analysis, 2026-2035
- 2.4 CXO perspectives: Strategic imperatives
- 2.4.1 Executive decision points
Chapter 3 Industry Insights
- 3.1 Industry ecosystem analysis
- 3.1.1 Supplier landscape
- 3.1.2 Profit margin
- 3.1.3 Value addition at each stage
- 3.1.4 Factor affecting the value chain
- 3.1.5 Disruptions
- 3.2 Industry impact forces
- 3.2.1 Growth drivers
- 3.2.2 Industry pitfalls and challenges
- 3.2.3 Market opportunities
- 3.3 Growth potential analysis
- 3.4 Regulatory landscape
- 3.4.1 North America
- 3.4.2 Europe
- 3.4.3 Asia Pacific
- 3.4.4 Latin America
- 3.4.5 Middle East & Africa
- 3.5 Porter’s analysis
- 3.6 PESTEL analysis
- 3.7 Price trends
- 3.7.1 By region
- 3.7.2 By type
- 3.8 Future market trends
- 3.9 Technology and Innovation landscape
- 3.9.1 Current technological trends
- 3.9.2 Emerging technologies
- 3.10 Patent Landscape
- 3.11 Trade statistics (HS code)
- 3.11.1 Major importing countries
- 3.11.2 Major exporting countries
- 3.12 Sustainability and environmental aspects
- 3.12.1 Sustainable practices
- 3.12.2 Waste reduction strategies
- 3.12.3 Energy efficiency in production
- 3.12.4 Eco-friendly initiatives
- 3.13 Carbon footprint consideration
Chapter 4 Competitive Landscape, 2025
- 4.1 Introduction
- 4.2 Company market share analysis
- 4.2.1 By region
- 4.2.1.1 North America
- 4.2.1.2 Europe
- 4.2.1.3 Asia Pacific
- 4.2.1.4 LATAM
- 4.2.1.5 MEA
- 4.2.1 By region
- 4.3 Company matrix analysis
- 4.4 Competitive analysis of major market players
- 4.5 Competitive positioning matrix
- 4.6 Key developments
- 4.6.1 Mergers & acquisitions
- 4.6.2 Partnerships & collaborations
- 4.6.3 New Product Launches
- 4.6.4 Expansion Plans
Chapter 5 Market Estimates and Forecast, By Form, 2022-2035 (USD Billion) (Kilo Tons)
- 5.1 Key trends
- 5.2 Powder
- 5.3 Crystal
Chapter 6 Market Estimates and Forecast, By Grade, 2022-2035 (USD Billion) (Kilo Tons)
- 6.1 Key trends
- 6.2 Technical grade (95-98% purity)
- 6.3 Reagent / ACS grade (≥99.5% purity)
- 6.4 Pharmaceutical / USP grade (≥99.9% purity)
Chapter 7 Market Estimates and Forecast, By Application, 2022-2035 (USD Billion) (Kilo Tons)
- 7.1 Key trends
- 7.2 Metal finishing
- 7.3 Pigments and coatings
- 7.4 Tanning agent
- 7.5 Wood preservative
- 7.6 Chemical intermediate
- 7.7 Others (catalysts, glass colorant, etc.)
Chapter 8 Market Estimates and Forecast, By End Use Industry, 2022-2035 (USD Billion) (Kilo Tons)
- 8.1 Key trends
- 8.2 Metal and surface treatment
- 8.3 Textiles
- 8.4 Automotive
- 8.5 Chemicals
- 8.6 Leather
- 8.7 Others (aerospace, paint & coating, etc.)
Chapter 9 Market Estimates and Forecast, By Region, 2022-2035 (USD Billion) (Kilo Tons)
- 9.1 Key trends
- 9.2 North America
- 9.2.1 U.S.
- 9.2.2 Canada
- 9.3 Europe
- 9.3.1 Germany
- 9.3.2 UK
- 9.3.3 France
- 9.3.4 Spain
- 9.3.5 Italy
- 9.3.6 Rest of Europe
- 9.4 Asia Pacific
- 9.4.1 China
- 9.4.2 India
- 9.4.3 Japan
- 9.4.4 Australia
- 9.4.5 South Korea
- 9.4.6 Rest of Asia Pacific
- 9.5 Latin America
- 9.5.1 Brazil
- 9.5.2 Mexico
- 9.5.3 Argentina
- 9.5.4 Rest of Latin America
- 9.6 Middle East and Africa
- 9.6.1 Saudi Arabia
- 9.6.2 South Africa
- 9.6.3 UAE
- 9.6.4 Rest of Middle East and Africa
Chapter 10 Company Profiles
- 10.1 AD International
- 10.2 Brother Enterprises Holding Co., Ltd.
- 10.3 Choice Organochem LLP
- 10.4 Chongqing Changyuan Chemical (Changyuan Group)
- 10.5 Dhairya International
- 10.6 Elementis plc (YILDIRIM Group)
- 10.7 Nippon Chemical Industrial Co., Ltd.
- 10.8 NPCC
- 10.9 Soda Sanayii A.S.
- 10.10 TNJ Chemical
- 10.11 Vishnu Chemicals Limited
- 10.12 Yinhe Group (China Yinhe Chemical Industry Group)
- 10.13 Zhenhua Chemical (Hubei Zhenhua Chemical Co. Ltd)

