
PUBLISHER: Global Market Insights Inc. | PRODUCT CODE: 2038479

PUBLISHER: Global Market Insights Inc. | PRODUCT CODE: 2038479
Cosmetics Active Ingredients Market Opportunity, Growth Drivers, Industry Trend Analysis, and Forecast 2026 - 2035
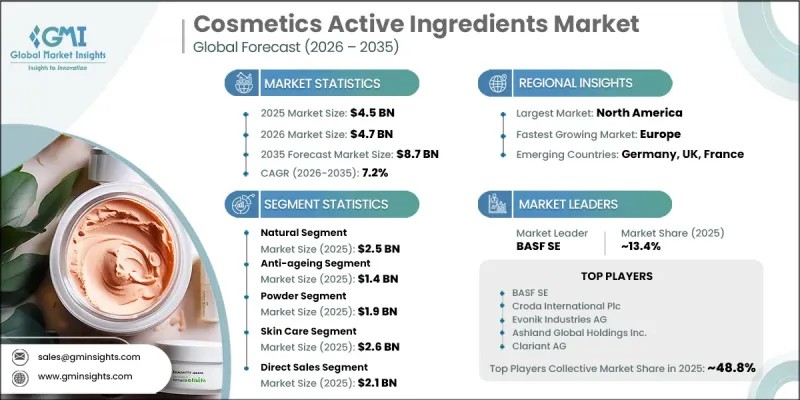
The Global Cosmetics Active Ingredients Market was valued at USD 4.5 billion in 2025 and is estimated to grow at a CAGR of 7.2% to reach USD 8.7 billion by 2035.
Market expansion is strongly supported by rising consumer inclination toward natural, clean-label, and plant-derived formulations in skincare and personal care applications. Demand for bio-based actives sourced from botanical extracts, essential oils, and fermentation-based processes continues to accelerate as consumers become more ingredient-conscious and focused on sustainability. This shift is also encouraging manufacturers to develop premium formulations and differentiated product lines, improving profitability and brand positioning. At the same time, growing demand for anti-aging and skin health solutions is significantly shaping industry growth, with peptides, retinoids, and antioxidants widely incorporated into both mass-market and premium products. Increasing global aging populations and higher consumer spending on advanced skincare solutions are further supporting steady volume and value growth. Additionally, the expanding beauty and personal care sector continues to create strong downstream demand, driven by frequent product launches, innovation pipelines, and increasing penetration in emerging economies, making cosmetic active ingredients a core component of modern formulation development.
| Market Scope | |
|---|---|
| Start Year | 2025 |
| Forecast Year | 2026-2035 |
| Start Value | $4.5 Billion |
| Forecast Value | $8.7 Billion |
| CAGR | 7.2% |
The natural ingredients category accounted for USD 2.5 billion in 2025, reflecting its strong position in the cosmetic active ingredients landscape. This segment is gaining traction as consumers increasingly prefer clean-label, plant-derived, and sustainably sourced formulations in personal care products. Natural actives are widely integrated into skincare and cosmetic formulations due to rising awareness of environmental responsibility and ingredient transparency. Despite this shift, synthetic ingredients continue to maintain relevance in the market due to their consistent performance, stability, and reliability in high-efficacy formulations. Their controlled production and proven functionality ensure their continued use in applications where precision and durability are critical, maintaining a balanced coexistence between natural and synthetic sources.
The skincare application segment captured USD 2.6 billion in 2025. Skincare remains the dominant application area due to increasing consumer focus on hydration, anti-aging solutions, sun protection, and overall skin wellness. Rising awareness of dermatological health and preventive skincare has significantly boosted demand for advanced active ingredients in this category. Continuous innovation in formulation science and growing preference for multifunctional skincare products further support segment expansion. Increasing incorporation of scientifically backed actives in daily-use skincare routines continues to strengthen the dominance of this application segment across global markets.
North America Cosmetics Active Ingredients Market accounted for USD 1.5 billion in 2025. The region's expansion is driven by high consumer spending on premium skincare products and increasing demand for clinically validated active ingredients such as peptides, retinoids, and antioxidants. The United States leads the regional market due to its advanced research and development capabilities and a well-established cosmetics industry that consistently supports product innovation. Meanwhile, Canada is experiencing steady growth driven by rising demand for clean-label, sustainable, and bio-based formulations. Growing premiumization trends and increased adoption of multifunctional skincare solutions are further strengthening market growth, particularly through online and e-commerce distribution channels.
Key companies operating in the Global Cosmetics Active Ingredients Industry include Evonik Industries AG, BASF SE, Givaudan SA, and Croda International Plc. Other major participants include Symrise AG, DSM-Firmenich, Ashland Global Holdings Inc., Lubrizol Corporation, Clariant AG, Eastman Chemical Company, Beiersdorf AG, Seppic SA, Lucas Meyer Cosmetics, Elementis Plc, and Bioweg. Companies in the Cosmetics Active Ingredients Market are focusing heavily on expanding their product portfolios through continuous innovation in natural and bio-based ingredient development. Strategic investments in research and development are being prioritized to enhance efficacy, safety, and sustainability of formulations. Many players are forming partnerships with cosmetic brands to co-develop customized solutions tailored to specific skin concerns and regional preferences. Expansion into emerging markets is also a key strategy, supported by localized production and distribution networks. Firms are increasingly leveraging biotechnology and fermentation technologies to create high-performance actives with improved environmental profiles. Digital transformation and e-commerce integration are further strengthening brand visibility and customer reach.
Table of Contents
Chapter 1 Methodology & Scope
- 1.1 Market scope and definition
- 1.2 Research design
- 1.2.1 Research approach
- 1.2.2 Data collection methods
- 1.3 Data mining sources
- 1.3.1 Global
- 1.3.2 Regional/Country
- 1.4 Base estimates and calculations
- 1.4.1 Base year calculation
- 1.4.2 Key trends for market estimation
- 1.5 Primary research and validation
- 1.5.1 Primary sources
- 1.6 Forecast model
- 1.7 Research assumptions and limitations
Chapter 2 Executive Summary
- 2.1 Industry 360° synopsis
- 2.2 Key market trends
- 2.2.1 Regional
- 2.2.2 Source
- 2.2.3 Type
- 2.2.4 Form
- 2.2.5 Application
- 2.2.6 Distribution Channel
- 2.3 TAM Analysis, 2026-2035
- 2.4 CXO perspectives: Strategic imperatives
- 2.4.1 Executive decision points
- 2.4.2 Critical success factors
- 2.5 Future Outlook and Strategic Recommendations
Chapter 3 Industry Insights
- 3.1 Industry ecosystem analysis
- 3.1.1 Supplier Landscape
- 3.1.2 Profit Margin
- 3.1.3 Value addition at each stage
- 3.1.4 Factor affecting the value chain
- 3.1.5 Disruptions
- 3.2 Industry impact forces
- 3.2.1 Growth drivers
- 3.2.1.1 Rising demand for natural ingredients
- 3.2.1.2 Increasing demand for anti-aging products
- 3.2.1.3 Expanding beauty and personal care industry
- 3.2.2 Industry pitfalls and challenges
- 3.2.2.1 High cost of premium ingredients
- 3.2.2.2 Sourcing sustainable raw materials
- 3.2.3 Market opportunities
- 3.2.3.1 Expansion of biotechnology-based and fermentation-derived actives
- 3.2.3.2 Growing demand from emerging markets and indie brands
- 3.2.1 Growth drivers
- 3.3 Growth potential analysis
- 3.4 Regulatory landscape
- 3.4.1 North America
- 3.4.2 Europe
- 3.4.3 Asia Pacific
- 3.4.4 Latin America
- 3.4.5 Middle East & Africa
- 3.5 Porter's analysis
- 3.6 PESTEL analysis
- 3.7 Price trends
- 3.7.1 By region
- 3.7.2 Product type
- 3.8 Future market trends
- 3.9 Technology and Innovation Landscape
- 3.9.1 Current technological trends
- 3.9.2 Emerging technologies
- 3.10 Patent Landscape
- 3.11 Trade statistics (HS code) (Note: the trade statistics will be provided for key countries only)
- 3.11.1 Major importing countries
- 3.11.2 Major exporting countries
- 3.12 Sustainability and environmental aspects
- 3.12.1 Sustainable practices
- 3.12.2 Waste reduction strategies
- 3.12.3 Energy efficiency in production
- 3.12.4 Eco-friendly initiatives
Chapter 4 Competitive Landscape, 2025
- 4.1 Introduction
- 4.2 Company market share analysis
- 4.2.1 By region
- 4.2.1.1 North America
- 4.2.1.2 Europe
- 4.2.1.3 Asia Pacific
- 4.2.1.4 LATAM
- 4.2.1.5 MEA
- 4.2.1 By region
- 4.3 Company matrix analysis
- 4.4 Competitive analysis of major market players
- 4.5 Competitive positioning matrix
- 4.6 Key developments
- 4.6.1 Mergers & acquisitions
- 4.6.2 Partnerships & collaborations
- 4.6.3 New product launches
- 4.6.4 Expansion plans
Chapter 5 Market Estimates and Forecast, By Source, 2022 - 2035 (USD Billion) (Tons)
- 5.1 Key trends
- 5.2 Natural
- 5.2.1 Plant-based/botanical
- 5.2.2 Animal-derived
- 5.3 Synthetic
Chapter 6 Market Estimates and Forecast, By Type, 2022 - 2035 (USD Billion) (Tons)
- 6.1 Key trends
- 6.2 Anti-aging actives
- 6.2.1 Peptides
- 6.2.2 Retinoids
- 6.2.3 Stem cell extracts
- 6.3 Moisturizers/hydrators
- 6.3.1 Hyaluronic acid & derivatives
- 6.3.2 Glycerin & humectants
- 6.3.3 Ceramides
- 6.3.4 Other hydrating actives
- 6.4 UV filters/sunscreen actives
- 6.4.1 Organic/chemical filters
- 6.4.2 Inorganic/physical filters
- 6.4.3 Hybrid formulations
- 6.5 Skin-lightening/brightening agents
- 6.5.1 Vitamin C & derivatives
- 6.5.2 Niacinamide
- 6.5.3 Arbutin & alpha-arbutin
- 6.5.4 Kojic acid & licorice extract
- 6.6 Exfoliators/keratolytics
- 6.6.1 Alpha hydroxy acids (AHAs)
- 6.6.2 Beta hydroxy acids (BHAs)
- 6.6.3 Polyhydroxy acids (PHAs)
- 6.6.4 Enzymes
- 6.7 Antimicrobial/preservatives
- 6.7.1 Parabens
- 6.7.2 Phenoxyethanol
- 6.7.3 Natural preservatives
- 6.7.4 Other antimicrobials
- 6.8 Others
- 6.8.1 Antioxidants
- 6.8.2 Anti-pollution actives
- 6.8.3 Blue light protection actives
- 6.8.4 Emollients/skin conditioning agents
- 6.8.5 Others
Chapter 7 Market Estimates and Forecast, By Form, 2022 - 2035 (USD Million) (Tons)
- 7.1 Key trends
- 7.2 Liquid
- 7.3 Powder
- 7.4 Gel
- 7.5 Others
Chapter 8 Market Estimates and Forecast, By Application, 2022 - 2035 (USD Million) (Tons)
- 8.1 Key trends
- 8.2 Skin care
- 8.2.1 Face care
- 8.2.2 Body care
- 8.2.3 Sun care
- 8.2.4 Others
- 8.3 Hair care
- 8.3.1 Shampoos
- 8.3.2 Conditioners
- 8.3.3 Hair treatments
- 8.3.4 Hair styling products
- 8.3.5 Hair colorants
- 8.3.6 Others
- 8.4 Makeup/color cosmetics
- 8.4.1 Face makeup
- 8.4.2 Eye makeup
- 8.4.3 Lip products
- 8.4.4 Others
- 8.5 Oral care
- 8.5.1 Toothpaste
- 8.5.2 Mouthwash
- 8.5.3 Teeth whitening products
- 8.5.4 Others
- 8.6 Fragrances
- 8.6.1 Perfumes
- 8.6.2 Eau de toilette
- 8.6.3 Body mists
- 8.6.4 Others
- 8.7 Others
- 8.7.1 Deodorants & antiperspirants
- 8.7.2 Shaving products
- 8.7.3 Bath products
- 8.7.4 Nail care
Chapter 9 Market Estimates and Forecast, By Distribution Channel, 2022 - 2035 (USD Million) (Tons)
- 9.1 Key trends
- 9.2 Direct sales
- 9.3 Distributors
- 9.4 Contract manufacturers
- 9.5 Online/E-commerce platforms
Chapter 10 Market Estimates and Forecast, By Region, 2022 - 2035 (USD Billion) (Tons)
- 10.1 Key trends
- 10.2 North America
- 10.2.1 U.S.
- 10.2.2 Canada
- 10.3 Europe
- 10.3.1 Germany
- 10.3.2 UK
- 10.3.3 France
- 10.3.4 Spain
- 10.3.5 Italy
- 10.3.6 Rest of Europe
- 10.4 Asia Pacific
- 10.4.1 China
- 10.4.2 India
- 10.4.3 Japan
- 10.4.4 Australia
- 10.4.5 South Korea
- 10.4.6 Rest of Asia Pacific
- 10.5 Latin America
- 10.5.1 Brazil
- 10.5.2 Mexico
- 10.5.3 Rest of Latin America
- 10.6 Middle East and Africa
- 10.6.1 Saudi Arabia
- 10.6.2 South Africa
- 10.6.3 UAE
- 10.6.4 Rest of Middle East and Africa
Chapter 11 Company Profiles
- 11.1 BASF SE
- 11.2 Ashland Global Holdings Inc.
- 11.3 Beiersdorf AG
- 11.4 Bioweg
- 11.5 Clariant AG
- 11.6 Croda International Plc
- 11.7 DSM-Firmenich
- 11.8 Eastman Chemical Company
- 11.9 Elementis Plc
- 11.10 Evonik Industries AG
- 11.11 Givaudan SA
- 11.12 Lubrizol Corporation
- 11.13 Lucas Meyer Cosmetics
- 11.14 Seppic SA
- 11.15 Symrise AG

