
PUBLISHER: Global Market Insights Inc. | PRODUCT CODE: 2038642

PUBLISHER: Global Market Insights Inc. | PRODUCT CODE: 2038642
Pea Protein Market Opportunity, Growth Drivers, Industry Trend Analysis, and Forecast 2026 - 2035
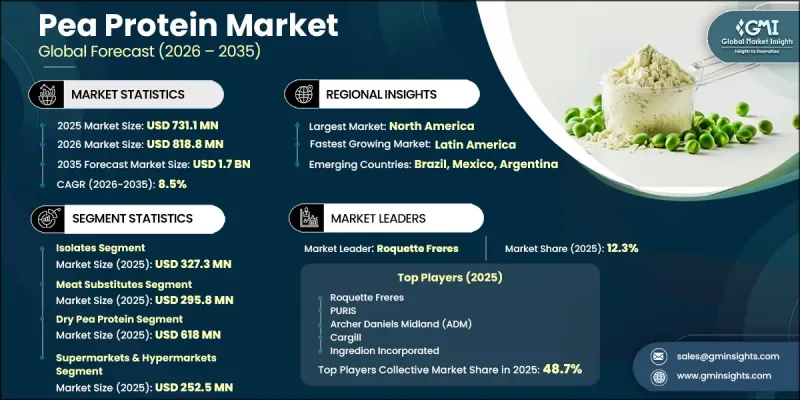
The Global Pea Protein Market was valued at USD 731.1 million in 2025 and is estimated to grow at a CAGR of 8.5% to reach USD 1.7 billion by 2035.
The market is gaining strong momentum as consumers increasingly shift toward plant-based nutrition and sustainable food ingredients. Pea protein, extracted from yellow peas through advanced processing techniques, delivers a well-balanced amino acid profile with high digestibility, making it suitable for diverse dietary preferences. The production process preserves nutritional integrity while enabling manufacturers to develop ingredients in multiple formats, including isolates, concentrates, and textured variants. Its neutral flavor and functional versatility make it highly adaptable across a wide range of food and beverage formulations. Growing awareness of clean-label products and environmentally responsible sourcing continues to accelerate adoption across industries. Food manufacturers are incorporating pea protein into various formulations to enhance texture, stability, and nutritional content while meeting evolving consumer expectations. Additionally, increasing demand for allergen-friendly ingredients is supporting widespread acceptance, as pea protein remains free from common allergens. Continuous product innovation and development of minimally processed protein solutions are further shaping the competitive landscape and driving sustained market growth.
| Market Scope | |
|---|---|
| Start Year | 2025 |
| Forecast Year | 2026-2035 |
| Start Value | $731.1 Million |
| Forecast Value | $1.7 Billion |
| CAGR | 8.5% |
The isolates segment accounted for USD 327.3 million in 2025, reflecting its leading position within the market. Strong demand for high-protein, plant-based ingredients with improved solubility and functional performance is contributing to segment expansion. Ongoing improvements in formulation quality, including enhanced taste and dispersibility, are supporting broader usage across multiple product applications.
The meat substitutes segment generated USD 295.8 million in 2025, highlighting its strong role in driving overall market demand. Pea protein is increasingly used in alternative protein formulations due to its ability to deliver desirable structure and consistency. Rising consumer interest in digestible, clean protein sources is also supporting growth across functional nutrition categories.
North America Pea Protein Market is expected to grow from USD 232.4 million in 2025 to USD 531.6 million by 2035. The region is witnessing increasing demand for plant-based ingredients as consumers become more conscious of dietary choices and product transparency. Food manufacturers are actively expanding product portfolios to align with clean-label trends and evolving consumption patterns.
Key companies operating in the Global Pea Protein Industry include Cargill, Axiom Foods, Kerry Group, Roquette Freres, Ingredion Incorporated, The Scoular Company, Burcon Nutrascience Corporation, A&B Ingredients, Emsland Group, Glanbia Plc, AGT Food and Ingredients, Archer Daniels Midland (ADM), Farbest Tallman Foods Corporation, Sotexpro, and PURIS. Companies in the Pea Protein Market are strengthening their market position through innovation, strategic partnerships, and global expansion initiatives. Many players are investing in advanced processing technologies to improve protein quality, functionality, and taste while reducing production costs. Collaborations with food and beverage manufacturers are enabling customized ingredient solutions tailored to specific applications. Firms are also focusing on expanding production capacity to meet rising global demand and ensure supply chain efficiency. Product diversification, including the development of clean-label and minimally processed offerings, is becoming a key competitive strategy. Additionally, companies are targeting emerging markets and enhancing distribution networks to increase their global footprint and capture new growth opportunities.
Table of Contents
Chapter 1 Methodology & Scope
- 1.1 Market scope and definition
- 1.2 Research design
- 1.2.1 Research approach
- 1.2.2 Data collection methods
- 1.3 Data mining sources
- 1.3.1 Global
- 1.3.2 Regional/Country
- 1.4 Base estimates and calculations
- 1.4.1 Base year calculation
- 1.4.2 Key trends for market estimation
- 1.5 Primary research and validation
- 1.5.1 Primary sources
- 1.6 Forecast model
- 1.7 Research assumptions and limitations
Chapter 2 Executive Summary
- 2.1 Industry 360° synopsis
- 2.2 Key market trends
- 2.2.1 Product
- 2.2.2 Application
- 2.2.3 Form
- 2.2.4 Distribution Channel
- 2.2.5 Regional
- 2.3 TAM Analysis, 2026-2035
- 2.4 CXO perspectives: Strategic imperatives
- 2.5 Future outlook and strategic recommendations
Chapter 3 Industry Insights
- 3.1 Industry ecosystem analysis
- 3.1.1 Supplier landscape
- 3.1.2 Profit margin
- 3.1.3 Value addition at each stage
- 3.1.4 Factor affecting the value chain
- 3.1.5 Disruptions
- 3.2 Industry impact forces
- 3.2.1 Growth drivers
- 3.2.1.1 Rising health consciousness & demand for dietary fiber
- 3.2.1.2 Growing prevalence of digestive & cardiovascular disorders
- 3.2.1.3 Increasing adoption in functional food & beverage application
- 3.2.2 Pitfalls/challenge
- 3.2.2.1 High price volatility due to agricultural & climatic dependence
- 3.2.2.2 Allergic reactions & occupational health concerns
- 3.2.3 Opportunities
- 3.2.3.1 Emerging applications in cosmetic & personal care industry
- 3.2.3.2 Growing demand for organic & certified psyllium products
- 3.2.1 Growth drivers
- 3.3 Growth potential analysis
- 3.4 Regulatory landscape
- 3.4.1 North America
- 3.4.2 Europe
- 3.4.3 Asia Pacific
- 3.4.4 Latin America
- 3.4.5 Middle East & Africa
- 3.5 Porter's analysis
- 3.6 PESTEL analysis
- 3.7 Technology and innovation landscape
- 3.7.1 Current technological trends
- 3.7.2 Emerging technologies
- 3.8 Price trends
- 3.8.1 By region
- 3.8.2 By product
- 3.9 Future market trends
- 3.10 Technology and innovation landscape
- 3.10.1 Current technological trends
- 3.10.2 Emerging technologies
- 3.11 Patent landscape
- 3.12 Trade statistics (HS code)
- 3.12.1 Major importing countries
- 3.12.2 Major exporting countries
- 3.13 Sustainability and environmental aspects
- 3.13.1 Sustainable practices
- 3.13.2 Waste reduction strategies
- 3.13.3 Energy efficiency in production
- 3.13.4 Eco-friendly initiatives
- 3.14 Carbon footprint consideration
Chapter 4 Competitive Landscape, 2025
- 4.1 Introduction
- 4.2 Company market share analysis
- 4.2.1 By region
- 4.2.1.1 North America
- 4.2.1.2 Europe
- 4.2.1.3 Asia Pacific
- 4.2.1.4 LATAM
- 4.2.1.5 MEA
- 4.2.1 By region
- 4.3 Company matrix analysis
- 4.4 Competitive analysis of major market players
- 4.5 Competitive positioning matrix
- 4.6 Key developments
- 4.6.1 Mergers & acquisitions
- 4.6.2 Partnerships & collaborations
- 4.6.3 New product launches
- 4.6.4 Expansion plans
Chapter 5 Market Estimates and Forecast, By Product, 2022-2035 (USD Million) (Kilo Tons)
- 5.1 Key trends
- 5.2 Isolates
- 5.3 Concentrates
- 5.4 Textured
Chapter 6 Market Estimates and Forecast, By Application, 2022-2035 (USD Million) (Kilo Tons)
- 6.1 Key trends
- 6.2 Meat substitutes
- 6.3 Nutraceuticals
- 6.4 Sport supplements
- 6.5 Others
Chapter 7 Market Estimates and Forecast, By Form, 2022-2035 (USD Million) (Kilo Tons)
- 7.1 Key trends
- 7.2 Dry pea protein
- 7.3 Liquid pea protein
Chapter 8 Market Estimates and Forecast, By Distribution Channel, 2022-2035 (USD Million) (Kilo Tons)
- 8.1 Key trends
- 8.2 Supermarkets & hypermarkets
- 8.3 Online/E-commerce
- 8.4 Pharmacies & drugstores
- 8.5 Others
Chapter 9 Market Estimates and Forecast, By Region, 2022-2035 (USD Million) (Kilo Tons)
- 9.1 Key trends
- 9.2 North America
- 9.2.1 U.S.
- 9.2.2 Canada
- 9.3 Europe
- 9.3.1 Germany
- 9.3.2 UK
- 9.3.3 France
- 9.3.4 Spain
- 9.3.5 Italy
- 9.3.6 Rest of Europe
- 9.4 Asia Pacific
- 9.4.1 China
- 9.4.2 India
- 9.4.3 Japan
- 9.4.4 Australia
- 9.4.5 South Korea
- 9.4.6 Rest of Asia Pacific
- 9.5 Latin America
- 9.5.1 Brazil
- 9.5.2 Mexico
- 9.5.3 Argentina
- 9.5.4 Rest of Latin America
- 9.6 Middle East and Africa
- 9.6.1 Saudi Arabia
- 9.6.2 South Africa
- 9.6.3 UAE
- 9.6.4 Rest of Middle East and Africa
Chapter 10 Company Profiles
- 10.1 A&B Ingredients
- 10.2 Burcon Nutrascience Corporation
- 10.3 Roquette Freres
- 10.4 Farbest Tallman Foods Corporation
- 10.5 Kerry Group
- 10.6 The Scoular Company
- 10.7 Sotexpro
- 10.8 Archer Daniels Midland (ADM)
- 10.9 Cargill
- 10.10 Glanbia Plc
- 10.11 Ingredion Incorporated
- 10.12 AGT Food and Ingredients
- 10.13 Axiom Foods
- 10.14 PURIS
- 10.15 Emsland Group

