
PUBLISHER: Global Market Insights Inc. | PRODUCT CODE: 2038686

PUBLISHER: Global Market Insights Inc. | PRODUCT CODE: 2038686
Tantalum Pentoxide Market Opportunity, Growth Drivers, Industry Trend Analysis, and Forecast 2026 - 2035
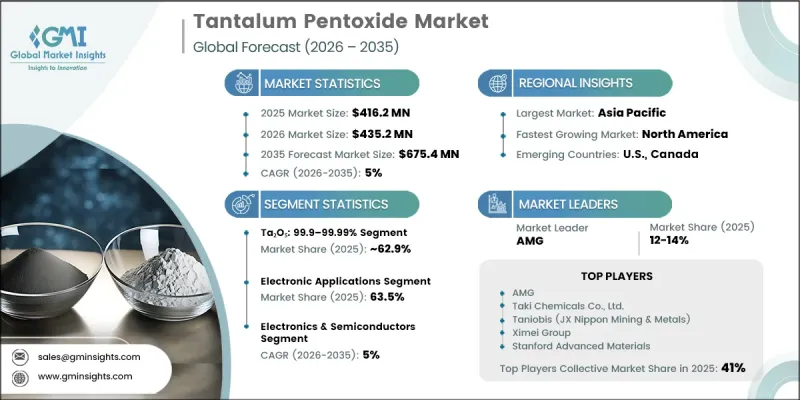
The Global Tantalum Pentoxide Market was valued at USD 416.2 million in 2025 and is estimated to grow at a CAGR of 5% to reach USD 675.4 million by 2035.
Growth is supported by the ongoing expansion of the global electronics sector, particularly in emerging economies where device manufacturing is accelerating. Tantalum pentoxide is widely used in optoelectronics, semiconductor devices, and chemical processing applications due to its strong dielectric properties and high material stability. Increasing demand for miniaturized, energy-efficient electronic devices is further strengthening market adoption, as the material supports enhanced performance in compact components. The growing renewable energy sector is also contributing to demand, driven by increased use of energy storage systems linked to solar and wind installations. However, the market faces challenges from supply chain instability, largely due to reliance on raw material sourcing from geopolitically sensitive regions. Price volatility, regulatory pressures, and mining constraints further influence market dynamics. To address these risks, industry participants are increasingly focusing on responsible sourcing strategies and diversified supply networks.
| Market Scope | |
|---|---|
| Start Year | 2025 |
| Forecast Year | 2026-2035 |
| Start Value | $ 416.2 Million |
| Forecast Value | $ 675.4 Million |
| CAGR | 5% |
The tantalum pentoxide market is also evolving due to technological advancements in electronics and materials engineering. Increasing integration of high-performance materials in next-generation devices is driving continuous innovation in production processes. Manufacturers are focusing on improving material purity, consistency, and scalability to meet the requirements of advanced electronic applications. Expanding use in high-density circuits and miniaturized components is further supporting market growth. Continuous improvements in fabrication technologies are enhancing material efficiency and enabling broader industrial applications across multiple sectors.
The Ta2O5 99.9-99.99% grade segment accounted for 62.9% share in 2025. This segment is projected to grow at a CAGR of 5.2% through 2035 due to its widespread use in electronic ceramics, capacitors, optical coatings, lithium tantalate crystals, and advanced dielectric applications. It remains the preferred grade for large-scale electronics and photonics manufacturing because of its high reliability, stability, and performance consistency. Its ability to support high-precision applications makes it essential for modern electronic component production.
The electronic applications segment held a 63.5% share in 2025 and is expected to grow at a CAGR of 5.2% between 2026 and 2035. This segment leads due to its extensive use as a high dielectric material in capacitors, integrated circuits, and advanced ceramic components. Its stable electrical properties make it highly suitable for compact and high-performance electronic systems. Increasing demand for consumer electronics, automotive electronics, and industrial devices is further driving adoption. Growing miniaturization trends in electronics continue to reinforce its importance across global manufacturing ecosystems.
North America Tantalum Pentoxide Market captured 26.7% share in 2025 and continues to expand steadily. The region's growth is supported by advanced manufacturing infrastructure and strong technological capabilities in electronics and semiconductor development. High demand for high-purity materials used in capacitors, thin films, and advanced ceramics is further strengthening regional market growth. Continuous investment in research and development activities is also contributing to innovation in material applications and production processes.
Key companies operating in the Global Tantalum Pentoxide Market include AMG, Taki Chemicals Co., Ltd., Taniobis (JX Nippon Mining & Metals), Ximei Group, Stanford Advanced Materials, American Elements, Inframat Corporation, Admat Inc, Loba Chemie, F&X Electro-Materials, Nanoshel, Otto Chemie Pvt. Ltd., Edgetech Industries LLC, Lorad Chemical Corporation, and Shanghai Greenearth Chemicals Co., Ltd. Companies in the tantalum pentoxide market are focusing on supply chain diversification, material purity enhancement, and strategic partnerships to strengthen their market position. They are investing in advanced refining and processing technologies to improve product consistency and meet stringent industry standards. Many players are expanding their sourcing networks to reduce dependency on high-risk regions and ensure stable raw material availability. Strategic collaborations with electronics and semiconductor manufacturers are helping companies secure long-term supply agreements.
Table of Contents
Chapter 1 Methodology & Scope
- 1.1 Market scope and definition
- 1.2 Research design
- 1.2.1 Research approach
- 1.2.2 Data collection methods
- 1.3 Data mining sources
- 1.3.1 Global
- 1.3.2 Regional/Country
- 1.4 Base estimates and calculations
- 1.4.1 Base year calculation
- 1.4.2 Key trends for market estimation
- 1.5 Primary research and validation
- 1.5.1 Primary sources
- 1.6 Forecast model
- 1.7 Research assumptions and limitations
Chapter 2 Executive Summary
- 2.1 Industry 360° synopsis
- 2.2 Key market trends
- 2.2.1 Regional
- 2.2.2 Product
- 2.2.3 Application
- 2.2.4 End-User
- 2.3 TAM Analysis, 2026-2035
- 2.4 CXO perspectives: Strategic imperatives
- 2.4.1 Executive decision points
- 2.4.2 Critical success factors
- 2.5 Future Outlook and Strategic Recommendations
Chapter 3 Industry Insights
- 3.1 Industry ecosystem analysis
- 3.1.1 Supplier landscape
- 3.1.2 Profit margin
- 3.1.3 Value addition at each stage
- 3.1.4 Factor affecting the value chain
- 3.1.5 Disruptions
- 3.2 Industry impact forces
- 3.2.1 Growth drivers
- 3.2.1.1 Increasing demand in electronics industry
- 3.2.1.2 Expanding applications in energy storage
- 3.2.1.3 Emerging technologies and industries
- 3.2.2 Industry pitfalls and challenges
- 3.2.2.1 Supply chain vulnerability
- 3.2.2.2 Limited new large-scale mining projects
- 3.2.3 Market opportunities
- 3.2.3.1 Advanced electronics miniaturization trends
- 3.2.3.2 Green energy & industrial electrification growth
- 3.2.1 Growth drivers
- 3.3 Growth potential analysis
- 3.4 Regulatory landscape
- 3.4.1 North America
- 3.4.2 Europe
- 3.4.3 Asia Pacific
- 3.4.4 Latin America
- 3.4.5 Middle East & Africa
- 3.5 Porter's analysis
- 3.6 PESTEL analysis
- 3.7 Price trends
- 3.7.1 By region
- 3.7.2 By product
- 3.8 Future market trends
- 3.9 Technology and Innovation landscape
- 3.9.1 Current technological trends
- 3.9.2 Emerging technologies
- 3.10 Patent Landscape
- 3.11 Trade statistics (HS code)
- 3.11.1 Major importing countries
- 3.11.2 Major exporting countries
- 3.12 Sustainability and environmental aspects
- 3.12.1 Sustainable practices
- 3.12.2 Waste reduction strategies
- 3.12.3 Energy efficiency in production
- 3.12.4 Eco-friendly initiatives
- 3.13 Carbon footprint consideration
Chapter 4 Competitive Landscape, 2025
- 4.1 Introduction
- 4.2 Company market share analysis
- 4.2.1 By region
- 4.2.1.1 North America
- 4.2.1.2 Europe
- 4.2.1.3 Asia Pacific
- 4.2.1.4 LATAM
- 4.2.1.5 MEA
- 4.2.1 By region
- 4.3 Company matrix analysis
- 4.4 Competitive analysis of major market players
- 4.5 Competitive positioning matrix
- 4.6 Key developments
- 4.6.1 Mergers & acquisitions
- 4.6.2 Partnerships & collaborations
- 4.6.3 New Product Launches
- 4.6.4 Expansion Plans
Chapter 5 Market Estimates and Forecast, By Product, 2022-2035 (USD Million) (Kilo Tons)
- 5.1 Key trends
- 5.2 Ta2O5 < 99.9%
- 5.3 Ta2O5: 99.9-99.99%
- 5.4 Ta2O5 > 99.99%
Chapter 6 Market Estimates and Forecast, By Application, 2022-2035 (USD Million) (Kilo Tons)
- 6.1 Key trends
- 6.2 Electronic applications
- 6.3 Lithium tantalate single crystals
- 6.4 Sputtering targets
- 6.5 Others
Chapter 7 Market Estimates and Forecast, By End-User, 2022-2035 (USD Million) (Kilo Tons)
- 7.1 Key trends
- 7.2 Electronics & Semiconductors
- 7.3 Automotive
- 7.4 Telecommunications
- 7.5 Optical & Photonics
- 7.6 Aerospace & Defense
- 7.7 Medical & Healthcare
- 7.8 Energy & Utilities
- 7.9 Others
Chapter 8 Market Estimates and Forecast, By Region, 2022-2035 (USD Million) (Kilo Tons)
- 8.1 Key trends
- 8.2 North America
- 8.2.1 U.S.
- 8.2.2 Canada
- 8.3 Europe
- 8.3.1 Germany
- 8.3.2 UK
- 8.3.3 France
- 8.3.4 Spain
- 8.3.5 Italy
- 8.3.6 Rest of Europe
- 8.4 Asia Pacific
- 8.4.1 China
- 8.4.2 India
- 8.4.3 Japan
- 8.4.4 Australia
- 8.4.5 South Korea
- 8.4.6 Rest of Asia Pacific
- 8.5 Latin America
- 8.5.1 Brazil
- 8.5.2 Mexico
- 8.5.3 Argentina
- 8.5.4 Rest of Latin America
- 8.6 Middle East and Africa
- 8.6.1 Saudi Arabia
- 8.6.2 South Africa
- 8.6.3 UAE
- 8.6.4 Rest of Middle East and Africa
Chapter 9 Company Profiles
- 9.1 AMG
- 9.2 Taki Chemicals Co., Ltd.
- 9.3 Taniobis (JX Nippon Mining & Metals)
- 9.4 Ximei Group
- 9.5 Stanford Advanced Materials
- 9.6 American Elements
- 9.7 Inframat Corporation
- 9.8 Admat Inc
- 9.9 Loba Chemie
- 9.10 F&X Electro-Materials
- 9.11 Nanoshel
- 9.12 Otto Chemie Pvt. Ltd.
- 9.13 Edgetech Industries LLC
- 9.14 Lorad Chemical Corporation
- 9.15 Shanghai Greenearth Chemicals Co.,Ltd

