
PUBLISHER: Global Market Insights Inc. | PRODUCT CODE: 2045674

PUBLISHER: Global Market Insights Inc. | PRODUCT CODE: 2045674
Asia-Pacific Cosmetics and Personal Care Products Market Opportunity, Growth Drivers, Industry Trend Analysis, and Forecast 2026 - 2035
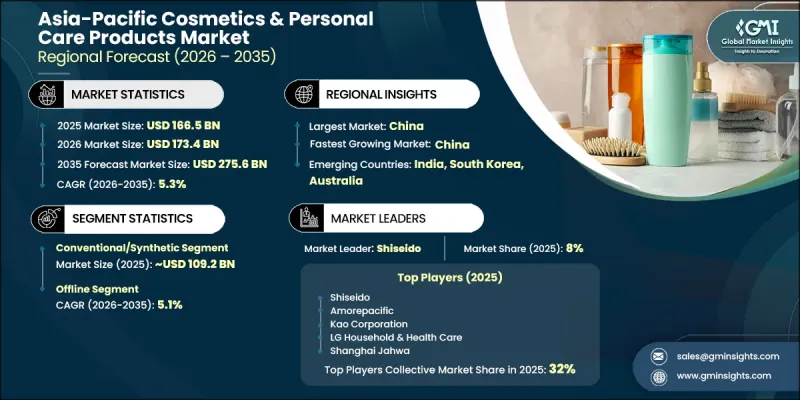
Asia-Pacific Cosmetics & Personal Care Products Market was valued at USD 166.5 billion in 2025 and is estimated to grow at a CAGR of 5.3% to reach USD 275.6 billion by 2035.
Growing interest in grooming and self-care routines is driving widespread adoption of beauty and personal care solutions across the region. Increasing disposable incomes and a steadily expanding middle-class population are encouraging demand for more sophisticated and diverse product offerings. Consumers are actively seeking solutions that enhance both appearance and overall wellness, making cosmetics and personal care items an essential part of daily routines. The retail sector is responding by broadening product portfolios to meet varying consumer expectations. At the same time, accessibility to both advanced and cost-effective formulations is improving, enabling wider adoption across income groups. Manufacturers are aligning their product strategies with changing preferences, ensuring availability of high-quality solutions that cater to different price points while maintaining performance and reliability across the Asia-Pacific market.
| Market Scope | |
|---|---|
| Start Year | 2025 |
| Forecast Year | 2026-2035 |
| Start Value | $166.5 Billion |
| Forecast Value | $275.6 Billion |
| CAGR | 5.3% |
Cosmetics and personal care products are becoming increasingly important for maintaining hygiene, appearance, and overall well-being. The availability of technologically advanced formulations alongside affordable alternatives allows consumers to choose products that align with their individual needs. Retailers continue to expand their offerings to ensure consistent access to reliable and effective solutions. The wide variety of available products enables consumers to make informed decisions based on quality expectations and spending capacity, further supporting steady market growth.
The conventional/synthetic segment generated USD 109.2 billion in 2025 and is expected to grow at a CAGR of 5.5% from 2026 to 2035. This segment holds a significant share of the market due to its adaptability across multiple applications and its ability to deliver consistent results. Products formulated with synthetic ingredients provide stable performance, cost efficiency, and scalable production advantages. Additionally, these formulations support diverse product development through multifunctional ingredients and long-lasting properties, addressing a broad spectrum of consumer requirements.
The offline distribution channel accounted for 60.1% share in 2025 and is projected to grow at a CAGR of 5.1% through 2035. Physical retail remains a dominant sales channel due to consumer preference for direct product interaction and immediate purchase availability. In-store experiences continue to play a key role in influencing buying decisions, as they allow consumers to evaluate products firsthand. Retail environments are structured to provide comprehensive product visibility, enabling brands to effectively showcase their offerings and engage with a wide customer base.
China Cosmetics & Personal Care Products Market reached USD 43.7 billion in 2025 and is expected to grow at a CAGR of 6% between 2026 and 2035. Market growth is supported by a large and evolving consumer base, increasing digital engagement, and a rising focus on personal grooming. Domestic manufacturing capabilities enable strong supply across both local and international markets. Higher disposable incomes and shifting consumer preferences are encouraging the adoption of premium products. The expansion of digital retail infrastructure is further strengthening market accessibility and supporting sustained investment in online distribution channels.
Key companies operating in the Asia-Pacific Cosmetics & Personal Care Products Industry include Amorepacific, Dabur India, Kao Corporation, Kose Corporation, LG Household & Health Care, Mandom Corporation, Mustika Ratu, Pola Orbis Holdings, Proya Cosmetics, Rohto Pharmaceutical, Shanghai Jahwa, Shiseido, Viva Cosmetics, and Yatsen Holdings. Companies in the Asia-Pacific cosmetics & personal care products market are reinforcing their market position through continuous product innovation, portfolio diversification, and regional expansion strategies. Many organizations are focusing on developing formulations that combine performance with affordability to address diverse consumer segments. Investment in research and development is enabling the introduction of advanced ingredients and improved product efficacy. Businesses are also strengthening their distribution networks to enhance accessibility across both urban and emerging markets. Strategic collaborations and localized production approaches are helping reduce operational costs and improve responsiveness to regional demand.
Table of Contents
Chapter 1 Methodology and Scope
- 1.1 Market scope and definition
- 1.2 Research design
- 1.2.1 Research approach
- 1.2.2 Data collection methods
- 1.3 Data mining sources
- 1.3.1 Country
- 1.4 Base estimates and calculations
- 1.4.1 Base year calculation
- 1.4.2 Key trends for market estimation
- 1.5 Primary research and validation
- 1.5.1 Primary sources
- 1.6 Forecast model
- 1.7 Research assumptions and limitations
Chapter 2 Executive Summary
- 2.1 Industry 360° synopsis
- 2.2 Key market trends
- 2.2.1 Product
- 2.2.2 Ingredient Type
- 2.2.3 Consumer group
- 2.2.4 Price
- 2.2.5 Distribution Channel
Chapter 3 Industry Insights
- 3.1 Industry ecosystem analysis
- 3.1.1 Supplier landscape
- 3.1.2 Profit margin
- 3.1.3 Value addition at each stage
- 3.1.4 Factor affecting the value chain
- 3.2 Industry impact forces
- 3.2.1 Growth drivers
- 3.2.2 Industry pitfalls & challenges
- 3.2.3 Opportunities
- 3.3 Growth potential analysis
- 3.4 Future market trends
- 3.5 Technology and innovation landscape
- 3.5.1 Current technological trends
- 3.5.2 Emerging technologies
- 3.6 Pricing Analysis (Driven by Primary Research)
- 3.6.1 Historical Price Trend Analysis (2020-2025) (Driven by Primary Research)
- 3.6.2 Pricing Strategy by Player Type (Premium/Value/Cost-Plus) (Driven by Primary Research)
- 3.7 Regulatory landscape
- 3.7.1 Standards and compliance requirements
- 3.7.2 Regional regulatory frameworks
- 3.7.3 Certification standards
- 3.8 Porter's analysis
- 3.9 PESTEL analysis
- 3.10 Trade Data Analysis (HS Code: 8421 (machinery/apparatus) and 3824 (chemical products)(Driven by paid data sources))
- 3.10.1 Import/Export Volume & Value Trends (2020-2025) (Driven by Primary Research)
- 3.10.2 Key Trade Corridors & Tariff Impact (Driven by Primary Research)
- 3.11 Impact of AI & Generative AI on the Market
- 3.11.1 AI-Driven disruption of existing business models
- 3.11.2 GenAI use cases & adoption roadmap by segment
- 3.11.3 Risks, limitations & regulatory considerations
- 3.12 Consumer behaviour analysis
- 3.12.1 Purchasing patterns
- 3.12.2 Preference analysis
- 3.12.3 Regional variations in consumer behaviour
- 3.12.4 Impact of e-commerce on buying decisions
Chapter 4 Competitive Landscape, 2025
- 4.1 Introduction
- 4.2 Company market share analysis
- 4.2.1 By Country
- 4.2.1.1 China
- 4.2.1.2 Japan
- 4.2.1.3 India
- 4.2.1.4 Australia
- 4.2.1.5 South Korea
- 4.2.1 By Country
- 4.3 Company matrix analysis
- 4.4 Competitive analysis of major market players
- 4.5 Competitive positioning matrix
- 4.6 Key developments
- 4.6.1 Mergers & acquisitions
- 4.6.2 Partnerships & collaborations
- 4.6.3 New product launches
- 4.6.4 Expansion plans
Chapter 5 Market Estimates and Forecast, By Product, 2022 - 2035 (USD Billion) (Million Units)
- 5.1 Key trends
- 5.2 Personal care
- 5.2.1 Skincare
- 5.2.2 Body Care
- 5.2.3 Sun Care
- 5.2.4 Haircare
- 5.2.5 Bath & Shower
- 5.2.6 Oral Care
- 5.2.7 Men's Grooming
- 5.2.8 Fragrances & Perfumes
- 5.2.9 Feminine Hygiene
- 5.3 Makeup & Color Cosmetics
- 5.3.1 Facial Cosmetics
- 5.3.2 Eye Cosmetics
- 5.3.3 Lip Cosmetics
- 5.3.4 Nail Cosmetics
- 5.4 Services
- 5.4.1 Spa & Wellness Services
- 5.4.2 Hair Salons
- 5.4.3 Nail Salons
- 5.4.4 Beauty Clinics & Aesthetic Treatments
- 5.4.5 Makeup Services
Chapter 6 Market Estimates and Forecast, By Ingredient Type, 2022 - 2035 (USD Billion) (Million Units)
- 6.1 Key trends
- 6.2 Natural & Organic
- 6.3 Conventional/Synthetic
Chapter 7 Market Estimates and Forecast, By Consumer group, 2022 - 2035 (USD Billion) (Million Units)
- 7.1 Key trends
- 7.2 Female
- 7.3 Male
- 7.4 Kids
Chapter 8 Market Estimates and Forecast, By Price, 2022 - 2035 (USD Billion) (Million Units)
- 8.1 Key trends
- 8.2 Low
- 8.3 Medium
- 8.4 High
Chapter 9 Market Estimates and Forecast, By Distribution Channel, 2022 - 2035 (USD Billion) (Million Units)
- 9.1 Key trends
- 9.2 Online
- 9.2.1 E-commerce
- 9.2.2 Company website
- 9.3 Offline
- 9.3.1 Specialty Stores
- 9.3.2 Pharmacies
- 9.3.3 Salons
- 9.4 Others (departmental stores, etc.)
Chapter 10 Market Estimates and Forecast, By Country, 2022 - 2035 (USD Billion) (Thousand Units)
- 10.1 Key trends
- 10.2 China
- 10.3 Japan
- 10.4 India
- 10.5 Australia
- 10.6 South Korea
Chapter 11 Company Profiles
- 11.1 Top Global Players
- 11.1.1 Shiseido
- 11.1.2 Kao Corporation
- 11.1.3 Kose Corporation
- 11.1.4 Pola Orbis Holdings
- 11.1.5 Rohto Pharmaceutical
- 11.1.6 Mandom Corporation
- 11.2 Top Global Players
- 11.2.1 Amorepacific
- 11.2.2 LG Household & Health Care
- 11.2.3 Shanghai Jahwa
- 11.2.4 Proya Cosmetics
- 11.2.5 Yatsen Holdings
- 11.3 Top Global Players
- 11.3.1 Dabur India
- 11.3.2 Mustika Ratu
- 11.3.3 Viva Cosmetics

