
PUBLISHER: Global Market Insights Inc. | PRODUCT CODE: 2045832

PUBLISHER: Global Market Insights Inc. | PRODUCT CODE: 2045832
Proppants Market Opportunity, Growth Drivers, Industry Trend Analysis, and Forecast 2026 - 2035
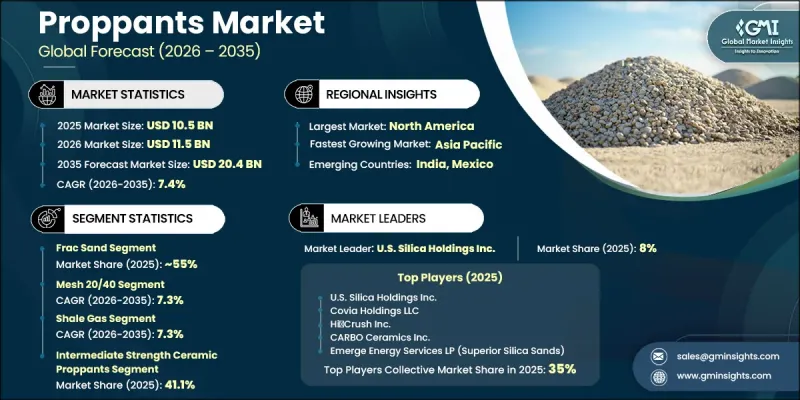
The Global Proppants Market was valued at USD 10.5 billion in 2025 and is estimated to grow at a CAGR of 7.4% to reach USD 20.4 billion by 2035.
Rising hydraulic fracturing activities worldwide, particularly across major unconventional oil and gas producing regions, continue to drive strong demand for proppants. These materials play a critical role in maintaining fracture conductivity and improving hydrocarbon recovery efficiency during extraction operations. Continuous technological advancements are further enhancing product performance through the development of stronger and higher-conductivity proppant materials capable of supporting demanding operational environments. Growing global energy consumption and increasing focus on maximizing production efficiency are also accelerating market expansion. At the same time, industry continues to face challenges associated with environmental concerns and strict regulatory oversight related to hydraulic fracturing operations. Concerns surrounding water consumption, potential groundwater contamination, and induced seismic activity have led regulatory authorities in several regions to introduce tighter operational standards and restrictions. These regulations are increasing compliance costs for market participants and limiting expansion opportunities in environmentally sensitive areas. As a result, manufacturers are placing greater emphasis on developing cleaner, more sustainable proppant solutions that align with evolving environmental standards while supporting efficient energy extraction operations.
| Market Scope | |
|---|---|
| Start Year | 2025 |
| Forecast Year | 2026-2035 |
| Start Value | $10.5 Billion |
| Forecast Value | $20.4 Billion |
| CAGR | 7.4% |
The frac sand segment accounted for a 55% share in 2025 and is expected to grow at a CAGR of 7.3% through 2035. The segment continues to maintain a dominant position due to its cost-effectiveness, widespread availability, and suitability for large-scale hydraulic fracturing operations across shale formations. Ongoing improvements in mining operations, processing technologies, and supply chain logistics have further strengthened the market position of frac sand. Its ability to support high-volume unconventional oil and gas extraction activities continues to drive strong adoption across the industry.
The mesh 20/40 category held a 38.8% share in 2025, and is forecast to grow at a CAGR of 7.3% between 2026 and 2035. This mesh size has become widely preferred across the oil and gas industry because it offers an effective balance between strength, permeability, and operational efficiency during high-volume hydraulic fracturing activities. The material continues to gain strong demand among operators seeking improved production performance and enhanced fracture conductivity under high-pressure conditions. Reliable transport characteristics and the ability to maintain fracture openings effectively further support the widespread adoption of mesh 20/40 proppants across energy extraction applications.
North America Proppants Market held a 38.7% share in 2025 and continues to emerge as one of the most significant regional markets worldwide. Market growth across the region is supported by extensive unconventional oil and gas exploration activities and strong adoption of advanced hydraulic fracturing technologies. Efficient supply chain infrastructure, continuous improvements in frac sand quality, and advancements in transportation and logistics operations are further strengthening the North America proppants industry. Ongoing investments in energy production and extraction efficiency continue to support long-term regional market growth.
Major companies operating in the Global Proppants Market include CARBO Ceramics Inc., U.S. Silica Holdings Inc., Covia Holdings LLC, Saint Gobain Proppants, Hexion Inc., Badger Mining Corporation, Hi Crush Inc., China GengSheng Minerals, Inc., ChangQing Proppant, Emerge Energy Services LP (Superior Silica Sands), Preferred Sands LLC, CoorsTek Inc., Atlas Sand Company, LLC, Fores LTD, and Xinmi Wanli Industry Development Co., Ltd. Companies operating in the proppants market are implementing several strategic initiatives to strengthen market share and improve competitive positioning across global energy industries. Leading manufacturers are investing in advanced product development focused on improving proppant strength, conductivity, and operational durability to support high-efficiency hydraulic fracturing applications. Many companies are also expanding mining and processing capacities to meet rising demand from unconventional oil and gas projects. Strategic partnerships with energy producers and logistics providers are helping businesses optimize supply chain efficiency and reduce transportation costs. In addition, market participants are focusing on environmentally sustainable solutions by developing cleaner production methods and eco-friendly proppant materials that comply with evolving environmental regulations.
Table of Contents
Chapter 1 Methodology & Scope
- 1.1 Market scope and definition
- 1.2 Research design
- 1.2.1 Research approach
- 1.2.2 Data collection methods
- 1.3 Data mining sources
- 1.3.1 Global
- 1.3.2 Regional/Country
- 1.4 Base estimates and calculations
- 1.4.1 Base year calculation
- 1.4.2 Key trends for market estimation
- 1.5 Primary research and validation
- 1.5.1 Primary sources
- 1.6 Forecast model
- 1.7 Research assumptions and limitations
Chapter 2 Executive Summary
- 2.1 Industry 360° synopsis
- 2.2 Key market trends
- 2.2.1 Regional
- 2.2.2 Type
- 2.2.3 Mesh Size
- 2.2.4 Application
- 2.2.5 Ceramic
- 2.3 TAM Analysis, 2026-2035
- 2.4 CXO perspectives: Strategic imperatives
- 2.4.1 Executive decision points
- 2.4.2 Critical success factors
- 2.5 Future Outlook and Strategic Recommendations
Chapter 3 Industry Insights
- 3.1 Industry ecosystem analysis
- 3.1.1 Supplier landscape
- 3.1.2 Profit margin
- 3.1.3 Value addition at each stage
- 3.1.4 Factor affecting the value chain
- 3.1.5 Disruptions
- 3.2 Industry impact forces
- 3.2.1 Growth drivers
- 3.2.1.1 Increased hydraulic fracturing activities
- 3.2.1.2 Technological advancements
- 3.2.1.3 Rising focus on natural gas
- 3.2.2 Industry pitfalls and challenges
- 3.2.2.1 Environmental concerns and regulatory challenges
- 3.2.2.2 Volatile oil & gas prices impacting drilling activity
- 3.2.3 Market opportunities
- 3.2.3.1 Expansion of shale gas development in emerging markets
- 3.2.3.2 Development of lightweight & ultra conductive proppants
- 3.2.1 Growth drivers
- 3.3 Growth potential analysis
- 3.4 Regulatory landscape
- 3.4.1 North America
- 3.4.2 Europe
- 3.4.3 Asia Pacific
- 3.4.4 Latin America
- 3.4.5 Middle East & Africa
- 3.5 Porter's analysis
- 3.6 PESTEL analysis
- 3.7 Price trends
- 3.7.1 By region
- 3.7.2 By type
- 3.8 Future market trends
- 3.9 Technology and Innovation landscape
- 3.9.1 Current technological trends
- 3.9.2 Emerging technologies
- 3.10 Patent Landscape
- 3.11 Trade statistics (HS code)
- 3.11.1 Major importing countries
- 3.11.2 Major exporting countries
- 3.12 Sustainability and environmental aspects
- 3.12.1 Sustainable practices
- 3.12.2 Waste reduction strategies
- 3.12.3 Energy efficiency in production
- 3.12.4 Eco-friendly initiatives
- 3.13 Carbon footprint consideration
Chapter 4 Competitive Landscape, 2025
- 4.1 Introduction
- 4.2 Company market share analysis
- 4.2.1 By region
- 4.2.1.1 North America
- 4.2.1.2 Europe
- 4.2.1.3 Asia Pacific
- 4.2.1.4 LATAM
- 4.2.1.5 MEA
- 4.2.1 By region
- 4.3 Company matrix analysis
- 4.4 Competitive analysis of major market players
- 4.5 Competitive positioning matrix
- 4.6 Key developments
- 4.6.1 Mergers & acquisitions
- 4.6.2 Partnerships & collaborations
- 4.6.3 New Product Launches
- 4.6.4 Expansion Plans
Chapter 5 Market Estimates and Forecast, By Type, 2022-2035 (USD Billion) (Kilo Tons)
- 5.1 Key trends
- 5.2 Frac Sand
- 5.3 Resin-Coated Proppants
- 5.4 Ceramic Proppants
Chapter 6 Market Estimates and Forecast, By Mesh Size, 2022-2035 (USD Billion) (Kilo Tons)
- 6.1 Key trends
- 6.2 Mesh 20/40
- 6.3 Mesh 30/50
- 6.4 Mesh 40/70
- 6.5 Others (Fine Mesh, Coarse Mesh)
Chapter 7 Market Estimates and Forecast, By Application, 2022-2035 (USD Billion) (Kilo Tons)
- 7.1 Key trends
- 7.2 Shale Gas
- 7.3 Tight Gas
- 7.4 Coalbed Methane
- 7.5 Others (including tight oil, deep gas etc)
Chapter 8 Market Estimates and Forecast, By Ceramic, 2022-2035 (USD Billion) (Kilo Tons)
- 8.1 Key trends
- 8.2 High Strength Ceramic Proppants
- 8.3 Intermediate Strength Ceramic Proppants
- 8.4 Light Weight Ceramic Proppants
- 8.5 Others
Chapter 9 Market Estimates and Forecast, By Region, 2022-2035 (USD Billion) (Kilo Tons)
- 9.1 Key trends
- 9.2 North America
- 9.2.1 U.S.
- 9.2.2 Canada
- 9.3 Europe
- 9.3.1 Germany
- 9.3.2 UK
- 9.3.3 France
- 9.3.4 Spain
- 9.3.5 Italy
- 9.3.6 Rest of Europe
- 9.4 Asia Pacific
- 9.4.1 China
- 9.4.2 India
- 9.4.3 Japan
- 9.4.4 Australia
- 9.4.5 South Korea
- 9.4.6 Rest of Asia Pacific
- 9.5 Latin America
- 9.5.1 Brazil
- 9.5.2 Mexico
- 9.5.3 Argentina
- 9.5.4 Rest of Latin America
- 9.6 Middle East and Africa
- 9.6.1 Saudi Arabia
- 9.6.2 South Africa
- 9.6.3 UAE
- 9.6.4 Rest of Middle East and Africa
Chapter 10 Company Profiles
- 10.1 CARBO Ceramics Inc.
- 10.2 U.S. Silica Holdings Inc.
- 10.3 Covia Holdings LLC
- 10.4 Saint-Gobain Proppants
- 10.5 Hexion Inc.
- 10.6 Badger Mining Corporation
- 10.7 Hi-Crush Inc.
- 10.8 China GengSheng Minerals, Inc.
- 10.9 ChangQing Proppant
- 10.10 Emerge Energy Services LP (Superior Silica Sands)
- 10.11 Preferred Sands LLC
- 10.12 CoorsTek Inc.
- 10.13 Atlas Sand Company, LLC
- 10.14 Fores LTD
- 10.15 Xinmi Wanli Industry Development Co., Ltd.

