PUBLISHER: Global Market Insights Inc. | PRODUCT CODE: 2045838

PUBLISHER: Global Market Insights Inc. | PRODUCT CODE: 2045838
Octyl Alcohol Market Opportunity, Growth Drivers, Industry Trend Analysis, and Forecast 2026 - 2035
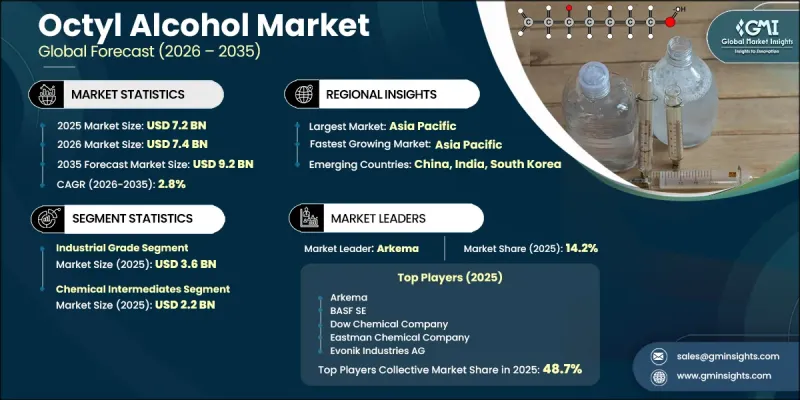
The Global Octyl Alcohol Market was valued at USD 7.2 billion in 2025 and is estimated to grow at a CAGR of 2.8% to reach USD 9.2 billion by 2035.
The market is gradually advancing as demand rises for versatile chemical intermediates used across industrial manufacturing and specialty formulation processes. Octyl alcohol is produced through oxo synthesis, where propylene reacts with synthesis gas under hydroformylation conditions to form multiple isomeric structures. Its linear and branched molecular configurations provide strong solvent performance and high chemical reactivity, making it a critical input for industries requiring reliable intermediate compounds. It is widely utilized across chemical processing, pharmaceuticals, and personal care applications due to its role in enabling formulation stability and chemical synthesis efficiency. The compound's resistance to oxidation and strong compatibility with organic substances enhances its suitability for both industrial-scale operations and consumer-oriented formulations. Growing preference for low-toxicity and more sustainable chemical alternatives is also supporting adoption, while ongoing advancements in catalytic systems and production methods are improving yield efficiency and isomer control. Manufacturers are increasingly adopting modified oxo synthesis routes and bio-based production pathways, enabling improved purity levels and more controlled product characteristics tailored to end-use requirements.
| Market Scope | |
|---|---|
| Start Year | 2025 |
| Forecast Year | 2026-2035 |
| Start Value | $7.2 Billion |
| Forecast Value | $9.2 Billion |
| CAGR | 2.8% |
The industrial grade segment reached USD 3.6 billion in 2025 and continues to expand due to its cost efficiency and strong applicability in large-scale chemical synthesis and plasticizer manufacturing. Its high reactivity and performance make it a preferred input in ester production, particularly as demand rises for non-phthalate plasticizer alternatives. Continuous improvements in production processes are further enhancing purity levels and expanding industrial adoption.
The chemical intermediates segment accounted for USD 2.2 billion in 2025. Demand is increasing as octyl alcohol is widely used in the production of esters, surfactants, and plasticizers with improved environmental profiles. Its use as a solvent in coatings and cleaning formulations also continues to grow, supported by industrial requirements for efficient and stable chemical processing solutions.
North America Octyl Alcohol Market is projected to grow from USD 1.7 billion in 2025 to USD 2.1 billion in 2035. Growth in the region is driven by strong demand from chemical manufacturing and personal care industries that rely on high-purity intermediates, alongside increasing adoption of sustainable chemical production practices. Market expansion is further supported by investments in advanced production technologies and the development of bio-based feedstock infrastructure, which are improving supply efficiency and environmental performance.
Major players operating in the Global Octyl Alcohol Industry include ExxonMobil Chemical, INEOS Group Holdings, Dow Chemical Company, BASF SE, Arkema, Eastman Chemical Company, Evonik Industries AG, Shell Chemicals, Sasol Limited, Formosa Plastics Corporation, LG Chem, and Huntsman Corporation. Companies in the octyl alcohol market are focusing on upgrading catalytic process technologies to improve production efficiency and enhance isomer selectivity. Strategic investments in bio-based feedstock integration are being prioritized to align with sustainability goals and reduce environmental impact. Manufacturers are strengthening R&D capabilities to develop high-purity and application-specific grades suitable for diverse industrial uses. Expansion of production capacity and modernization of manufacturing facilities are helping meet rising global demand. Partnerships with downstream industries are supporting better value chain integration, while digital process monitoring systems are being adopted to optimize operational efficiency.
Table of Contents
Chapter 1 Methodology & Scope
- 1.1 Market scope and definition
- 1.2 Research design
- 1.2.1 Research approach
- 1.2.2 Data collection methods
- 1.3 Data mining sources
- 1.3.1 Global
- 1.3.2 Regional/Country
- 1.4 Base estimates and calculations
- 1.4.1 Base year calculation
- 1.4.2 Key trends for market estimation
- 1.5 Primary research and validation
- 1.5.1 Primary sources
- 1.6 Forecast model
- 1.7 Research assumptions and limitations
Chapter 2 Executive Summary
- 2.1 Industry 360° synopsis
- 2.2 Key market trends
- 2.2.1 Type
- 2.2.2 Application
- 2.2.3 Regional
- 2.3 TAM Analysis, 2026-2035
- 2.4 CXO perspectives: Strategic imperatives
Chapter 3 Industry Insights
- 3.1 Industry ecosystem analysis
- 3.1.1 Supplier landscape
- 3.1.2 Profit margin
- 3.1.3 Value addition at each stage
- 3.1.4 Factor affecting the value chain
- 3.1.5 Disruptions
- 3.2 Industry impact forces
- 3.2.1 Growth drivers
- 3.2.2 Industry pitfalls and challenges
- 3.2.3 Market opportunities
- 3.3 Growth potential analysis
- 3.4 Regulatory landscape
- 3.4.1 North America
- 3.4.2 Europe
- 3.4.3 Asia Pacific
- 3.4.4 Latin America
- 3.4.5 Middle East & Africa
- 3.5 Porter's analysis
- 3.6 PESTEL analysis
- 3.7 Price trends
- 3.7.1 By region
- 3.7.2 By type
- 3.8 Future market trends
- 3.9 Technology and Innovation landscape
- 3.9.1 Current technological trends
- 3.9.2 Emerging technologies
- 3.10 Patent Landscape
- 3.11 Trade statistics
- 3.11.1 Major importing countries
- 3.11.2 Major exporting countries
- 3.12 Sustainability and environmental aspects
- 3.12.1 Sustainable practices
- 3.12.2 Waste reduction strategies
- 3.12.3 Energy efficiency in production
- 3.12.4 Eco-friendly initiatives
- 3.13 Carbon footprint consideration
Chapter 4 Competitive Landscape, 2025
- 4.1 Introduction
- 4.2 Company market share analysis
- 4.2.1 By region
- 4.2.1.1 North America
- 4.2.1.2 Europe
- 4.2.1.3 Asia Pacific
- 4.2.1.4 LATAM
- 4.2.1.5 MEA
- 4.2.1 By region
- 4.3 Competitive analysis of major market players
- 4.4 Competitive positioning matrix
- 4.5 Key developments
- 4.5.1 Mergers & acquisitions
- 4.5.2 Partnerships & collaborations
- 4.5.3 New Product Launches
- 4.5.4 Expansion Plans
Chapter 5 Market Estimates and Forecast, By Type, 2022-2035 (USD Billion) (Million Litters)
- 5.1 Key trends
- 5.2 Industrial Grade
- 5.3 Food Grade
- 5.4 Pharmaceutical Grade
- 5.5 Cosmetic Grade
- 5.6 Others
Chapter 6 Market Estimates and Forecast, By Application, 2022-2035 (USD Billion) (Million Litters)
- 6.1 Key trends
- 6.2 Chemical Intermediates
- 6.2.1 Plasticizers Production
- 6.2.2 Surfactants & Emulsifiers
- 6.2.3 Esters Production (Octyl Acetate)
- 6.2.4 Others
- 6.3 Solvent
- 6.3.1 Paints & Coatings Solvent
- 6.3.2 Inks Solvent
- 6.3.3 Others
- 6.4 Plastics and Polymers
- 6.4.1 PVC Plasticization
- 6.4.2 Other Polymer Applications
- 6.5 Flavors and Fragrances
- 6.6 Personal Care Products
- 6.7 Pharmaceuticals
- 6.8 Others
Chapter 7 Market Estimates and Forecast, By Region, 2022-2035 (USD Billion) (Kilo Tons)
- 7.1 Key trends
- 7.2 North America
- 7.2.1 U.S.
- 7.2.2 Canada
- 7.3 Europe
- 7.3.1 Germany
- 7.3.2 UK
- 7.3.3 France
- 7.3.4 Spain
- 7.3.5 Italy
- 7.3.6 Rest of Europe
- 7.4 Asia Pacific
- 7.4.1 China
- 7.4.2 India
- 7.4.3 Japan
- 7.4.4 Australia
- 7.4.5 South Korea
- 7.4.6 Rest of Asia Pacific
- 7.5 Latin America
- 7.5.1 Brazil
- 7.5.2 Mexico
- 7.5.3 Argentina
- 7.5.4 Rest of Latin America
- 7.6 Middle East and Africa
- 7.6.1 Saudi Arabia
- 7.6.2 South Africa
- 7.6.3 UAE
- 7.6.4 Rest of Middle East and Africa
Chapter 8 Company Profiles
- 8.1 Arkema
- 8.2 BASF SE
- 8.3 Dow Chemical Company
- 8.4 Eastman Chemical Company
- 8.5 Evonik Industries AG
- 8.6 ExxonMobil Chemical
- 8.7 INEOS Group Holdings
- 8.8 LG Chem
- 8.9 Sasol Limited
- 8.10 Formosa Plastics Corporation
- 8.11 Huntsman Corporation
- 8.12 Shell Chemicals

