
PUBLISHER: Global Market Insights Inc. | PRODUCT CODE: 2045852

PUBLISHER: Global Market Insights Inc. | PRODUCT CODE: 2045852
Water Desalination and Purification Equipment Market Opportunity, Growth Drivers, Industry Trend Analysis, and Forecast 2026 - 2035
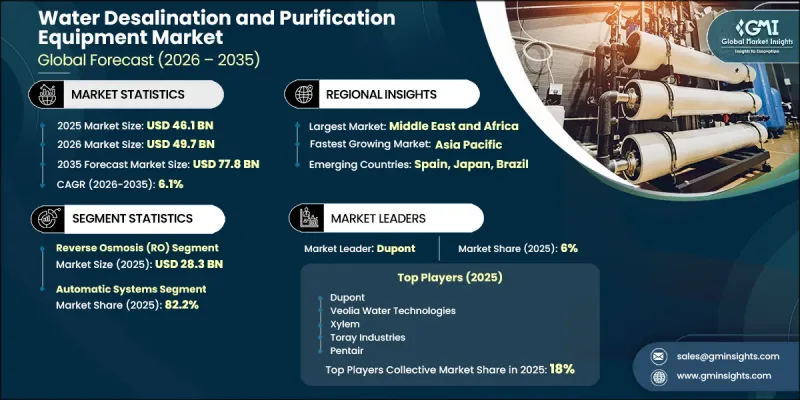
The Global Water Desalination and Purification Equipment Market was valued at USD 46.1 billion in 2025 and is estimated to grow at a CAGR of 6.1% to reach USD 77.8 billion by 2035.
Market growth is driven by increasing global water scarcity, rapid urbanization, and rising industrial demand for clean and safe water. As freshwater resources continue to decline due to climate change, population growth, and overexploitation, desalination and purification technologies have become critical solutions for ensuring a sustainable water supply. Governments and industries are increasingly investing in advanced water treatment infrastructure to address the growing gap between water demand and availability. Technologies such as reverse osmosis, ultrafiltration, and advanced oxidation processes are gaining widespread adoption due to their efficiency, scalability, and ability to remove contaminants, pathogens, and dissolved solids from water sources.
| Market Scope | |
|---|---|
| Start Year | 2025 |
| Forecast Year | 2026-2035 |
| Start Value | $46.1 Billion |
| Forecast Value | $77.8 Billion |
| CAGR | 6.1% |
The market is experiencing significant growth as both developed and developing regions prioritize water security and environmental sustainability. Municipalities are investing heavily in large-scale desalination plants to provide potable water, particularly in water-stressed regions, while industries such as power generation, oil & gas, pharmaceuticals, and food & beverage are adopting purification systems to meet regulatory standards and operational requirements. Technological advancements, including energy-efficient membranes, smart monitoring systems, and automation, are further enhancing system performance and reducing operational costs. Additionally, increasing awareness regarding water conservation, reuse, and recycling is driving the adoption of advanced purification equipment across residential, commercial, and industrial sectors.
The market is segmented by technology, with reverse osmosis (RO) systems dominating, valued at USD 28.3 billion in 2025, driven by their high efficiency, cost-effectiveness, and widespread application in both desalination and water purification processes. RO systems are extensively used for removing salts, bacteria, and other impurities, making them a preferred choice across municipal and industrial applications.
In terms of end use, the municipal segment reached USD 19.7 billion in 2025, driven by rising investments in public water infrastructure and increasing demand for safe drinking water across urban populations. Governments worldwide are focusing on expanding water treatment capacity and upgrading aging infrastructure to ensure a reliable water supply.
United States Water Desalination and Purification Equipment Market held a 77% share, generating USD 6.5 billion in 2025. The region represents a major portion of the global desalination industry, with the United States driving growth through large-scale developments across states, including California, Texas, and Florida. At the same time, Canada is steadily increasing the adoption of desalination and purification technologies for industrial operations and water treatment requirements in remote communities. Growing investments in advanced filtration systems, water reuse technologies, and sustainable treatment solutions are further strengthening the regional market outlook.
Key players operating in the Global Water Desalination and Purification Equipment Market include Veolia, SUEZ, Xylem Inc., DuPont, Pentair plc, Toray Industries, IDE Technologies, Kurita Water Industries, Aquatech International, and Evoqua Water Technologies. Companies in the global water desalination and purification equipment market are focusing on technological innovation, strategic collaborations, and large-scale project development to strengthen their market foothold. A key strategy involves investing in advanced membrane technologies and energy-efficient systems to reduce operational costs and improve performance. Firms are forming partnerships with governments and municipalities to secure long-term contracts for desalination and water treatment projects. Additionally, companies are expanding their global presence through joint ventures and acquisitions, particularly in water-stressed regions. Digitalization, including smart monitoring and automation systems, is being adopted to enhance efficiency and reliability.
Table of Contents
Chapter 1 Research Methodology
- 1.1 Research approach
- 1.2 Quality Commitments
- 1.2.1 GMI AI policy & data integrity commitment
- 1.2.1.1 Source consistency protocol
- 1.2.1 GMI AI policy & data integrity commitment
- 1.3 Research Trail & Confidence Scoring
- 1.3.1 Research Trail Components
- 1.3.2 Scoring Components
- 1.4 Data Collection
- 1.4.1 Partial list of primary sources
- 1.5 Data mining sources
- 1.5.1 Paid sources
- 1.5.1.1 Sources, by region
- 1.5.1 Paid sources
- 1.6 Base estimates and calculations
- 1.6.1 Base year calculation for any one approach
- 1.7 Forecast model
- 1.7.1 Quantified market impact analysis
- 1.7.1.1 Mathematical impact of growth parameters on forecast
- 1.7.1 Quantified market impact analysis
- 1.8 Research transparency addendum
- 1.8.1 Source attribution framework
- 1.8.2 Quality assurance metrics
- 1.8.3 Our commitment to trust
Chapter 2 Executive Summary
- 2.1 Industry synopsis, 2022 - 2035
- 2.2 Key Trends
- 2.2.1 Region
- 2.2.2 Technology
- 2.2.3 Mode of Operation
- 2.2.4 System Scale
- 2.2.5 End Use
- 2.2.6 Distribution Channel
Chapter 3 Industry Insights
- 3.1 Industry ecosystem analysis
- 3.1.1 Upstream suppliers (raw materials, components)
- 3.1.2 Equipment manufacturers and technology providers
- 3.1.3 Distributors and EPC contractors
- 3.1.4 End users and service providers
- 3.1.5 Value addition at each stage
- 3.1.6 Profit margin analysis by value chain position
- 3.2 Industry impact forces
- 3.2.1 Growth drivers
- 3.2.2 Industry pitfalls & challenges
- 3.2.3 Opportunities
- 3.3 Growth potential analysis
- 3.4 Future market trends
- 3.5 Technology and Innovation Landscape
- 3.5.1 Membrane technology advancements
- 3.5.2 Thermal Desalination Innovations
- 3.5.3 Hybrid system development
- 3.5.4 Energy recovery technology evolution
- 3.5.5 Automation and remote monitoring solutions
- 3.5.6 Modular and containerized design trends
- 3.6 Patent landscape (driven by primary research)
- 3.6.1 Patent filing trends by technology type (2022-2025)
- 3.6.2 Key patent holders and innovation leaders
- 3.6.3 Emerging patent clusters and white space analysis
- 3.7 Pricing analysis (driven by primary research)
- 3.7.1 Historical price trend analysis (2022-2025)
- 3.7.2 Pricing strategy by player type (premium, value, cost-plus)
- 3.7.3 Cost structure breakdown (equipment, installation, O&M)
- 3.7.4 Price sensitivity by end-user segment
- 3.8 Regulatory landscape
- 3.8.1 Standards and compliance requirements
- 3.8.2 Regional regulatory frameworks
- 3.8.3 Certification standards
- 3.9 Trade data analysis (driven by paid database)
- 3.9.1 Import/export volume and value trends (2022-2025)
- 3.9.2 Key trade corridors and tariff impact
- 3.9.3 Major exporting countries and competitive advantage
- 3.9.4 Import dependency by region
- 3.10 Impact of ai & generative ai on the market
- 3.10.1 AI-driven disruption of existing business models
- 3.10.2 GenAI use cases and adopt roadmaps by segment
- 3.10.2.1 Predictive maintenance and operations optimization
- 3.10.2.2 Design engineering and process simulation
- 3.10.2.3 Supply chain and demand forecasting
- 3.10.3 Risks, limitations, and regulatory considerations
- 3.11 Porter's analysis
- 3.12 PESTEL analysis
- 3.13 Capacity & production landscape (Driven by Primary Research)
- 3.13.1 Installed capacity by region and key producer
- 3.13.2 Capacity utilization rates and expansion pipelines
Chapter 4 Competitive Landscape, 2025
- 4.1 Introduction
- 4.2 Company market share analysis
- 4.2.1 North America
- 4.2.2 Europe
- 4.2.3 Asia Pacific
- 4.2.4 Latin America
- 4.2.5 Middle East and Africa
- 4.3 Company matrix analysis
- 4.4 Competitive analysis of major market players
- 4.5 Competitive positioning matrix
- 4.6 Key developments
- 4.6.1 Mergers & acquisitions
- 4.6.2 Partnerships & collaborations
- 4.6.3 New product launches
- 4.6.4 Expansion plans
Chapter 5 Market Estimates & Forecast, By Technology, 2022-2035 (USD Billion)
- 5.1 Key trends
- 5.2 Nanofiltration
- 5.3 Reverse osmosis (RO)
- 5.4 Multi-stage flash (MSF)
- 5.5 Ultrafiltration (UF)
- 5.6 Ultraviolet (UV) purification
- 5.7 Activated carbon filtration
- 5.8 Others (ultrafiltration, ion exchange, etc.)
Chapter 6 Market Estimates & Forecast, By Mode of Operation, 2022-2035 (USD Billion)
- 6.1 Key trends
- 6.2 Automatic systems
- 6.3 Manual systems
Chapter 7 Market Estimates & Forecast, By System Scale, 2022-2035 (USD Billion)
- 7.1 Key trends
- 7.2 Small-scale system (0-499 m³/day)
- 7.2.1 Ultra-small/low-flow systems [0-299 m³/day]
- 7.2.2 Small systems [300-499 m³/day]
- 7.3 Medium-scale system (500-9,999 m³/day)
- 7.4 Large-scale systems (10,000+ m³/day)
Chapter 8 Market Estimates & Forecast, By Source Water Type, 2022-2035 (USD Billion)
- 8.1 Key trends
- 8.2 Seawater
- 8.3 Brackish Water
- 8.4 River Water
- 8.5 Others
Chapter 9 Market Estimates & Forecast, By End Use 2022-2035 (USD Billion)
- 9.1 Key trends
- 9.2 Municipal
- 9.3 Industrial
- 9.4 Residential
- 9.5 Commercial
- 9.6 Others (healthcare, agriculture)
Chapter 10 Market Estimates & Forecast, By Distribution Channel 2022-2035 (USD Billion)
- 10.1 Key trends
- 10.2 Direct
- 10.3 Indirect
Chapter 11 Market Estimates & Forecast, By Region, 2022 - 2035 ($Bn)
- 11.1 Key trends
- 11.2 North America
- 11.2.1 U.S.
- 11.2.2 Canada
- 11.3 Europe
- 11.3.1 UK
- 11.3.2 Germany
- 11.3.3 France
- 11.3.4 Italy
- 11.3.5 Spain
- 11.4 Asia Pacific
- 11.4.1 China
- 11.4.2 India
- 11.4.3 Japan
- 11.4.4 Australia
- 11.4.5 South Korea
- 11.5 Latin America
- 11.5.1 Brazil
- 11.5.2 Mexico
- 11.6 MEA
- 11.6.1 UAE
- 11.6.2 South Africa
- 11.6.3 Saudi Arabia
Chapter 12 Company Profiles
- 12.1 Toray Industries
- 12.2 DuPont Water Solutions (FilmTec)
- 12.3 SUEZ Water Technologies & Solutions
- 12.4 Veolia Water Technologies
- 12.5 IDE Technologies
- 12.6 Pentair
- 12.7 Xylem
- 12.8 Grundfos
- 12.9 Aquatech International
- 12.10 Membranium
- 12.11 Hydranautics / Nitto Denko
- 12.12 LG Chem / NanoH2O
- 12.13 Kovalus Separation Solutions
- 12.14 Alfa Laval
- 12.15 Applied Membranes Inc. (AMI)

