PUBLISHER: Global Market Insights Inc. | PRODUCT CODE: 2045857

PUBLISHER: Global Market Insights Inc. | PRODUCT CODE: 2045857
Second-hand Electronic Products Market Opportunity, Growth Drivers, Industry Trend Analysis, and Forecast 2026 - 2035
The Global Second-Hand Electronic Products Market was valued at USD 139.5 billion in 2025 and is estimated to grow at a CAGR of 7.2% to reach USD 286.9 billion by 2035.
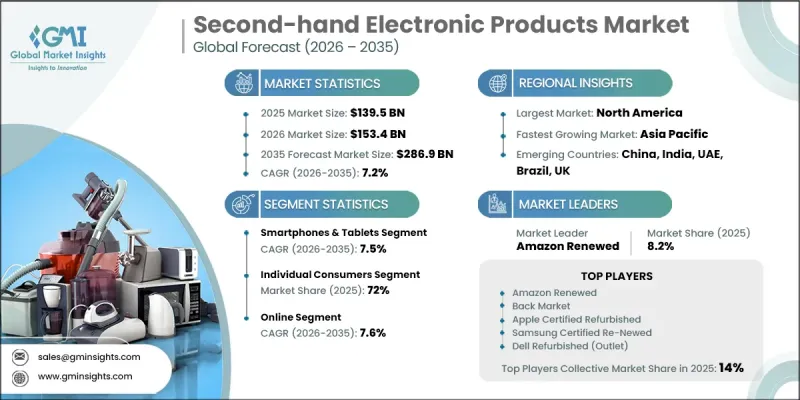
Growth in this industry is driven by increasing consumer awareness of environmental sustainability and the urgent need to reduce electronic waste worldwide. The rising adoption of pre-owned electronic devices aligns strongly with circular economy principles, encouraging reuse and extending product lifecycles. In addition, affordability remains a major growth driver, as second-hand electronics provide access to advanced technology at significantly lower prices, making them attractive for budget-conscious consumers. Government initiatives promoting recycling, reuse, and responsible disposal of electronic products are further supporting market expansion. Expanding digital marketplaces and improved resale ecosystems are also making it easier for consumers to buy and sell used electronics with greater trust and transparency. Growing environmental consciousness, combined with financial practicality, continues to strengthen demand across both developed and emerging economies, positioning the market for sustained long-term growth.
| Market Scope | |
|---|---|
| Start Year | 2025 |
| Forecast Year | 2026-2035 |
| Start Value | $139.5 Billion |
| Forecast Value | $286.9 Billion |
| CAGR | 7.2% |
The smartphones and tablets segment accounted for USD 85.7 billion in 2025 and is projected to grow at a CAGR of 7.5% through 2035. This segment remains dominant due to strong consumer preference for cost-effective mobile devices and increasing acceptance of refurbished smartphones. Improvements in quality certification processes and the availability of verified pre-owned devices have strengthened buyer confidence. The expansion of digital resale channels has also made it easier for consumers to access a wide range of affordable mobile devices, further supporting segment growth.
The online distribution channel is expected to grow at a CAGR of 7.6% from 2026 to 2035. Growth in this segment is supported by rising internet penetration and the convenience of purchasing refurbished electronics through digital platforms. Increasing consumer preference for online transactions, particularly among younger demographics, is further accelerating adoption. The growing specialization of e-commerce platforms focused exclusively on pre-owned electronics is also enhancing product availability, improving price transparency, and strengthening overall market accessibility.
United States Second-Hand Electronic Products Market held an 84% share, generating USD 44.7 billion in 2025. Market growth in the country is supported by strong consumer awareness regarding sustainability and cost savings associated with refurbished electronics. High levels of digital adoption and advanced e-commerce infrastructure continue to facilitate widespread market penetration. Large consumer populations in key states such as California, Texas, and New York further contribute to strong demand, supported by robust technology adoption trends and established resale ecosystems.
Major companies operating in the Global Second-Hand Electronic Products Market include Amazon Renewed, Apple Certified Refurbished, Back Market, Dell Technologies (Dell Refurbished/Dell Outlet), HP Inc. (HP Renew), Lenovo (Lenovo Outlet), Samsung Electronics (Samsung Certified Re-Newed), Cashify, CEX, Swappa, Recommerce Group, Newegg (Refreshed segment), and other regional and niche players operating across resale and refurbishment ecosystems. Companies in the second-hand electronic products market are increasingly focusing on strengthening refurbishment capabilities and expanding certified pre-owned programs to build consumer trust and ensure product reliability. Leading players are investing in advanced testing, grading, and quality assurance systems to standardize device conditions and improve transparency in resale transactions. Many firms are expanding digital marketplace platforms and enhancing user experience through seamless buying, selling, and exchange processes. Strategic partnerships with logistics providers are improving reverse supply chain efficiency and enabling faster product turnaround cycles. Companies are also adopting sustainability-focused branding strategies to align with environmental goals and attract eco-conscious consumers.
Table of Contents
Chapter 1 Methodology and scope
- 1.1 Research approach
- 1.2 Quality Commitments
- 1.2.1 GMI AI policy & data integrity commitment
- 1.2.1.1 Source consistency protocol
- 1.2.1 GMI AI policy & data integrity commitment
- 1.3 Research Trail & Confidence Scoring
- 1.3.1 Research Trail Components
- 1.3.2 Scoring Components
- 1.4 Data Collection
- 1.4.1 Partial list of primary sources
- 1.5 Data mining sources
- 1.5.1 Paid sources
- 1.5.1.1 Sources, by region
- 1.5.1 Paid sources
- 1.6 Base estimates and calculations
- 1.6.1 Base year calculation for any one approach
- 1.7 Forecast model
- 1.7.1 Quantified market impact analysis
- 1.7.1.1 Mathematical impact of growth parameters on forecast
- 1.7.1 Quantified market impact analysis
- 1.8 Research transparency addendum
- 1.8.1 Source attribution framework
- 1.8.2 Quality assurance metrics
- 1.8.3 Our commitment to trust
Chapter 2 Executive summary
- 2.1 Industry 360° synopsis
- 2.2 Key market trends
- 2.2.1 Regional
- 2.2.2 Product Type
- 2.2.3 Refurbishment Type
- 2.2.4 End User
- 2.2.5 Distribution Channel
Chapter 3 Industry insights
- 3.1 Industry ecosystem analysis
- 3.1.1 Supplier landscape
- 3.1.2 Profit margin
- 3.1.3 Value addition at each stage
- 3.1.4 Factor affecting the value chain
- 3.1.5 Disruptions
- 3.2 Industry impact forces
- 3.2.1 Growth drivers
- 3.2.2 Industry pitfalls & challenges
- 3.2.3 Opportunities
- 3.3 Growth potential analysis
- 3.4 Future market trends
- 3.5 Technology and innovation landscape
- 3.5.1 Current technological trends
- 3.5.2 Emerging technologies
- 3.6 Porter's five forces analysis
- 3.7 PESTEL analysis
- 3.8 Price trends
- 3.8.1 Historical price trend analysis
- 3.8.2 Pricing strategy by player type
- 3.9 Regulatory framework
- 3.9.1 Standards and certifications
- 3.9.2 Environmental regulations
- 3.9.3 Import export regulations
- 3.10 Trade data analysis (HS Code:8528)
- 3.10.1 Import/export volume & value trends
- 3.10.2 Key trade corridors & tariff impact
- 3.11 Impact of AI & generative ai on the market
- 3.11.1 AI-driven disruption of traditional business models
- 3.11.2 GenAI use cases & adoption roadmap by customer segment
- 3.11.3 Risks, limitations & regulatory considerations
- 3.11.4 AI-enabled smart home ecosystem integration
- 3.12 Distribution infrastructure & channel penetration landscape
- 3.12.1 Channel coverage by region & format (modern vs. Traditional trade)
- 3.12.2 Last-mile infrastructure gaps & emerging channel shifts
- 3.13 Consumer behavior analysis
- 3.13.1 Purchasing patterns
- 3.13.2 Preference analysis
- 3.13.3 Regional variations in consumer behavior
- 3.13.4 Impact of e-commerce on buying decisions
Chapter 4 Competitive landscape, 2025
- 4.1 Introduction
- 4.2 Company market share analysis
- 4.2.1 North America
- 4.2.2 Europe
- 4.2.3 Asia Pacific
- 4.2.4 Latin America
- 4.2.5 MEA
- 4.3 Company matrix analysis
- 4.4 Competitive analysis of major market players
- 4.5 Competitive positioning matrix
- 4.6 Key developments
- 4.6.1 Mergers & acquisitions
- 4.6.2 Partnerships & collaborations
- 4.6.3 New product launches
- 4.6.4 Expansion plans
Chapter 5 Market Estimates & Forecast, By Product Type, 2022 - 2035 ($Billion, Million Units)
- 5.1 Key trends
- 5.2 Smartphones & tablets
- 5.3 Computers & laptops
- 5.4 TVs & audio-video devices
- 5.5 Home appliances
- 5.6 Cameras & lenses
- 5.7 Printers & monitors
- 5.8 Others (smartwatches & wearables etc.)
Chapter 6 Market Estimates & Forecast, By Refurbishment Type, 2022 - 2035 ($Billion, Million Units)
- 6.1 Key trends
- 6.2 Certified refurbished
- 6.3 Seller refurbished
- 6.4 Open box
- 6.5 Pre-owned
Chapter 7 Market Estimates & Forecast, By End User, 2022 - 2035 ($Billion, Million Units)
- 7.1 Key trends
- 7.2 Individual consumers
- 7.3 Commercial/business buyers
- 7.3.1 Enterprises & corporations
- 7.3.2 Small & medium businesses (SMBs)
- 7.3.3 Resellers & retailers
- 7.3.4 Educational institutions
Chapter 8 Market Estimates & Forecast, By Distribution Channel, 2022 - 2035 ($Billion, Million Units)
- 8.1 Key trends
- 8.2 Online
- 8.2.1 E-commerce
- 8.2.2 Company websites
- 8.3 Offline
- 8.3.1 Refurbished direct outlets
- 8.3.2 Specialty retail stores
- 8.3.3 Others (electronics shops etc.)
Chapter 9 Market Estimates & Forecast, By Region, 2022 - 2035 ($Billion, Million Units)
- 9.1 Key trends
- 9.2 North America
- 9.2.1 U.S.
- 9.2.2 Canada
- 9.3 Europe
- 9.3.1 Germany
- 9.3.2 UK
- 9.3.3 France
- 9.3.4 Spain
- 9.3.5 Italy
- 9.3.6 Netherlands
- 9.4 Asia Pacific
- 9.4.1 China
- 9.4.2 Japan
- 9.4.3 India
- 9.4.4 Australia
- 9.4.5 South Korea
- 9.5 Latin America
- 9.5.1 Brazil
- 9.5.2 Mexico
- 9.5.3 Argentina
- 9.6 MEA
- 9.6.1 South Africa
- 9.6.2 Saudi Arabia
- 9.6.3 UAE
Chapter 10 Company Profiles
- 10.1 Global Key Players
- 10.1.1 Amazon Renewed
- 10.1.2 Apple Certified Refurbished
- 10.1.3 Back Market
- 10.1.4 Dell Refurbished (Dell Outlet)
- 10.1.5 HP Renew
- 10.1.6 Lenovo Outlet
- 10.1.7 Samsung Certified Re-Newed
- 10.2 Regional Players
- 10.2.1 2ndgear
- 10.2.2 Cashify
- 10.2.3 CEX (Complete Entertainment eXchange)
- 10.2.4 Orchard
- 10.2.5 reBuy
- 10.2.6 Recommerce Group
- 10.2.7 Swappa
- 10.3 Emerging/Niche Specialists
- 10.3.1 AT&T Certified Restored
- 10.3.2 Loop Mobile
- 10.3.3 Newegg Refreshed
- 10.3.4 OWC (Other World Computing)
- 10.3.5 Raylo
- 10.3.6 Reboxed
- 10.3.7 Renewd

