PUBLISHER: Global Market Insights Inc. | PRODUCT CODE: 2045870

PUBLISHER: Global Market Insights Inc. | PRODUCT CODE: 2045870
Metallic Microspheres Market Opportunity, Growth Drivers, Industry Trend Analysis, and Forecast 2026 - 2035
The Global Metallic Microspheres Market was valued at USD 1.6 billion in 2025 and is estimated to grow at a CAGR of 8.4% to reach USD 3.6 billion by 2035.
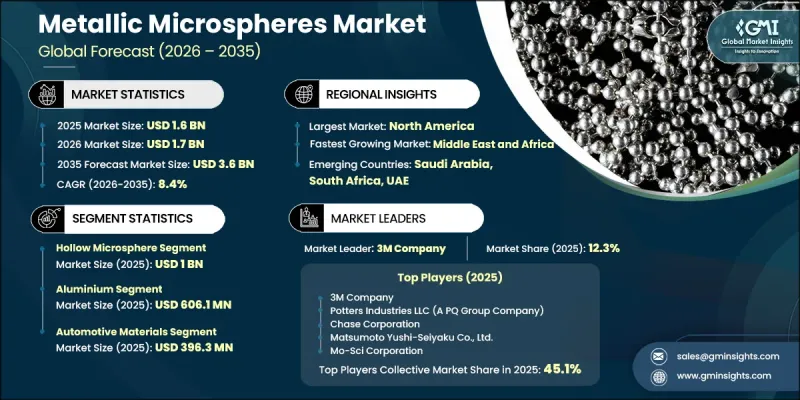
The market is expanding steadily as industries increasingly adopt advanced materials that offer a balance of strength, conductivity, and lightweight characteristics. Metallic microspheres are engineered spherical particles composed of metals and alloys, valued for their structural integrity, durability, and reflective properties. These materials are widely incorporated into coatings, polymers, electronics, and structural composites to enhance overall product performance. Their ability to function as lightweight fillers, conductive elements, and performance enhancers makes them suitable for a broad range of industrial applications. High resistance to temperature variations, chemical exposure, and mechanical stress further supports their use in demanding environments. Advancements in material science are enabling more precise and consistent production processes, improving particle uniformity and performance reliability. The development of innovative manufacturing techniques is also supporting the customization of microspheres for specialized applications. As industries continue to prioritize efficiency, durability, and performance optimization, metallic microspheres are becoming an integral component in next-generation material solutions.
| Market Scope | |
|---|---|
| Start Year | 2025 |
| Forecast Year | 2026-2035 |
| Start Value | $1.6 Billion |
| Forecast Value | $3.6 Billion |
| CAGR | 8.4% |
The hollow microsphere segment accounted for USD 1 billion in 2025, leading the overall market. These microspheres are gaining traction due to their ability to reduce weight while maintaining structural performance. Their properties support applications requiring insulation, buoyancy, and lightweight structural enhancement, aligning with the growing demand for energy-efficient and high-performance materials.
The automotive materials segment reached USD 396.3 million in 2025, reflecting strong demand for advanced materials that support structural performance and durability. Metallic microspheres are increasingly utilized in applications requiring controlled material composition and enhanced strength, contributing to improved performance in demanding operating conditions.
North America Metallic Microspheres Market is expected to grow from USD 493.4 million in 2025 to USD 1.1 billion by 2035, driven by increasing demand for advanced materials and precision manufacturing technologies. The region continues to benefit from strong research and development activities focused on improving material performance and expanding application capabilities, supporting long-term market growth.
Key companies operating in the Global Metallic Microspheres Market include 3M Company, AkzoNobel N.V., Trelleborg AB, Potters Industries LLC (A PQ Group Company), Momentive Performance Materials Inc., Chase Corporation, Cospheric LLC, Matsumoto Yushi-Seiyaku Co., Ltd., Mo-Sci Corporation, and Sigmund Lindner GmbH. Companies in the metallic microspheres market are adopting strategic initiatives to strengthen their competitive positioning and expand their market presence. They are investing in research and development to enhance product performance, improve material consistency, and develop application-specific solutions. Strategic collaborations and partnerships are enabling companies to broaden their technological capabilities and access new end-use industries. Expansion of production capacities and optimization of supply chains are supporting growing demand across regions. Firms are also focusing on innovation in manufacturing techniques to achieve higher precision and efficiency.
Table of Contents
Chapter 1 Methodology & Scope
- 1.1 Market scope and definition
- 1.2 Research design
- 1.2.1 Research approach
- 1.2.2 Data collection methods
- 1.3 Data mining sources
- 1.3.1 Global
- 1.3.2 Regional/Country
- 1.4 Base estimates and calculations
- 1.4.1 Base year calculation
- 1.4.2 Key trends for market estimation
- 1.5 Primary research and validation
- 1.5.1 Primary sources
- 1.6 Forecast model
- 1.7 Research assumptions and limitations
Chapter 2 Executive Summary
- 2.1 Industry 360° synopsis
- 2.2 Key market trends
- 2.2.1 Type
- 2.2.2 Material
- 2.2.3 Application
- 2.2.4 Regional
- 2.3 TAM Analysis, 2026-2035
- 2.4 CXO perspectives: Strategic imperatives
- 2.5 Future outlook and strategic recommendations
Chapter 3 Industry Insights
- 3.1 Industry ecosystem analysis
- 3.1.1 Supplier landscape
- 3.1.2 Profit margin
- 3.1.3 Value addition at each stage
- 3.1.4 Factor affecting the value chain
- 3.1.5 Disruptions
- 3.2 Industry impact forces
- 3.2.1 Growth drivers
- 3.2.1.1 Advanced composites increasingly integrate metallic microsphere additives
- 3.2.1.2 Rising demand for lightweight industrial material solutions
- 3.2.1.3 Expanding usage in electrical and thermal conductivity applications
- 3.2.2 Pitfalls/challenge
- 3.2.2.1 Production cost variation affects consistent supply availability
- 3.2.2.2 Limited awareness restricts adoption in emerging industries
- 3.2.3 Opportunities
- 3.2.3.1 Growing interest in customizable microsphere material compositions
- 3.2.3.2 Advancements in automated and controlled manufacturing technologies
- 3.2.1 Growth drivers
- 3.3 Growth potential analysis
- 3.4 Regulatory landscape
- 3.4.1 North America
- 3.4.2 Europe
- 3.4.3 Asia Pacific
- 3.4.4 Latin America
- 3.4.5 Middle East & Africa
- 3.5 Porter's analysis
- 3.6 PESTEL analysis
- 3.7 Technology and innovation landscape
- 3.7.1 Current technological trends
- 3.7.2 Emerging technologies
- 3.8 Price trends
- 3.8.1 By region
- 3.8.2 By type
- 3.9 Future market trends
- 3.10 Patent landscape
- 3.11 Trade statistics (HS code)
- 3.11.1 Major importing countries
- 3.11.2 Major exporting countries
- 3.12 Sustainability and environmental aspects
- 3.12.1 Sustainable practices
- 3.12.2 Waste reduction strategies
- 3.12.3 Energy efficiency in production
- 3.12.4 Eco-friendly initiatives
- 3.13 Carbon footprint consideration
Chapter 4 Competitive Landscape, 2025
- 4.1 Introduction
- 4.2 Company market share analysis
- 4.2.1 By region
- 4.2.1.1 North America
- 4.2.1.2 Europe
- 4.2.1.3 Asia Pacific
- 4.2.1.4 LATAM
- 4.2.1.5 MEA
- 4.2.1 By region
- 4.3 Company matrix analysis
- 4.4 Competitive analysis of major market players
- 4.5 Competitive positioning matrix
- 4.6 Key developments
- 4.6.1 Mergers & acquisitions
- 4.6.2 Partnerships & collaborations
- 4.6.3 New product launches
- 4.6.4 Expansion plans
Chapter 5 Market Estimates and Forecast, By Type, 2022-2035 (USD Billion) (Kilo Tons)
- 5.1 Key trends
- 5.2 Hollow microsphere
- 5.3 Solid microsphere
Chapter 6 Market Estimates and Forecast, By Material, 2022-2035 (USD Billion) (Kilo Tons)
- 6.1 Key trends
- 6.2 Aluminum
- 6.3 Nickel
- 6.4 Silver
- 6.5 Gold
- 6.6 Others (Copper, Titanium, etc.)
Chapter 7 Market Estimates and Forecast, By Application, 2022-2035 (USD Billion) (Kilo Tons)
- 7.1 Key trends
- 7.2 Automotive materials
- 7.3 Aerospace and defence materials
- 7.4 Biotechnology
- 7.5 Construction
- 7.6 Coating additives
- 7.7 Cosmetics
- 7.8 Oil and gas
- 7.9 Consumables
- 7.10 Others
Chapter 8 Market Estimates and Forecast, By Region, 2022-2035 (USD Billion) (Kilo Tons)
- 8.1 Key trends
- 8.2 North America
- 8.2.1 U.S.
- 8.2.2 Canada
- 8.3 Europe
- 8.3.1 Germany
- 8.3.2 UK
- 8.3.3 France
- 8.3.4 Spain
- 8.3.5 Italy
- 8.3.6 Rest of Europe
- 8.4 Asia Pacific
- 8.4.1 China
- 8.4.2 India
- 8.4.3 Japan
- 8.4.4 Australia
- 8.4.5 South Korea
- 8.4.6 Rest of Asia Pacific
- 8.5 Latin America
- 8.5.1 Brazil
- 8.5.2 Mexico
- 8.5.3 Argentina
- 8.5.4 Rest of Latin America
- 8.6 Middle East and Africa
- 8.6.1 Saudi Arabia
- 8.6.2 South Africa
- 8.6.3 UAE
- 8.6.4 Rest of Middle East and Africa
Chapter 9 Company Profiles
- 9.1 3M Company
- 9.2 AkzoNobel N.V.
- 9.3 Chase Corporation
- 9.4 Cospheric LLC
- 9.5 Matsumoto Yushi-Seiyaku Co., Ltd.
- 9.6 Momentive Performance Materials Inc.
- 9.7 Mo-Sci Corporation
- 9.8 Potters Industries LLC (A PQ Group Company)
- 9.9 Sigmund Lindner GmbH
- 9.10 Trelleborg AB

