
PUBLISHER: Global Market Insights Inc. | PRODUCT CODE: 2071170

PUBLISHER: Global Market Insights Inc. | PRODUCT CODE: 2071170
BESS Container and Enclosure Market Opportunity, Growth Drivers, Industry Trend Analysis, and Forecast 2026 - 2035
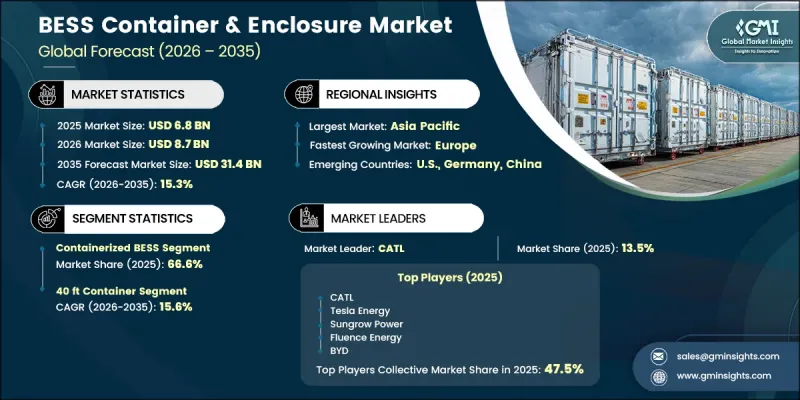
The Global BESS Container & Enclosure Market was valued at USD 6.8 billion in 2025 and is estimated to grow at a CAGR of 15.3% to reach USD 31.4 billion in 2035.
Market growth is reinforced by rapidly falling lithium iron phosphate (LFP) cell prices, which reached approximately USD 40 per kWh in Chinese domestic markets by late 2025, significantly improving project economics and expanding adoption across higher-performance containerized storage systems. At the same time, enclosure systems are increasingly capturing a larger share of total system cost structures, accounting for nearly 90% of the USD 75 per kWh core equipment baseline, highlighting their rising importance in system-level value creation. The industry is undergoing a clear transition from basic protective housing toward fully integrated containerized energy platforms that combine thermal regulation, battery management systems, and power conversion technologies within prefabricated units. This shift is reducing installation complexity, shortening deployment timelines, and lowering civil engineering requirements for developers and EPC contractors. Safety compliance and thermal performance standards are now central engineering priorities in enclosure design, further elevating product sophistication. The move toward standardized, factory-assembled systems is enabling faster procurement cycles and more scalable deployment models across global energy storage projects.
| Market Scope | |
|---|---|
| Start Year | 2025 |
| Forecast Year | 2026-2035 |
| Start Value | $6.8 Billion |
| Forecast Value | $31.4 Billion |
| CAGR | 15.3% |
Containerized BESS systems accounted for 66.6% share in 2025, maintaining growth at a CAGR of 15.3% through 2035. This segment's leadership is driven by its suitability for utility-scale and grid-scale energy storage applications, where standardized container dimensions, integrated battery modules, built-in thermal management systems, battery management systems, and power conversion components deliver high operational efficiency. The compatibility of these units with global shipping and logistics frameworks further enhances their deployment flexibility across international energy projects.
The cabinet and rack-based enclosure systems segment held a 21.8% share in 2025 and is projected to grow at a CAGR of 14.8% through 2035. These systems are primarily deployed in commercial and industrial environments, data centers, and behind-the-meter applications where compact design, modular scalability, and indoor installation flexibility are essential. Their adoption is supported by increasing demand for localized energy storage solutions that enhance energy reliability and support peak load management in constrained spaces.
North America BESS Container & Enclosure Market 29.9% share in 2025 and is projected to grow at a CAGR of 14.9% through 2035, supported by strong growth in utility-scale battery installations. Recent federal data indicates that 57.6 GWh of new storage capacity was added in 2025, representing a 30% increase over the previous record year. Continued expansion is expected as additional multi-gigawatt storage capacity is integrated into the national grid to support renewable energy expansion and grid reliability improvements.
Major companies operating in the BESS Container & Enclosure market include CATL (Contemporary Amperex Technology Co., Ltd.), BYD, Sungrow Power, Fluence Energy, Hitachi Energy, Schneider Electric, Samsung SDI, Eaton, Canadian Solar, Huawei Digital Power, Gotion High-Tech, AlphaESS, Hithium Energy Storage Technology, Hyperstrong Energy Technology, Powin, and Samsung SDI. Companies operating in the BESS Container & Enclosure market are focusing on several strategic initiatives to strengthen their competitive position and expand global market share. A key strategy involves developing highly integrated, prefabricated container systems that combine batteries, thermal management, and power conversion technologies into standardized units. Manufacturers are also investing heavily in improving safety architecture, fire suppression systems, and thermal stability mechanisms to meet increasingly strict regulatory requirements. Strategic partnerships with utilities, EPC contractors, and renewable developers are enabling large-scale deployment and long-term supply agreements. Firms are expanding manufacturing capacity in key regions to reduce logistics costs and improve delivery timelines.
Table of Contents
Chapter 1 Methodology & Scope
- 1.1 Research approach
- 1.2 Quality commitments
- 1.2.1 GMI AI policy & data integrity commitment
- 1.2.1.1 Source consistency protocol
- 1.2.1 GMI AI policy & data integrity commitment
- 1.3 Research trail & confidence scoring
- 1.3.1 Research trail components
- 1.3.2 Scoring components
- 1.4 Data collection
- 1.4.1 Partial list of primary sources
- 1.5 Data mining sources
- 1.5.1 Paid sources
- 1.5.1.1 Sources, by region
- 1.5.1 Paid sources
- 1.6 Base estimates and calculations
- 1.6.1 Base year calculation for any one approach
- 1.7 Market estimates & forecasts parameters
- 1.8 Forecast model
- 1.8.1 Quantified market impact analysis
- 1.8.1.1 Mathematical impact of growth parameters on forecast
- 1.8.1 Quantified market impact analysis
- 1.9 Research transparency addendum
- 1.9.1 Source attribution framework
- 1.9.2 Quality assurance metrics
- 1.9.3 Our commitment to trust
- 1.10 Market definitions
Chapter 2 Executive Summary
- 2.1 Industry synopsis, 2022 - 2035
- 2.1.1 Business trends
- 2.1.2 Product trends
- 2.1.3 Container size trends
- 2.1.4 Cooling trends
- 2.1.5 Installation trends
- 2.1.6 Application trends
- 2.1.7 Regional trends
Chapter 3 Industry Insights
- 3.1 Industry ecosystem analysis
- 3.1.1 Raw material suppliers analysis
- 3.1.2 Component manufacturers analysis
- 3.1.3 Enclosure OEMs & integrators
- 3.1.4 EPC contractors & project developers
- 3.1.5 End-users & asset operators
- 3.2 Regulatory landscape
- 3.3 Industry impact forces
- 3.3.1 Growth drivers
- 3.3.2 Industry pitfalls & challenges
- 3.4 Growth potential analysis
- 3.5 Porter's analysis
- 3.5.1 Bargaining power of suppliers
- 3.5.2 Bargaining power of buyers
- 3.5.3 Threat of new entrants
- 3.5.4 Threat of substitutes
- 3.6 PESTEL analysis
- 3.6.1 Political factors
- 3.6.2 Economic factors
- 3.6.3 Social factors
- 3.6.4 Technological factors
- 3.6.5 Legal factors
- 3.6.6 Environmental factors
- 3.7 Investment & funding analysis
- 3.7.1 Capital investment trends in small-scale LNG infrastructure
- 3.7.2 Government grants & subsidies
- 3.8 Trade Data Analysis (Driven by Primary Research)
- 3.8.1 Import/export analysis
- 3.8.2 Key trade corridors & tariff impact
- 3.9 Impact of AI & Generative AI on the market
- 3.9.1 AI-Driven disruption of existing business models
- 3.9.2 GenAI use cases & adoption roadmap
- 3.9.3 Risks, limitations & regulatory considerations
- 3.10 Sustainability initiatives & industry 4.0 integration
- 3.11 Investment & funding analysis
Chapter 4 Competitive Landscape, 2026
- 4.1 Introduction
- 4.2 Company market share analysis, by region, 2025
- 4.2.1 North America
- 4.2.2 Europe
- 4.2.3 Asia Pacific
- 4.2.4 Middle East & Africa
- 4.2.5 Latin America
- 4.3 Key developments
- 4.3.1 Key partnerships & collaborations
- 4.3.2 Major M&A activities
- 4.3.3 Product innovations & launches
- 4.3.4 Market expansion strategies
- 4.4 Competitive positioning matrix
- 4.4.1 Tier classification criteria & qualifying thresholds
- 4.4.2 Tier positioning matrix by revenue, geography & innovation
Chapter 5 Market Size and Forecast, By Product, 2022 - 2035 (USD Million)
- 5.1 Key trends
- 5.2 Containerized BESS
- 5.3 Cabinet & Rack
- 5.4 Mobile & Trailer-Mounted
Chapter 6 Market Size and Forecast, By Container Size, 2022 - 2035 (USD Million)
- 6.1 Key trends
- 6.2 40 ft
- 6.3 20 ft
- 6.4 10 ft
- 6.5 Custom/Non-Standard
Chapter 7 Market Size and Forecast, By Cooling, 2022 - 2035 (USD Million)
- 7.1 Key trends
- 7.2 Air Cooling
- 7.3 Liquid Cooling
- 7.4 Hybrid Cooling
- 7.5 PCM Cooling
Chapter 8 Market Size and Forecast, By Installation, 2022 - 2035 (USD Million)
- 8.1 Key trends
- 8.2 Indoor
- 8.3 Outdoor
- 8.4 Offshore/Marine
Chapter 9 Market Size and Forecast, By Application, 2022 - 2035 (USD Million)
- 9.1 Key trends
- 9.2 Utility Scale
- 9.3 Renewable Energy Integration
- 9.4 Commercial & Industrial (C&I)
- 9.5 Data Centers
- 9.6 EV Charging Infrastructure
- 9.7 Military & Defense
- 9.8 Residential
- 9.9 Healthcare & Hospitals
- 9.10 Others
Chapter 10 Market Size and Forecast, By Region, 2022 - 2035 (USD Million)
- 10.1 Key trends
- 10.2 North America
- 10.2.1 U.S.
- 10.2.2 Canada
- 10.2.3 Mexico
- 10.3 Europe
- 10.3.1 UK
- 10.3.2 Germany
- 10.3.3 France
- 10.3.4 Spain
- 10.3.5 Russia
- 10.3.6 Italy
- 10.4 Asia Pacific
- 10.4.1 China
- 10.4.2 Japan
- 10.4.3 South Korea
- 10.4.4 India
- 10.4.5 Australia
- 10.5 Middle East & Africa
- 10.5.1 UAE
- 10.5.2 Saudi Arabia
- 10.5.3 South Africa
- 10.5.4 Egypt
- 10.6 Latin America
- 10.6.1 Brazil
- 10.6.2 Chile
- 10.6.3 Argentina
Chapter 11 Company Profiles
- 11.1 AlphaESS
- 11.2 BYD
- 11.3 CATL
- 11.4 Canadian Solar
- 11.5 Eaton
- 11.6 Fluence Energy
- 11.7 Gotion High-tech
- 11.8 Hithium Energy Storage Technology
- 11.9 Hitachi Energy
- 11.10 Honeywell International
- 11.11 Hyperstrong Energy Technology
- 11.12 Huawei Digital Power
- 11.13 Powin
- 11.14 Sungrow Power
- 11.15 Samsung SDI
- 11.16 Schneider Electric
- 11.17 Saft
- 11.18 Tesla Energy
- 11.19 TLS Energy
- 11.20 Voltra Energy
- 11.21 Wartsila Energy

