PUBLISHER: Global Market Insights Inc. | PRODUCT CODE: 2071229

PUBLISHER: Global Market Insights Inc. | PRODUCT CODE: 2071229
Asia Pacific Refurbished Laptop Market Opportunity, Growth Drivers, Industry Trend Analysis, and Forecast 2026 - 2035
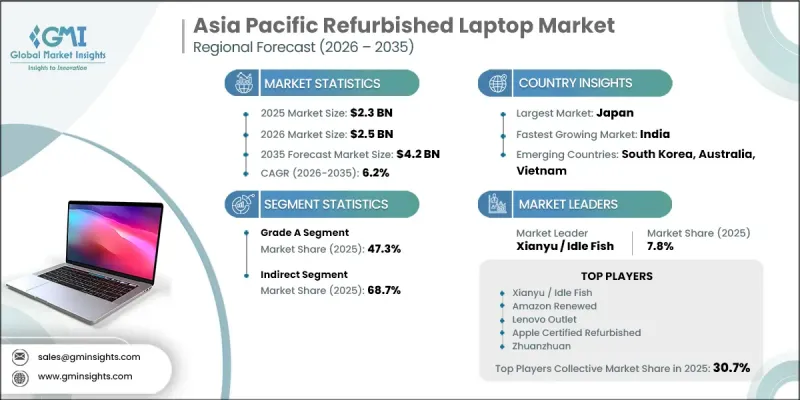
Asia Pacific Refurbished Laptop Market was valued at USD 2.3 billion in 2025 and is estimated to grow at a CAGR of 6.2% to reach USD 4.2 billion by 2035.
The market continues to experience steady growth as organizations, educational institutions, and individual consumers increasingly seek affordable computing alternatives without compromising functionality. Expansion across the region is being supported by stricter electronic waste management regulations, increasing maturity of certified refurbishment ecosystems, and a growing volume of pre-owned devices entering formal resale channels. Demand remains widespread across multiple end-user categories, ranging from budget-conscious consumers to large-scale institutional buyers pursuing cost efficiency and sustainability objectives. The market also benefits from rising awareness of circular economy practices and growing acceptance of refurbished technology products as reliable alternatives to new devices. Across several Asia Pacific countries, the significant cost advantage offered by refurbished laptops continues to attract students, first-time buyers, small businesses, and professional users. Furthermore, growing digitalization, increasing internet penetration, and expanding access to online retail channels are creating favorable conditions for market expansion. As quality standards and certification programs continue to improve, consumer confidence in refurbished devices is strengthening, supporting long-term growth across the Asia Pacific Refurbished Laptop Market.
| Market Scope | |
|---|---|
| Start Year | 2025 |
| Forecast Year | 2026-2035 |
| Start Value | $2.3 Billion |
| Forecast Value | $4.2 Billion |
| CAGR | 6.2% |
The Grade A segment accounted for 47.3% share in 2025. Strong growth is being driven by improvements in product quality and the increasing availability of devices sourced through organized replacement programs, corporate device upgrades, and certified refurbishment channels. Consumers are demonstrating a greater willingness to invest in premium refurbished products that closely resemble new devices in terms of appearance, performance, and reliability. Enhanced testing procedures, comprehensive restoration processes, and extended warranty coverage are further contributing to the attractiveness of Grade A products. As consumer confidence continues to increase, demand for higher-quality refurbished laptops is expected to remain strong throughout the forecast period.
The indirect sales channel generated 68.7% share in 2025 and is projected to grow at a CAGR of 6% during 2026-2035. This segment maintains a dominant position due to the widespread influence of online marketplaces, third-party retailers, and digital commerce platforms across the Asia Pacific region. The channel's strength is largely attributed to its ability to offer extensive product availability and a broad range of specifications from multiple suppliers within a single purchasing environment. Consumers increasingly favor indirect channels because they provide greater convenience, competitive pricing, and access to diverse product options. Continued growth in e-commerce adoption, improvements in logistics infrastructure, and increasing trust in certified refurbished products are expected to further strengthen the position of indirect distribution networks within the market.
Japan Refurbished Laptop Market held a 21% share in 2025. The country's leadership is supported by a well-developed refurbishment ecosystem that includes both manufacturer-operated programs and specialized refurbishment providers. Strong consumer awareness regarding sustainable technology consumption, combined with established trade-in and device recovery systems, has created a stable supply of refurbished laptops for resale. In addition, the availability of physical retail locations offering product inspection, technical verification, and customer support continues to reinforce buyer confidence. These factors, together with a mature consumer electronics market and high digital adoption rates, are expected to sustain Japan's leading position throughout the forecast period.
Key companies operating in the Asia Pacific Refurbished Laptop Market include Amazon Renewed, Apple Certified Refurbished, Back Market, Budli, Cashify, Dell Outlet, Hard-Off, HP Renew, Janpara, Lenovo Outlet, Loyal Laptop Indonesia, Microsoft Certified Refurbished, ReBuy India, Reebelo, Refurbo.in, Revibe.me, SCE Distributor, Saverbro, Togofogo, Xianyu / Idle Fish, and Zhuanzhuan. Participants in the Asia Pacific Refurbished Laptop Market are focusing on multiple strategic initiatives to strengthen their market position and expand customer reach. Companies are investing in advanced refurbishment processes, stringent quality-control standards, and certification programs to enhance consumer trust and product reliability. Expanding warranty coverage and after-sales support services remains a key priority for improving customer confidence and encouraging repeat purchases. Market players are also strengthening partnerships with enterprises, educational institutions, and technology providers to secure a consistent supply of pre-owned devices.
Table of Contents
Chapter 1 Methodology & Scope
- 1.1 Research approach
- 1.2 Quality Commitments
- 1.2.1 GMI AI policy & data integrity commitment
- 1.2.1.1 Source consistency protocol
- 1.2.1 GMI AI policy & data integrity commitment
- 1.3 Research Trail & Confidence Scoring
- 1.3.1 Research Trail Components
- 1.3.2 Scoring Components
- 1.4 Data Collection
- 1.4.1 Partial list of primary sources
- 1.5 Data mining sources
- 1.5.1 Paid sources
- 1.5.1.1 Sources, by region
- 1.5.1 Paid sources
- 1.6 Base estimates and calculations
- 1.6.1 Base year calculation for any one approach
- 1.7 Forecast model
- 1.7.1 Quantified market impact analysis
- 1.7.1.1 Mathematical impact of growth parameters on forecast
- 1.7.1 Quantified market impact analysis
- 1.8 Research transparency addendum
- 1.8.1 Source attribution framework
- 1.8.2 Quality assurance metrics
- 1.8.2.1 Our commitment to trust
Chapter 2 Executive Summary
- 2.1 Industry 360° synopsis, 2022 - 2035
- 2.2 Key market trends
- 2.2.1 Country
- 2.2.2 Grade
- 2.2.3 Operating System
- 2.2.4 Screen Size
- 2.2.5 End use
- 2.2.6 Distribution Channel
Chapter 3 Industry Insights
- 3.1 Industry ecosystem analysis
- 3.1.1 Supplier landscape
- 3.1.2 Profit margin
- 3.1.3 Value addition at each stage
- 3.1.4 Factor affecting the value chain
- 3.2 Industry impact forces
- 3.2.1 Growth drivers
- 3.2.1.1 Price sensitivity & affordability demand
- 3.2.1.2 SMB & education sector expansion
- 3.2.1.3 E-waste regulation tightening
- 3.2.1.4 Rising OEM program penetration
- 3.2.2 Industry pitfalls & challenges
- 3.2.2.1 Fragmented & unregulated gray market
- 3.2.2.2 Rapid technology obsolescence in premium segments
- 3.2.3 Opportunities
- 3.2.3.1 India as high-growth B2B expansion hub
- 3.2.3.2 Southeast Asia last-mile channel buildout
- 3.2.1 Growth drivers
- 3.3 Growth potential analysis
- 3.4 Regulatory framework
- 3.4.1 Standards & compliance requirements
- 3.4.2 Regional regulatory frameworks
- 3.4.3 Certification standards
- 3.5 Major market trends and disruptions
- 3.6 Technology/innovation landscape
- 3.6.1 Current trends
- 3.6.2 Emerging trends
- 3.7 Pricing Analysis (driven by primary research)
- 3.7.1 Historical price trend analysis (driven by primary research)
- 3.7.2 Pricing strategy by player type (premium / value / cost- plus) (driven by primary research)
- 3.8 Future market trends
- 3.9 Trade data analysis (driven by paid database) (HS Code-847130)
- 3.9.1 Import/export volume & value trends (driven by primary research)
- 3.9.2 Key trade corridors & tariff impact (driven by primary research)
- 3.10 Impact of AI & Generative AI on the Market
- 3.10.1 AI- driven disruption of existing business models
- 3.10.2 Gen- AI use cases & adoption roadmap by segment
- 3.10.3 Risks, limitations & regulatory considerations
- 3.11 Porter's analysis
- 3.12 PESTEL analysis
- 3.13 Distribution infrastructure & channel penetration landscape (driven by primary research)
- 3.13.1 Channel coverage by country & format (modern vs. Traditional trade) (driven by primary research)
- 3.13.2 Last- mile infrastructure gaps & emerging channel shifts (driven by primary research)
- 3.14 Consumer behavior analysis
- 3.14.1 Purchasing patterns
- 3.14.2 Preference analysis
- 3.14.3 Regional variations in consumer behavior
- 3.14.4 Impact of e- commerce on buying decisions
Chapter 4 Competitive Landscape, 2025
- 4.1 Introduction
- 4.2 Company market share analysis
- 4.2.1 By Country
- 4.2.1.1 China
- 4.2.1.2 Japan
- 4.2.1.3 India
- 4.2.1.4 Australia
- 4.2.1.5 South Korea
- 4.2.1.6 Indonesia
- 4.2.1.7 Taiwan
- 4.2.1.8 Singapore
- 4.2.1.9 Rest of APAC
- 4.2.1 By Country
- 4.3 Company matrix analysis
- 4.4 Competitive analysis of major market players
- 4.5 Competitive positioning matrix
- 4.6 Key developments
- 4.6.1 Mergers & acquisitions
- 4.6.2 Partnerships & collaborations
- 4.6.3 New product launches
- 4.6.4 Expansion plans
Chapter 5 Market Estimates & Forecast, By Grade, 2022 - 2035, (USD Billion) (Thousand Units)
- 5.1 Key trends
- 5.2 Grade A
- 5.3 Grade B
- 5.4 Grade C
- 5.5 Grade D
Chapter 6 Market Estimates & Forecast, By Operating System, 2022 - 2035, (USD Billion) (Thousand Units)
- 6.1 Key trends
- 6.2 Windows refurbished laptops
- 6.3 Mac refurbished laptops
- 6.4 Others
Chapter 7 Market Estimates & Forecast, By Screen Size, 2022 - 2035, (USD Billion) (Thousand Units)
- 7.1 Key trends
- 7.2 11-13 inches
- 7.3 14-16 inches
- 7.4 17 inches and above
Chapter 8 Market Estimates & Forecast, By End Use, 2022 - 2035, (USD Billion) (Thousand Units)
- 8.1 Key trends
- 8.2 Individual consumers
- 8.3 Businesses
- 8.4 Others
Chapter 9 Market Estimates & Forecast, By Distribution Channel, 2022 - 2035, (USD Billion) (Thousand Units)
- 9.1 Key trends
- 9.2 Direct
- 9.3 Indirect
Chapter 10 Market Estimates & Forecast, By Country, 2022 - 2035, (USD Billion) (Thousand Units)
- 10.1 Key trends
- 10.2 China
- 10.3 Japan
- 10.4 India
- 10.5 Australia
- 10.6 South Korea
- 10.7 Indonesia
- 10.8 Taiwan
- 10.9 Singapore
- 10.10 Rest of APAC
Chapter 11 Company Profiles
- 11.1 Global Companies
- 11.1.1 Amazon Renewed
- 11.1.1.1 Business Overview
- 11.1.1.2 Financial Data
- 11.1.1.3 Product Landscape
- 11.1.1.4 Strategic Outlook
- 11.1.1.5 SWOT Analysis
- 11.1.2 Apple Certified Refurbished
- 11.1.3 Back Market
- 11.1.4 Dell
- 11.1.5 HP Renew
- 11.1.6 Lenovo Outlet
- 11.1.7 Microsoft Certified Refurbished
- 11.1.1 Amazon Renewed
- 11.2 Regional Champions
- 11.2.1 Budli
- 11.2.2 Cashify
- 11.2.3 Hard-Off
- 11.2.4 Janpara
- 11.2.5 Reebelo
- 11.2.6 Xianyu / Idle Fish
- 11.2.7 Zhuanzhuan
- 11.3 Emerging Players
- 11.3.1 Loyal Laptop Indonesia
- 11.3.2 ReBuy India
- 11.3.3 Refurbo.in
- 11.3.4 Revibe.me
- 11.3.5 SCE Distributor
- 11.3.6 Saverbro
- 11.3.7 Togofogo

