PUBLISHER: Global Market Insights Inc. | PRODUCT CODE: 2071305

PUBLISHER: Global Market Insights Inc. | PRODUCT CODE: 2071305
Knowledge Graph Market Opportunity, Growth Drivers, Industry Trend Analysis, and Forecast 2026 - 2035
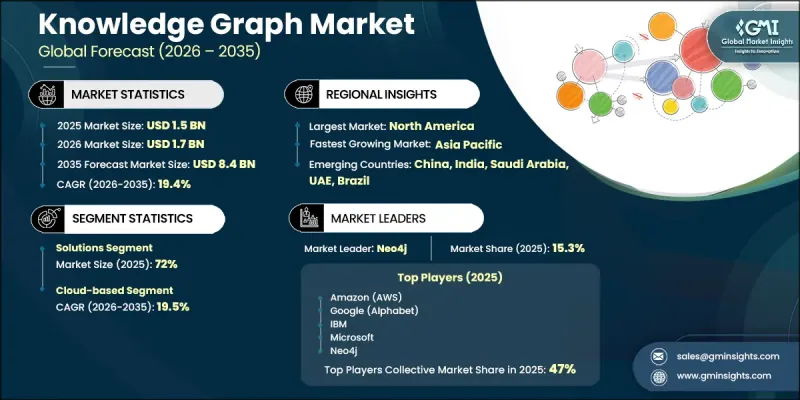
The Global Knowledge Graph Market was valued at USD 1.5 billion in 2025 and is estimated to grow at a CAGR of 19.4% to reach USD 8.4 billion by 2035.
Market expansion is influenced by the rapid enterprise-wide adoption of generative AI, which has significantly increased demand for structured, context-rich data management tools. Conventional large language models are often limited by challenges related to factual accuracy, domain specialization, and explainability, which has accelerated the shift toward knowledge graph-enabled systems. A key development shaping the industry is the rising adoption of GraphRAG-based architectures that merge knowledge graphs with large language models. These frameworks enhance reasoning accuracy by combining vector-based similarity retrieval with graph-based traversal, allowing AI systems to interpret relationships across interconnected data entities rather than isolated inputs. The core enterprise requirement driving adoption is the need for transparent, auditable, and explainable AI outputs at scale, particularly in environments where organizational, regulatory, and operational data structures are highly complex. At the same time, organizations are generating rapidly expanding volumes of structured and unstructured data from digital interactions, internal systems, and connected devices, making traditional data management approaches insufficient for relationship mapping and semantic understanding.
| Market Scope | |
|---|---|
| Start Year | 2025 |
| Forecast Year | 2026-2035 |
| Start Value | $1.5 Billion |
| Forecast Value | $8.4 Billion |
| CAGR | 19.4% |
The solutions segment held a 72% share in 2025 and is expected to grow at a CAGR of 18.6% through 2035. This segment leads due to increasing enterprise demand for platforms that enable structuring, linking, and analyzing complex and interconnected datasets. Organizations are widely deploying knowledge graph solutions to enhance semantic search, improve data integration, support business intelligence, and strengthen AI-driven decision-making capabilities. Rising adoption of GraphRAG frameworks, enterprise AI systems, and semantic data infrastructures is further reinforcing demand. The solutions category includes enterprise knowledge graph platforms, graph databases, visualization tools, and advanced graph analytics systems that collectively support scalable data intelligence operations.
The large enterprises segment accounted for 73.2% share in 2025 and is projected to grow at a CAGR of 18.6% through 2035. Large organizations remain the primary adopters due to their complex data ecosystems and significant investments in digital transformation and artificial intelligence technologies. These enterprises are increasingly implementing knowledge graph systems to unify data sources, enhance enterprise search capabilities, improve customer insights, and support cross-functional decision-making. Adoption of GraphRAG architectures and other advanced AI frameworks is particularly strong among large firms, driven by the need for highly structured and scalable knowledge management systems that support enterprise-wide intelligence operations.
U.S. Knowledge Graph Market was valued at USD 526.5 million in 2025 and is projected to grow at a CAGR of 18.1% through 2035. The country leads global adoption due to strong investments in artificial intelligence, cloud computing, and advanced analytics platforms. Knowledge graphs integrated with large language models through GraphRAG-based systems are increasingly used to improve contextual understanding, accuracy, and explainability of enterprise AI outputs. Adoption is expanding across financial services, healthcare, retail, and public sector organizations, where applications include intelligent search, fraud detection, and enterprise knowledge management. Growing reliance on data-driven decision-making continues to accelerate market penetration, supported by ongoing AI innovation and enterprise digitalization efforts.
Major players operating in the global knowledge graph market include IBM, Microsoft, Amazon Web Services (AWS), Google (Alphabet), Oracle, SAP, Neo4j, Ontotext, Stardog, and TigerGraph. Companies in the knowledge graph market are strengthening their competitive positioning through continuous innovation in graph-based AI architectures that enhance semantic understanding and reasoning capabilities. They are increasingly integrating knowledge graph platforms with large language models to support advanced GraphRAG frameworks that improve factual accuracy and contextual intelligence. Cloud-native deployment strategies are being prioritized to enable scalable and flexible enterprise adoption across industries. Vendors are also investing in automation-driven data integration tools that simplify ingestion from diverse structured and unstructured sources. Strategic partnerships with AI developers and cloud service providers are expanding ecosystem reach and accelerating solution deployment. In addition, companies are focusing on enhancing interoperability with existing enterprise systems to reduce integration complexity.
Table of Contents
Chapter 1 Methodology
- 1.1 Research approach
- 1.2 Quality Commitments
- 1.2.1 GMI AI policy & data integrity commitment
- 1.2.1.1 Source consistency protocol
- 1.2.1 GMI AI policy & data integrity commitment
- 1.3 Research Trail & Confidence Scoring
- 1.3.1 Research Trail Components
- 1.3.2 Scoring Components
- 1.4 Data Collection
- 1.4.1 Partial list of primary sources
- 1.5 Data mining sources
- 1.5.1 Paid sources
- 1.5.1.1 Sources, by region
- 1.5.1 Paid sources
- 1.6 Base estimates and calculations
- 1.6.1 Base year calculation
- 1.7 Forecast model
- 1.7.1 Quantified market impact analysis
- 1.7.1.1 Mathematical impact of growth parameters on forecast
- 1.7.1 Quantified market impact analysis
- 1.8 Research transparency addendum
- 1.8.1 Source attribution framework
- 1.8.2 Quality assurance metrics
- 1.8.3 Our commitment to trust
Chapter 2 Executive Summary
- 2.1 Industry 360° synopsis
- 2.2 Key market trends
- 2.2.1 Regional
- 2.2.2 Offering
- 2.2.3 Model type
- 2.2.4 Deployment model
- 2.2.5 Application
- 2.2.6 Organization size
- 2.2.7 End use
- 2.3 TAM analysis, 2026-2035
- 2.4 CXO perspectives: Strategic imperatives
Chapter 3 Industry Insights
- 3.1 Industry ecosystem analysis
- 3.1.1 Supplier landscape
- 3.1.2 Profit margin
- 3.1.3 Cost structure
- 3.1.4 Value addition at each stage
- 3.1.5 Factor affecting the value chain
- 3.1.6 Disruptions
- 3.2 Industry impact forces
- 3.2.1 Growth drivers
- 3.2.1.1 Enterprise AI driving GraphRAG adoption
- 3.2.1.2 Rising unstructured interconnected data explosion
- 3.2.1.3 Need for explainable AI decisions
- 3.2.1.4 Expansion of semantic data architectures
- 3.2.2 Industry pitfalls and challenges
- 3.2.2.1 High implementation cost and complexity
- 3.2.2.2 Shortage of skilled graph professionals
- 3.2.3 Market opportunities
- 3.2.3.1 GraphRAG integration with enterprise LLMs
- 3.2.3.2 Growth of KGaaS for SMEs
- 3.2.3.3 Industry-specific knowledge graph solutions
- 3.2.3.4 Real-time streaming knowledge graphs adoption
- 3.2.1 Growth drivers
- 3.3 Growth potential analysis
- 3.4 Technology and innovation landscape
- 3.4.1 Current technological trends
- 3.4.2 Emerging technologies
- 3.5 Cost breakdown analysis
- 3.6 Regulatory landscape
- 3.6.1 North America
- 3.6.1.1 National Institute of Standards and Technology (U.S.)
- 3.6.1.2 Artificial Intelligence and Data Act (Canada)
- 3.6.2 Europe
- 3.6.2.1 General Data Protection Regulation (Germany)
- 3.6.2.2 Italian Data Protection Authority (Italy)
- 3.6.3 Asia Pacific
- 3.6.3.1 Personal Information Protection Law (China)
- 3.6.3.2 Digital Personal Data Protection Act (India)
- 3.6.4 Latin America
- 3.6.4.1 General Data Protection Law (Brazil)
- 3.6.4.2 National Digital Strategy (Mexico)
- 3.6.5 Middle East & Africa
- 3.6.5.1 UAE Personal Data Protection Law (Dubai)
- 3.6.5.2 Personal Data Protection Law (Saudi Arabia)
- 3.6.1 North America
- 3.7 Porter's analysis
- 3.8 PESTEL analysis
- 3.9 Patent analysis (Driven by primary research)
- 3.10 Impact of AI & Generative AI on the Market
- 3.10.1 AI-driven disruption of existing business models
- 3.10.2 Gen AI use cases & adoption roadmap by segment
- 3.10.3 Risks, limitations & regulatory considerations
- 3.11 Sustainability and environmental aspects
- 3.11.1 Sustainable practices
- 3.11.2 Waste reduction strategies
- 3.11.3 Energy efficiency in production
- 3.11.4 Eco-friendly initiatives
- 3.11.5 Carbon footprint considerations
- 3.12 Forecast assumptions & scenario analysis (Driven by primary research)
- 3.12.1 Base Case - key macro & industry variables driving CAGR
- 3.12.2 Optimistic Scenarios - Favorable macro and industry tailwinds
- 3.12.3 Pessimistic Scenario - Macroeconomic slowdown or industry headwinds
Chapter 4 Competitive Landscape, 2025
- 4.1 Introduction
- 4.2 Company market share analysis
- 4.2.1 North America
- 4.2.2 Europe
- 4.2.3 Asia Pacific
- 4.2.4 LATAM
- 4.2.5 MEA
- 4.3 Competitive analysis of major market players
- 4.4 Competitive positioning matrix
- 4.5 Key developments
- 4.5.1 Mergers & acquisitions
- 4.5.2 Partnerships & collaborations
- 4.5.3 New product launches
- 4.5.4 Expansion plans and funding
- 4.6 4.6 Company tier benchmarking
- 4.6.1 Tier classification criteria & qualifying thresholds
- 4.6.2 Tier positioning matrix by revenue, geography & innovation
Chapter 5 Market Estimates & Forecast, By Offering, 2022 - 2035 ($Mn)
- 5.1 Key trends
- 5.2 Solutions
- 5.2.1 Enterprise knowledge graph platforms
- 5.2.2 Graph database engines
- 5.2.3 Knowledge management toolsets
- 5.2.4 Graph visualization & exploration tools
- 5.2.5 Graph analytics & querying tools
- 5.3 Services
- 5.3.1 Professional services
- 5.3.2 Managed services
Chapter 6 Market Estimates & Forecast, By Model Type, 2022 - 2035 ($Mn)
- 6.1 Key trends
- 6.2 Labeled Property Graph (LPG)
- 6.3 RDF / Triple Store
- 6.4 Ontology-Based / OWL
Chapter 7 Market Estimates & Forecast, By Deployment Model, 2022 - 2035 ($Mn)
- 7.1 Key trends
- 7.2 Cloud-based
- 7.3 On-premises
- 7.4 Hybrid
Chapter 8 Market Estimates & Forecast, By Application, 2022 - 2035 ($Mn)
- 8.1 Key trends
- 8.2 Semantic search & information retrieval
- 8.3 Fraud detection & risk management
- 8.4 Recommendation systems
- 8.5 Data analytics & business intelligence
- 8.6 Data governance & master data management (MDM)
- 8.7 Virtual assistants & question answering systems
- 8.8 Others
Chapter 9 Market Estimates & Forecast, By Organization Size, 2022 - 2035 ($Mn)
- 9.1 Key trends
- 9.2 Large enterprises
- 9.3 Small & medium enterprises (SMEs)
Chapter 10 Market Estimates & Forecast, By End Use, 2022 - 2035 ($Mn)
- 10.1 Key trends
- 10.2 BFSI
- 10.3 Healthcare & Life Sciences
- 10.4 Government & public sector
- 10.5 IT & telecommunications
- 10.6 Media & entertainment
- 10.7 Manufacturing
- 10.8 Others
Chapter 11 Market Estimates & Forecast, By Region, 2022 - 2035 ($Mn)
- 11.1 Key trends
- 11.2 North America
- 11.2.1 U.S.
- 11.2.2 Canada
- 11.3 Europe
- 11.3.1 Germany
- 11.3.2 UK
- 11.3.3 France
- 11.3.4 Italy
- 11.3.5 Spain
- 11.3.6 Sweden
- 11.3.7 Switzerland
- 11.3.8 Netherlands
- 11.4 Asia Pacific
- 11.4.1 China
- 11.4.2 India
- 11.4.3 Japan
- 11.4.4 South Korea
- 11.4.5 Australia
- 11.4.6 Singapore
- 11.4.7 Malaysia
- 11.4.8 Indonesia
- 11.4.9 Thailand
- 11.5 LATAM
- 11.5.1 Brazil
- 11.5.2 Mexico
- 11.5.3 Argentina
- 11.6 MEA
- 11.6.1 UAE
- 11.6.2 South Africa
- 11.6.3 Saudi Arabia
Chapter 12 Company Profiles
- 12.1 Global players
- 12.1.1 Amazon Web Services (AWS)
- 12.1.2 Google (Alphabet)
- 12.1.3 IBM
- 12.1.4 Microsoft
- 12.1.5 Neo4j
- 12.1.6 Ontotext
- 12.1.7 Oracle
- 12.1.8 Stardog
- 12.1.9 TigerGraph
- 12.2 Regional players
- 12.2.1 ArangoDB
- 12.2.2 Baidu
- 12.2.3 eccenca
- 12.2.4 Graphwise
- 12.2.5 Metaphacts
- 12.2.6 SAP
- 12.2.7 Tencent
- 12.3 Emerging players
- 12.3.1 Diffbot
- 12.3.2 Fluree PBC
- 12.3.3 Memgraph
- 12.3.4 RelationalAI

