PUBLISHER: Global Market Insights Inc. | PRODUCT CODE: 2083107

PUBLISHER: Global Market Insights Inc. | PRODUCT CODE: 2083107
Digital Product Passport (DPP) for Food Market Opportunity, Growth Drivers, Industry Trend Analysis, and Forecast 2026 - 2035
The Global Digital Product Passport (DPP) for Food Market was valued at USD 40 million in 2025 and is estimated to grow at a CAGR of 36.1% to reach USD 1.1 billion by 2035.
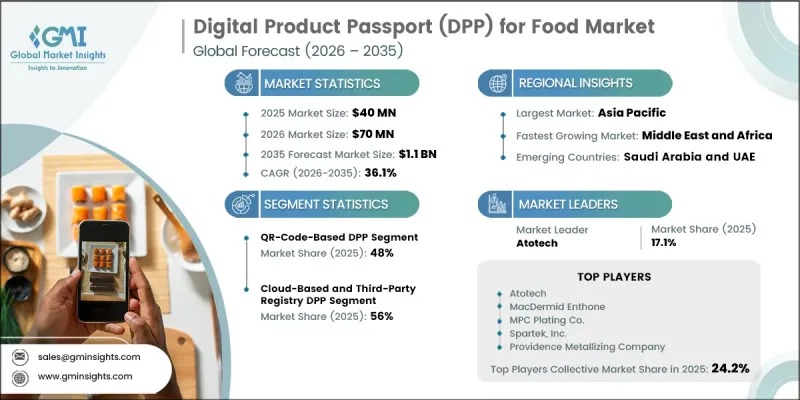
The strong growth trajectory highlights a fundamental transformation in the way food products are documented, monitored, and disclosed throughout their entire lifecycle. Organizations across the food value chain are increasingly investing in digital systems that provide comprehensive visibility from raw material sourcing and manufacturing to logistics, retail distribution, consumption, and disposal. Growing regulatory oversight, rising expectations for supply chain transparency, and accelerating digital transformation initiatives are creating substantial demand for Digital Product Passport solutions. Regulatory authorities across major economies are progressively requiring structured and machine-readable product information to support compliance, sustainability reporting, and traceability objectives. As a result, food manufacturers, processors, distributors, and retailers are treating digital product data as a strategic operational asset. Increasing emphasis on lifecycle accountability, environmental disclosure requirements, and data-driven supply chain management continues to reinforce market expansion while encouraging long-term investments in scalable Digital Product Passport infrastructure across the global food industry.
| Market Scope | |
|---|---|
| Start Year | 2025 |
| Forecast Year | 2026-2035 |
| Start Value | $40 Million |
| Forecast Value | $1.1 Billion |
| CAGR | 36.1% |
Regulatory developments remain one of the most influential drivers supporting the expansion of the Digital Product Passport for Food Market. New compliance frameworks are encouraging food companies to maintain comprehensive digital records that improve transparency across sourcing, production, transportation, and distribution activities. Digital Product Passports are increasingly being utilized to communicate traceability information, sustainability indicators, and product lifecycle data among supply chain participants, regulatory bodies, commercial buyers, and consumers. Food manufacturers serving international markets are investing in structured digital information systems that capture critical product attributes, including ingredient provenance, environmental performance metrics, and waste management indicators. These evolving requirements are making advanced traceability capabilities an essential component of market participation and long-term regulatory compliance.
The cloud-based and externally managed segment held a 56% share in 2025. Their strong market presence reflects the growing preference among food companies for flexible deployment models that minimize capital investment requirements and simplify implementation across complex supplier ecosystems. These solutions enable faster integration of supply chain partners, streamline data management processes, and support continuous compliance with evolving regulatory requirements. The scalability, accessibility, and interoperability offered by cloud-enabled platforms continue to strengthen adoption among organizations seeking efficient methods to manage large volumes of traceability and sustainability data while improving operational efficiency.
North America Digital Product Passport (DPP) for Food Market accounted for 18% share in 2025 and is projected to record a CAGR of 37% throughout 2035. Regulatory initiatives focused on food traceability and electronic recordkeeping have accelerated investments in digital tracking technologies across the region. Food manufacturers are increasingly implementing systems capable of capturing and maintaining detailed supply chain data at every stage of product movement. The emphasis on improved food safety, transparency, compliance management, and supply chain visibility continues to create favorable conditions for market growth. In addition, regional efforts to align food traceability practices with internationally recognized standards are encouraging broader adoption of Digital Product Passport solutions across food processing and manufacturing operations.
Key companies operating in the Global Digital Product Passport (DPP) for Food Market include SAP SE, Siemens AG, Det Norske Veritas Group, OPTEL GROUP, Avery Dennison Corporation, Billon Group, Narravero, Clarifresh, MULTIVAC Group, Kezzler AS, Repass, Protokol, and Scantrust. Companies operating in the Digital Product Passport (DPP) for Food Market are focusing on technology innovation, strategic partnerships, platform scalability, and regulatory alignment to strengthen their market position. Many providers are investing in advanced traceability capabilities, data analytics tools, and cloud-based infrastructures that improve transparency across food supply chains. Strategic collaborations with food manufacturers, distributors, retailers, and technology providers are helping companies expand their customer base and accelerate solution deployment. Market participants are also prioritizing interoperability with enterprise software systems to facilitate seamless data exchange across multiple stakeholders.
Table of Contents
Chapter 1 Methodology & Scope
- 1.1 Market scope and definition
- 1.2 Research design
- 1.2.1 Research approach
- 1.2.2 Data collection methods
- 1.3 Data mining sources
- 1.3.1 Global
- 1.3.2 Regional/Country
- 1.4 Base estimates and calculations
- 1.4.1 Base year calculation
- 1.4.2 Key trends for market estimation
- 1.5 Primary research and validation
- 1.5.1 Primary sources
- 1.6 Forecast model
- 1.7 Research assumptions and limitations
Chapter 2 Executive Summary
- 2.1 Industry 360° synopsis
- 2.2 Key market trends
- 2.2.1 Regional
- 2.2.2 Technology
- 2.2.3 Deployment Model
- 2.3 TAM Analysis, 2026-2035
- 2.4 CXO perspectives: Strategic imperatives
- 2.4.1 Executive decision points
- 2.4.2 Critical success factors
- 2.5 Future Outlook and Strategic Recommendations
Chapter 3 Industry Insights
- 3.1 Industry ecosystem analysis
- 3.1.1 Supplier Landscape
- 3.1.2 Profit Margin
- 3.1.3 Value addition at each stage
- 3.1.4 Factor affecting the value chain
- 3.1.5 Disruptions
- 3.2 Industry impact forces
- 3.2.1 Growth drivers
- 3.2.1.1 Stringent EU ESPR mandates driving mandatory DPP adoption
- 3.2.1.2 Rising consumer demand for food transparency & sustainability data
- 3.2.1.3 Corporate ESG & scope 3 reporting requirements
- 3.2.2 Industry pitfalls and challenges
- 3.2.2.1 High implementation costs for SME food manufacturers
- 3.2.2.2 Fragmented data & legacy ERP system integration challenges
- 3.2.3 Market opportunities
- 3.2.3.1 Emerging markets seeking export compliance to EU
- 3.2.3.2 Blockchain-based DPP for premium organic & specialty foods
- 3.2.1 Growth drivers
- 3.3 Growth potential analysis
- 3.4 Regulatory landscape
- 3.4.1 North America
- 3.4.2 Europe
- 3.4.3 Asia Pacific
- 3.4.4 Latin America
- 3.4.5 Middle East & Africa
- 3.5 Porter's analysis
- 3.6 PESTEL analysis
- 3.7 Price trends
- 3.7.1 By region
- 3.7.2 By Technology
- 3.8 Future market trends
- 3.9 Technology and Innovation Landscape
- 3.9.1 Current technological trends
- 3.9.2 Emerging technologies
- 3.10 Patent Landscape
- 3.11 Trade statistics (HS code) (Note: the trade statistics will be provided for key countries only)
- 3.11.1 Major importing countries
- 3.11.2 Major exporting countries
- 3.12 Sustainability and environmental aspects
- 3.12.1 Sustainable practices
- 3.12.2 Waste reduction strategies
- 3.12.3 Energy efficiency in production
- 3.12.4 Eco-friendly initiatives
- 3.13 Carbon footprint considerations
Chapter 4 Competitive Landscape, 2025
- 4.1 Introduction
- 4.2 Company market share analysis
- 4.2.1 By region
- 4.2.1.1 North America
- 4.2.1.2 Europe
- 4.2.1.3 Asia Pacific
- 4.2.1.4 LATAM
- 4.2.1.5 MEA
- 4.2.1 By region
- 4.3 Company matrix analysis
- 4.4 Competitive analysis of major market players
- 4.5 Competitive positioning matrix
- 4.6 Key developments
- 4.6.1 Mergers & acquisitions
- 4.6.2 Partnerships & collaborations
- 4.6.3 New product launches
- 4.6.4 Expansion plans
Chapter 5 Market Estimates and Forecast, By Technology, 2022 - 2035 (USD Million) (Kilo Tons)
- 5.1 Key trends
- 5.2 QR Code-based DPP
- 5.2.1 Static QR codes
- 5.2.2 Dynamic QR codes with GS1 digital link
- 5.3 NFC (Near Field Communication)-based DPP
- 5.3.1 Embedded NFC tags
- 5.3.2 Smart label-integrated NFC
- 5.4 RFID (Radio-Frequency Identification)-based DPP
- 5.4.1 Passive RFID Tags
- 5.4.2 Active RFID Tags
- 5.5 Blockchain-integrated DPP
- 5.5.1 Public blockchain solutions
- 5.5.2 Private/permissioned blockchain solutions
Chapter 6 Market Estimates and Forecast, By Deployment Model, 2022 - 2035 (USD million) (Kilo Tons)
- 6.1 Key trends
- 6.2 Cloud-based/third-party registry DPP
- 6.2.1 Public cloud DPP platforms
- 6.2.2 Private cloud DPP solutions
- 6.3 Self-hosted/On-premise DPP
- 6.3.1 Enterprise data centers
- 6.3.2 Regional data sovereignty hosting
- 6.4 Hybrid model DPP
- 6.4.1 Self-hosted data with third-party resolver
- 6.4.2 Multi-cloud distributed architecture
Chapter 7 Market Estimates and Forecast, By Region, 2022 - 2035 (USD million) (Kilo Tons)
- 7.1 Key trends
- 7.2 North America
- 7.2.1 U.S.
- 7.2.2 Canada
- 7.3 Europe
- 7.3.1 Germany
- 7.3.2 UK
- 7.3.3 France
- 7.3.4 Spain
- 7.3.5 Italy
- 7.3.6 Rest of Europe
- 7.4 Asia Pacific
- 7.4.1 China
- 7.4.2 India
- 7.4.3 Japan
- 7.4.4 Australia
- 7.4.5 South Korea
- 7.4.6 Rest of Asia Pacific
- 7.5 Latin America
- 7.5.1 Brazil
- 7.5.2 Mexico
- 7.5.3 Rest of Latin America
- 7.6 Middle East and Africa
- 7.6.1 Saudi Arabia
- 7.6.2 South Africa
- 7.6.3 UAE
- 7.6.4 Rest of Middle East and Africa
Chapter 8 Company Profiles
- 8.1 Siemens AG
- 8.2 Det Norske Veritas Group
- 8.3 OPTEL GROUP
- 8.4 Avery Dennison Corporation
- 8.5 Billion Group
- 8.6 SAP SE
- 8.7 Narravero
- 8.8 Clarifresh
- 8.9 MULTIVAC Group
- 8.10 Kezzler AS
- 8.11 Repass
- 8.12 Protokol
- 8.13 Scantrust

