PUBLISHER: Global Market Insights Inc. | PRODUCT CODE: 2083136

PUBLISHER: Global Market Insights Inc. | PRODUCT CODE: 2083136
Plasma-Activated Water (PAW) for Fertilization Market Opportunity, Growth Drivers, Industry Trend Analysis, and Forecast 2026 - 2035
The Global Plasma-Activated Water for Fertilization Market was valued at USD 24.5 million in 2025 and is estimated to grow at a CAGR of 36.2% to reach USD 559.3 million by 2035.
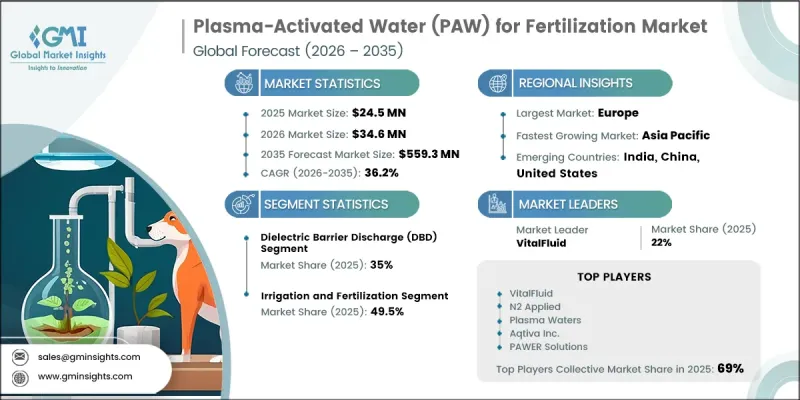
The plasma-activated water for fertilization market is witnessing rapid expansion as agriculture increasingly shifts toward low-carbon, resource-efficient, and precision nutrient delivery systems. The technology is gaining attention because it produces plant-available nitrogen compounds such as nitrate (NO2) and nitrite (NO2) using non-thermal plasma reactions that operate at atmospheric pressure, reducing reliance on conventional nitrogen production methods. This transition aligns with broader decarbonization goals in agricultural inputs and supports sustainability-focused farming practices. Rising adoption of controlled environment agriculture, including greenhouse cultivation, hydroponic production, and vertical farming systems, is further accelerating demand for precision fertilization solutions that ensure consistent nutrient delivery and improved resource efficiency. The growing need for traceable, residue-free agricultural inputs is also reinforcing the adoption of plasma-activated water systems, particularly in high-value crop production. At the same time, increasing concerns related to water scarcity, soil degradation, and fertilizer cost volatility are encouraging growers to explore alternative nutrient generation methods. Technological advancements in plasma generation systems and integration with modern irrigation infrastructure are expected to further strengthen market expansion across global agricultural applications.
| Market Scope | |
|---|---|
| Start Year | 2025 |
| Forecast Year | 2026-2035 |
| Start Value | $24.5 Million |
| Forecast Value | $559.3 Million |
| CAGR | 36.2% |
In 2025, the dielectric barrier discharge (DBD) systems segment accounted for 35% share, holding the largest share among technology categories. This segment leads due to its stable operating performance, scalable system design, and extensive validation in agricultural applications. DBD-based plasma systems generate non-thermal discharge through dielectric layers placed between electrodes, enabling efficient formation of reactive nitrogen and oxygen species that dissolve into water to create plant-available nutrient solutions. Its proven reliability and adaptability across different agricultural setups continue to support its dominant position.
The irrigation and fertilization segment held a 49.5% share in 2025. This dominance is driven by the seamless integration of plasma-activated water into existing irrigation systems, enabling growers to enhance or replace conventional nitrogen inputs without significant changes to agricultural practices. The compatibility with drip, sprinkler, and recirculating fertigation systems supports widespread adoption across controlled and open-field farming environments, making it a key driver of market demand.
North America Plasma-Activated Water for Fertilization Market accounted for 35% share in 2025, supported by Canada's expanding greenhouse horticulture sector in regions such as Ontario and British Columbia. The U.S. market is evolving through both research-led initiatives focused on sustainable crop production and commercial adoption in high-value agricultural segments where precision nutrient delivery and residue-free cultivation are increasingly prioritized. Growing investment in advanced agricultural technologies and controlled environment farming continues to support regional market expansion.
Major companies operating in the global plasma-activated water for fertilization industry include VitalFluid, N2 Applied, Plasma Waters, Aqtiva Inc., PAWER Solutions, HydroPlasma.Tech, cNTP AgriTech, Plasma Systems, Redhill Scientific, Greenpath Industries, Global Enviro, WIADAP Plasma Tech, US Plasma Engineering, AJ Plasmatech, and Eddaion. Companies operating in the plasma-activated water for fertilization market are strengthening their competitive position through continuous investment in plasma generation technology, system efficiency improvements, and integration with advanced irrigation infrastructure. Market participants are focusing on enhancing energy efficiency, scalability, and operational reliability to support broader adoption across commercial agriculture. Strategic collaborations with research institutions and agricultural technology providers enable faster validation and commercialization of new applications. Businesses are also expanding pilot projects and demonstration farms to increase awareness and build grower confidence in plasma-based fertilization systems.
Table of Contents
Chapter 1 Methodology & Scope
- 1.1 Market scope and definition
- 1.2 Research design
- 1.2.1 Research approach
- 1.2.2 Data collection methods
- 1.3 Data mining sources
- 1.3.1 Global
- 1.3.2 Regional/Country
- 1.4 Base estimates and calculations
- 1.4.1 Base year calculation
- 1.4.2 Key trends for market estimation
- 1.5 Primary research and validation
- 1.5.1 Primary sources
- 1.6 Forecast model
- 1.7 Research assumptions and limitations
Chapter 2 Executive Summary
- 2.1 Industry 360° synopsis
- 2.2 Key market trends
- 2.2.1 Regional
- 2.2.2 Plasma Generation Technology
- 2.2.3 Application
- 2.2.4 End-User
- 2.2.5 Crop Type
- 2.3 TAM Analysis, 2026-2035
- 2.4 CXO perspectives: Strategic imperatives
- 2.4.1 Executive decision points
Chapter 3 Industry Insights
- 3.1 Industry ecosystem analysis
- 3.1.1 Supplier landscape
- 3.1.2 Profit margin
- 3.1.3 Value addition at each stage
- 3.1.4 Factor affecting the value chain
- 3.1.5 Disruptions
- 3.2 Industry impact forces
- 3.2.1 Growth drivers
- 3.2.2 Industry pitfalls and challenges
- 3.2.3 Market opportunities
- 3.3 Growth potential analysis
- 3.4 Regulatory landscape
- 3.4.1 North America
- 3.4.2 Europe
- 3.4.3 Asia Pacific
- 3.4.4 Latin America
- 3.4.5 Middle East & Africa
- 3.5 Porter's analysis
- 3.6 PESTEL analysis
- 3.7 Price trends
- 3.7.1 By region
- 3.7.2 By crop type
- 3.8 Future market trends
- 3.9 Technology and Innovation landscape
- 3.9.1 Current technological trends
- 3.9.2 Emerging technologies
- 3.10 Patent Landscape
- 3.11 Trade statistics (HS code)
- 3.11.1 Major importing countries
- 3.11.2 Major exporting countries
- 3.12 Sustainability and environmental aspects
- 3.12.1 Sustainable practices
- 3.12.2 Waste reduction strategies
- 3.12.3 Energy efficiency in production
- 3.12.4 Eco-friendly initiatives
- 3.13 Carbon footprint consideration
Chapter 4 Competitive Landscape, 2025
- 4.1 Introduction
- 4.2 Company market share analysis
- 4.2.1 By region
- 4.2.1.1 North America
- 4.2.1.2 Europe
- 4.2.1.3 Asia Pacific
- 4.2.1.4 LATAM
- 4.2.1.5 MEA
- 4.2.1 By region
- 4.3 Company matrix analysis
- 4.4 Competitive analysis of major market players
- 4.5 Competitive positioning matrix
- 4.6 Key developments
- 4.6.1 Mergers & acquisitions
- 4.6.2 Partnerships & collaborations
- 4.6.3 New Product Launches
- 4.6.4 Expansion Plans
Chapter 5 Market Estimates and Forecast, By Plasma Generation Technology, 2022-2035 (USD Million)
- 5.1 Key trends
- 5.2 Dielectric Barrier Discharge (DBD)
- 5.3 Corona Discharge
- 5.4 Atmospheric Pressure Plasma Jets (APPJ)
- 5.5 Microwave Discharge
- 5.6 Gliding Arc Discharge
Chapter 6 Market Estimates and Forecast, By Application, 2022-2035 (USD Million)
- 6.1 Key trends
- 6.2 Irrigation & Fertilization
- 6.3 Seed Treatment & Priming
- 6.4 Foliar Application & Plant Protection
- 6.5 Post-Harvest Treatment
Chapter 7 Market Estimates and Forecast, By End-User, 2022-2035 (USD Million)
- 7.1 Key trends
- 7.2 Controlled Environment Agriculture (CEA)
- 7.3 Open-Field Agriculture
- 7.4 Organic Farms
- 7.5 Nurseries & Horticulture
- 7.6 Research Institutions
Chapter 8 Market Estimates and Forecast, By Crop Type, 2022-2035 (USD Million)
- 8.1 Key trends
- 8.2 Vegetables
- 8.3 Cereals & Grains
- 8.4 Fruits
- 8.5 Others
Chapter 9 Market Estimates and Forecast, By Region, 2022-2035 (USD Million)
- 9.1 Key trends
- 9.2 North America
- 9.2.1 U.S.
- 9.2.2 Canada
- 9.3 Europe
- 9.3.1 Germany
- 9.3.2 UK
- 9.3.3 France
- 9.3.4 Spain
- 9.3.5 Italy
- 9.3.6 Rest of Europe
- 9.4 Asia Pacific
- 9.4.1 China
- 9.4.2 India
- 9.4.3 Japan
- 9.4.4 Australia
- 9.4.5 South Korea
- 9.4.6 Rest of Asia Pacific
- 9.5 Latin America
- 9.5.1 Brazil
- 9.5.2 Mexico
- 9.5.3 Argentina
- 9.5.4 Rest of Latin America
- 9.6 Middle East and Africa
- 9.6.1 Saudi Arabia
- 9.6.2 South Africa
- 9.6.3 UAE
- 9.6.4 Rest of Middle East and Africa
Chapter 10 Company Profiles
- 10.1 VitalFluid
- 10.2 N2 Applied
- 10.3 Plasma Waters
- 10.4 Aqtiva Inc.
- 10.5 PAWER Solutions
- 10.6 HydroPlasma.Tech
- 10.7 cNTP AgriTech
- 10.8 Plasma Systems
- 10.9 Redhill Scientific
- 10.10 Greenpath Industries
- 10.11 Global Enviro
- 10.12 WIADAP Plasma Tech
- 10.13 US Plasma Engineering
- 10.14 AJ Plasmatech
- 10.15 Eddaion

