
PUBLISHER: Global Market Insights Inc. | PRODUCT CODE: 2101600

PUBLISHER: Global Market Insights Inc. | PRODUCT CODE: 2101600
Citric Acid and Lactic Acid Market Opportunity, Growth Drivers, Industry Trend Analysis, and Forecast 2026 - 2035
The Global Food Citric Acid & Lactic Acid Market was valued at USD 11.1 billion in 2025 and is estimated to grow at a CAGR of 5.1% to reach USD 18.2 billion by 2035.
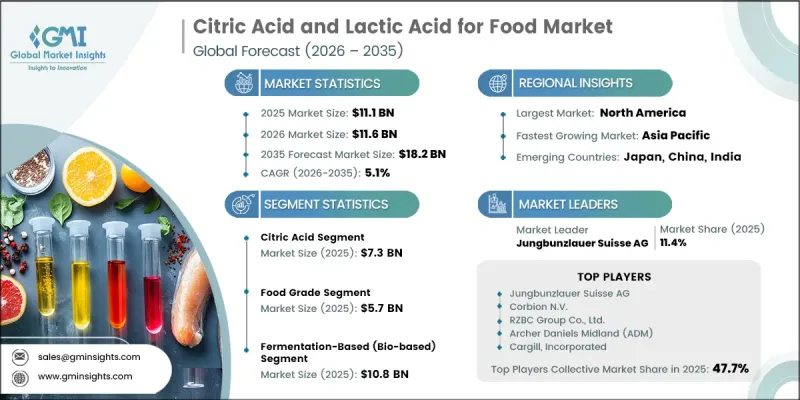
Market growth is supported by the expanding demand for both citric acid and lactic acid, as each delivers unique functional benefits across multiple industries. Citric acid continues to maintain its position as a widely consumed acidulant, while lactic acid is gaining stronger commercial acceptance because of its broader industrial applications beyond traditional food and pharmaceutical uses. The food and beverage industry remains the largest source of demand due to the essential role these ingredients play in product formulation and processing. Pharmaceutical and personal care manufacturers also contribute significantly to market revenue because of stringent product quality requirements and specialized formulations. Fermentation-based manufacturing continues to dominate production owing to its operational efficiency and growing preference for bio-based ingredients. As industries increasingly shift toward sustainable production methods, chemically manufactured alternatives continue to lose market relevance. Market maturity varies across regions, with developed economies maintaining stable consumption through established industrial sectors, while emerging economies experience faster expansion driven by urbanization, rising packaged food consumption, growing middle-income populations, and continued investment in pharmaceutical production facilities.
| Market Scope | |
|---|---|
| Start Year | 2025 |
| Forecast Year | 2026-2035 |
| Start Value | $11.1 Billion |
| Forecast Value | $18.2 Billion |
| CAGR | 5.1% |
The citric acid segment accounted for USD 7.3 billion in 2025 and is expected to grow at a 3.5% CAGR between 2026 and 2035. Demand remains consistent across the food and beverage industry because citric acid serves as an effective acidulant, preservative, flavor enhancer, and pH regulator. Continued growth in processed food products, ready-to-drink beverages, functional food formulations, and clean-label product development supports market expansion. Manufacturers are also improving fermentation technologies and optimizing production processes to increase operational efficiency while meeting sustainability objectives. Beyond food applications, rising utilization across pharmaceutical products, household cleaning formulations, and personal care products continues to diversify the demand base and strengthen long-term market opportunities.
The food and beverages application segment generated USD 5.6 million in 2025. Both acids play an essential role in food manufacturing by supporting acidity control, product preservation, flavor enhancement, and shelf-life improvement across a broad range of food and beverage formulations. Sustained consumer demand for processed foods, beverages, dairy products, confectionery products, and convenience foods continues to reinforce market growth within this application segment. Pharmaceutical products as well as personal care and cosmetics remain important application areas where citric acid and lactic acid contribute to pH regulation, formulation stability, product performance, and ingredient functionality.
North America Citric Acid & Lactic Acid for Food Market reached USD 3.7 billion in 2025 to USD 5.8 billion by 2035. Regional demand continues to remain stable due to the strong presence of established food processing, pharmaceutical, and personal care manufacturing industries. Increasing preference for bio-based ingredients is further supporting market expansion across the region. In the United States, sustained consumption of processed food products combined with the growing adoption of sustainable packaging materials continues to generate consistent demand across several end-use industries. These market conditions are also encouraging investments in advanced fermentation technologies to improve manufacturing efficiency and strengthen long-term production capabilities.
Major companies operating in the global citric acid & lactic acid for food market include Jungbunzlauer Suisse AG, Corbion N.V., RZBC Group Co., Ltd., Archer Daniels Midland Company (ADM), Cargill, Incorporated, Galactic S.A., COFCO Biotechnology Co., Ltd., Citribel N.V., TTCA Co., Ltd., and Gadot Biochemical Industries Ltd. Companies operating in the citric acid & lactic acid for food market are strengthening their market position by expanding fermentation-based production capacity, improving manufacturing efficiency, and investing in sustainable production technologies. Many producers are focusing on product quality, cost optimization, and process innovation to meet evolving customer requirements while maintaining consistent supply. Businesses are also broadening their application portfolio by serving food and beverage, pharmaceutical, and personal care manufacturers with specialized ingredient solutions. Capacity expansion, operational improvements, and strategic investments in advanced production facilities remain key priorities for supporting future demand.
Table of Contents
Chapter 1 Methodology & Scope
- 1.1 Market scope and definition
- 1.2 Research design
- 1.2.1 Research approach
- 1.2.2 Data collection methods
- 1.3 Data mining sources
- 1.3.1 Global
- 1.3.2 Regional/Country
- 1.4 Base estimates and calculations
- 1.4.1 Base year calculation
- 1.4.2 Key trends for market estimation
- 1.5 Primary research and validation
- 1.5.1 Primary sources
- 1.6 Forecast model
- 1.7 Research assumptions and limitations
Chapter 2 Executive Summary
- 2.1 Industry 360° synopsis
- 2.2 Key market trends
- 2.2.1 Regional
- 2.2.2 Offerings
- 2.2.3 Sensor Type
- 2.2.4 Application
- 2.3 TAM Analysis, 2026-2035
- 2.4 CXO perspectives: Strategic imperatives
- 2.4.1 Executive decision points
- 2.4.2 Critical success factors
- 2.5 Future Outlook and strategic recommendations
Chapter 3 Industry Insights
- 3.1 Industry ecosystem analysis
- 3.1.1 Supplier Landscape
- 3.1.2 Profit Margin
- 3.1.3 Value addition at each stage
- 3.1.4 Factor affecting the value chain
- 3.1.5 Disruptions
- 3.2 Industry impact forces
- 3.2.1 Growth drivers
- 3.2.1.1 Rising adoption of precision agriculture & smart farming practices
- 3.2.1.2 Escalating water scarcity & imperative for irrigation efficiency
- 3.2.1.3 Government subsidies & policy push for sustainable soil management
- 3.2.2 Industry pitfalls and challenges
- 3.2.2.1 High initial capital investment: adoption barrier for smallholder farmers
- 3.2.2.2 Absence of standardized communication protocols & interoperability issues
- 3.2.3 Market opportunities
- 3.2.3.1 Increasing adoption of precision agriculture & smart farming technologies
- 3.2.3.2 Rising government & sustainability initiatives for soil conservation
- 3.2.1 Growth drivers
- 3.3 Growth potential analysis
- 3.4 Regulatory landscape
- 3.4.1 North America
- 3.4.2 Europe
- 3.4.3 Asia Pacific
- 3.4.4 Latin America
- 3.4.5 Middle East & Africa
- 3.5 Porter's analysis
- 3.6 PESTEL analysis
- 3.6.1 Technology and innovation landscape
- 3.6.2 Current technological trends
- 3.6.3 Emerging technologies
- 3.7 Price trends
- 3.7.1 By region
- 3.7.2 By product type
- 3.8 Future market trends
- 3.9 Technology and Innovation Landscape
- 3.9.1 Current technological trends
- 3.9.2 Emerging technologies
- 3.10 Patent Landscape
- 3.11 Trade statistics (HS code) (Note: the trade statistics will be provided for key countries only)
- 3.11.1 Major importing countries
- 3.11.2 Major exporting countries
- 3.12 Sustainability and environmental aspects
- 3.12.1 Sustainable practices
- 3.12.2 Waste reduction strategies
- 3.12.3 Energy efficiency in production
- 3.12.4 Eco-friendly initiatives
- 3.13 Carbon Footprint Considerations
Chapter 4 Competitive Landscape, 2025
- 4.1 Introduction
- 4.2 Company market share analysis
- 4.2.1 By region
- 4.2.1.1 North America
- 4.2.1.2 Europe
- 4.2.1.3 Asia Pacific
- 4.2.1.4 LATAM
- 4.2.1.5 MEA
- 4.2.1 By region
- 4.3 Company matrix analysis
- 4.4 Competitive analysis of major market players
- 4.5 Competitive positioning matrix
- 4.6 Key developments
- 4.6.1 Mergers & acquisitions
- 4.6.2 Partnerships & collaborations
- 4.6.3 New product launches
- 4.6.4 Expansion plans
Chapter 5 Market Estimates and Forecast, By Material Type, 2022 - 2035 (USD Million) (000' Units)
- 5.1 Key trends
- 5.2 Hardware
- 5.2.1 Soil moisture sensors
- 5.2.2 Soil temperature sensors
- 5.2.3 Soil ph sensors
- 5.2.4 Soil salinity / electrical conductivity (EC) sensors
- 5.2.5 Soil nutrient sensors
- 5.2.6 Multi-parameter / integrated sensors
- 5.2.7 Others
- 5.3 Software
- 5.3.1 Soil analysis & mapping software
- 5.3.2 Data management & cloud analytics platforms
- 5.3.3 Decision support systems (DSS) & AI-driven agronomic analytics
- 5.4 Services
- 5.4.1 Soil testing & laboratory services
- 5.4.2 Consulting & advisory services
- 5.4.3 Installation, calibration & maintenance services
Chapter 6 Market Estimates and Forecast, By Sensor Type, 2022 - 2035 (USD Million) (000' Units)
- 6.1 Key trends
- 6.2 Soil moisture sensors
- 6.3 Soil temperature sensors
- 6.4 Soil pH sensors
- 6.5 Nutrient / NPK sensors
- 6.6 Electrical conductivity
- 6.7 Multi-parameter probes
Chapter 7 Market Estimates and Forecast, By Application, 2022 - 2035 (USD Million) (000' Units)
- 7.1 Key trends
- 7.2 Agriculture
- 7.2.1 Open field / row crops
- 7.2.2 Protected cultivation (greenhouse & polyhouse)
- 7.2.3 Horticulture & viticulture
- 7.2.4 Precision irrigation management
- 7.3 Environmental monitoring
- 7.3.1 Soil contamination & pollution monitoring
- 7.3.2 Erosion & land degradation monitoring
- 7.3.3 Carbon sequestration & ESG Compliance Monitoring
- 7.4 Construction & Geotechnical
- 7.4.1 Site Preparation & Foundation Stability Monitoring
- 7.4.2 Slope Stability & Structural Integrity Monitoring
- 7.5 Sports Turf & Landscaping
- 7.5.1 Golf Course Management
- 7.5.2 Stadium & Sports Field Management
- 7.5.3 Commercial & Residential Landscaping
- 7.6 Forestry & Research
- 7.6.1 Academic & Government Research Institutions
- 7.6.2 Reforestation & Conservation Area Monitoring
- 7.7 Others
Chapter 8 Market Estimates and Forecast, By Region, 2022 - 2035 (USD Million) (000' Units)
- 8.1 Key trends
- 8.2 North America
- 8.2.1 U.S.
- 8.2.2 Canada
- 8.3 Europe
- 8.3.1 Germany
- 8.3.2 UK
- 8.3.3 France
- 8.3.4 Spain
- 8.3.5 Italy
- 8.3.6 Rest of Europe
- 8.4 Asia Pacific
- 8.4.1 China
- 8.4.2 India
- 8.4.3 Japan
- 8.4.4 Australia
- 8.4.5 South Korea
- 8.4.6 Rest of Asia Pacific
- 8.5 Latin America
- 8.5.1 Brazil
- 8.5.2 Mexico
- 8.5.3 Argentina
- 8.5.4 Rest of Latin America
- 8.6 Middle East and Africa
- 8.6.1 Saudi Arabia
- 8.6.2 South Africa
- 8.6.3 UAE
- 8.6.4 Rest of Middle East and Africa
Chapter 9 Company Profiles
- 9.1 METER Group, Inc.
- 9.2 Campbell Scientific, Inc.
- 9.3 The Toro Company
- 9.4 SGS Group
- 9.5 Sentek Technologies
- 9.6 Pessl Instruments GmbH (METOS)
- 9.7 Delta-T Devices Ltd
- 9.8 Royal Eijkelkamp
- 9.9 ICT International Pty Ltd.
- 9.10 CropX Technologies Ltd.
- 9.11 Sensoterra B.V.
- 9.12 Soil Scout Ltd.

