
PUBLISHER: Global Market Insights Inc. | PRODUCT CODE: 2101647

PUBLISHER: Global Market Insights Inc. | PRODUCT CODE: 2101647
Stabilized Urea Market Opportunity, Growth Drivers, Industry Trend Analysis, and Forecast 2026 - 2035
The Global Stabilized Urea Market was valued at USD 4.2 billion in 2025 and is estimated to grow at a CAGR of 6.2% to reach USD 8.2 billion by 2035.
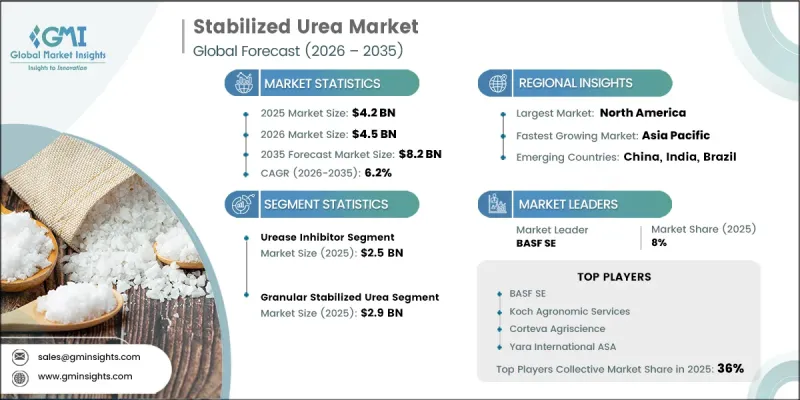
The stabilized urea industry continues to outperform the conventional urea market as demand increasingly shifts toward enhanced-efficiency fertilizers that improve nitrogen utilization and support environmental objectives. Growth in the traditional urea sector remains comparatively moderate because established markets already have sufficient commodity supply, while industry participants continue to prioritize the wider adoption of stabilization technologies. Regulatory developments encouraging the use of nitrogen-efficient fertilizer products are reshaping purchasing decisions and accelerating product acceptance across several agricultural markets. These evolving policies are also changing the competitive landscape by placing greater emphasis on regulatory compliance alongside agronomic performance. As a result, manufacturers are focusing on registered and compliant product portfolios while expanding commercialization opportunities in both mature and developing agricultural regions. Market participants are also directing investments toward advanced formulations that combine multiple inhibitor technologies within a single fertilizer product to improve nitrogen retention, increase operational efficiency, and deliver broader performance benefits across diverse crop production systems. The impact remains immediate in regions where regulations are already implemented, while markets currently evaluating similar policies are expected to experience medium-term growth opportunities.
| Market Scope | |
|---|---|
| Start Year | 2025 |
| Forecast Year | 2026-2035 |
| Start Value | $4.2 Billion |
| Forecast Value | $8.2 Billion |
| CAGR | 6.2% |
The urease inhibitor segment accounted for USD 2.5 billion in 2025 and is projected to grow at a CAGR of 5% from 2026 to 2035. This segment continues to represent the largest share of stabilized urea demand because urease inhibitors remain the most widely adopted stabilization technology across global agricultural markets. Industry expansion reflects the broad commercial availability of these products and their established role in improving nitrogen use efficiency while minimizing nutrient losses after fertilizer application. Although adoption has steadily increased over the past decade, the segment is entering a more mature phase in developed agricultural markets. The expected growth rate reflects this level of market maturity across North America and Western Europe while also indicating continued expansion opportunities as additional regulatory measures and sustainability initiatives encourage greater use of stabilized nitrogen fertilizers.
The granular stabilized urea segment was valued at USD 2.9 billion in 2025 and represented 65.9% share, maintaining its position as the leading product format for nitrogen application across large-scale agricultural operations. Granular stabilized urea remains the preferred choice because it is compatible with existing fertilizer handling equipment, offers convenient storage and transportation, and supports efficient field application. Surface-treated granular formulations continue to dominate commercial production, enabling manufacturers to integrate stabilization technologies while preserving the operational advantages of conventional granular fertilizers. Ongoing investments in product development are expected to further improve formulation performance and strengthen demand throughout the forecast period.
North America Stabilized Urea Market accounted for 31% share in 2025, reaching USD 1.40 billion. Regional market expansion is supported by strong agricultural production, increasing fertilizer consumption, and the growing adoption of enhanced-efficiency nitrogen products designed to improve nutrient management. Rising awareness regarding fertilizer optimization, greater emphasis on sustainable farming practices, and continued investments in modern agricultural technologies are supporting long-term market development across both regions. The combination of evolving farming practices, improving regulatory frameworks, and increasing demand for higher crop productivity continues to strengthen growth prospects for stabilized urea throughout the forecast period.
Major companies operating in the global stabilized urea market include BASF SE, Koch Agronomic Services, Corteva Agriscience, Yara International ASA, SKW Stickstoffwerke Piesteritz GmbH, ICL Group, Tessenderlo Group, AgXplore International, LLC, Loveland Products, Inc., J.R. Simplot Company, and Helena Agri-Enterprises, LLC. Leading companies in the stabilized urea market focus on expanding their competitive position through continuous product innovation, strategic partnerships, portfolio diversification, and investments in advanced fertilizer technologies. Manufacturers prioritize developing enhanced-efficiency fertilizer solutions that improve nutrient utilization while meeting evolving environmental and regulatory requirements. Companies are also strengthening their market presence by expanding production capabilities, improving distribution networks, and increasing penetration across high-growth agricultural regions. Investments in research and development remain a key strategy for introducing advanced stabilization technologies and improving product performance.
Table of Contents
Chapter 1 Methodology & Scope
- 1.1 Market scope and definition
- 1.2 Research design
- 1.2.1 Research approach
- 1.2.2 Data collection methods
- 1.3 Data mining sources
- 1.3.1 Global
- 1.3.2 Regional/Country
- 1.4 Base estimates and calculations
- 1.4.1 Base year calculation
- 1.4.2 Key trends for market estimation
- 1.5 Primary research and validation
- 1.5.1 Primary sources
- 1.6 Forecast model
- 1.7 Research assumptions and limitations
Chapter 2 Executive Summary
- 2.1 Industry 360° synopsis
- 2.2 Key market trends
- 2.2.1 Regional
- 2.2.2 Stabilization Technology
- 2.2.3 Physical Form
- 2.2.4 Crop Type
- 2.2.5 Application
- 2.3 TAM Analysis, 2026-2035
- 2.4 CXO perspectives: Strategic imperatives
- 2.4.1 Executive decision points
Chapter 3 Industry Insights
- 3.1 Industry ecosystem analysis
- 3.1.1 Supplier landscape
- 3.1.2 Profit margin
- 3.1.3 Value addition at each stage
- 3.1.4 Factor affecting the value chain
- 3.1.5 Disruptions
- 3.2 Industry impact forces
- 3.2.1 Growth drivers
- 3.2.2 Industry pitfalls and challenges
- 3.2.3 Market opportunities
- 3.3 Growth potential analysis
- 3.4 Regulatory landscape
- 3.4.1 North America
- 3.4.2 Europe
- 3.4.3 Asia Pacific
- 3.4.4 Latin America
- 3.4.5 Middle East & Africa
- 3.5 Porter's analysis
- 3.6 PESTEL analysis
- 3.7 Price trends
- 3.7.1 By region
- 3.7.2 By Stabilization Technology
- 3.8 Future market trends
- 3.9 Technology and Innovation landscape
- 3.9.1 Current technological trends
- 3.9.2 Emerging technologies
- 3.10 Patent Landscape
- 3.11 Trade statistics (HS code)
- 3.11.1 Major importing countries
- 3.11.2 Major exporting countries
- 3.12 Sustainability and environmental aspects
- 3.12.1 Sustainable practices
- 3.12.2 Waste reduction strategies
- 3.12.3 Energy efficiency in production
- 3.12.4 Eco-friendly initiatives
- 3.13 Carbon footprint consideration
Chapter 4 Competitive Landscape, 2025
- 4.1 Introduction
- 4.2 Company market share analysis
- 4.2.1 By region
- 4.2.1.1 North America
- 4.2.1.2 Europe
- 4.2.1.3 Asia Pacific
- 4.2.1.4 LATAM
- 4.2.1.5 MEA
- 4.2.1 By region
- 4.3 Company matrix analysis
- 4.4 Competitive analysis of major market players
- 4.5 Competitive positioning matrix
- 4.6 Key developments
- 4.6.1 Mergers & acquisitions
- 4.6.2 Partnerships & collaborations
- 4.6.3 New Product Launches
- 4.6.4 Expansion Plans
Chapter 5 Market Estimates and Forecast, By Stabilization Technology, 2022-2035 (USD Billion)
- 5.1 Key trends
- 5.2 Urease Inhibitor
- 5.3 Nitrification Inhibitor
- 5.4 Dual Inhibitor
- 5.5 Others
Chapter 6 Market Estimates and Forecast, By Physical Form, 2022-2035 (USD Billion)
- 6.1 Key trends
- 6.2 Granular Stabilization Urea
- 6.3 Prilled Stabilization Urea
- 6.4 Liquid/Solution Stabilization Urea
- 6.5 Others
Chapter 7 Market Estimates and Forecast, By Application, 2022-2035 (USD Billion)
- 7.1 Key trends
- 7.2 Broadcast/Soil Application
- 7.3 Fertigation
- 7.4 Foliar Application
- 7.5 Others
Chapter 8 Market Estimates and Forecast, By Form, 2022-2035 (USD Billion)
- 8.1 Key trends
- 8.2 Dry
- 8.3 Liquid
Chapter 9 Market Estimates and Forecast, By Region, 2022-2035 (USD Billion)
- 9.1 Key trends
- 9.2 North America
- 9.2.1 U.S.
- 9.2.2 Canada
- 9.3 Europe
- 9.3.1 Germany
- 9.3.2 UK
- 9.3.3 France
- 9.3.4 Spain
- 9.3.5 Italy
- 9.3.6 Rest of Europe
- 9.4 Asia Pacific
- 9.4.1 China
- 9.4.2 India
- 9.4.3 Japan
- 9.4.4 Australia
- 9.4.5 South Korea
- 9.4.6 Rest of Asia Pacific
- 9.5 Latin America
- 9.5.1 Brazil
- 9.5.2 Mexico
- 9.5.3 Argentina
- 9.5.4 Rest of Latin America
- 9.6 Middle East and Africa
- 9.6.1 Saudi Arabia
- 9.6.2 South Africa
- 9.6.3 UAE
- 9.6.4 Rest of Middle East and Africa
Chapter 10 Company Profiles
- 10.1 BASF SE
- 10.2 Koch Agronomic Services
- 10.3 Corteva Agriscience
- 10.4 Yara International ASA
- 10.5 SKW Stickstoffwerke Piesteritz GmbH
- 10.6 ICL Group
- 10.7 Tessenderlo Group
- 10.8 AgXplore International, LLC
- 10.9 Loveland Products, Inc.
- 10.10 J.R. Simplot Company
- 10.11 Helena Agri-Enterprises, LLC

