PUBLISHER: Global Market Insights Inc. | PRODUCT CODE: 2101680

PUBLISHER: Global Market Insights Inc. | PRODUCT CODE: 2101680
Post Combustion Solvents Market Opportunity, Growth Drivers, Industry Trend Analysis, and Forecast 2026 - 2035
The Global Post Combustion Solvents Market was valued at USD 400 million in 2025 and is estimated to grow at a CAGR of 9.1% to reach USD 951 million by 2035.
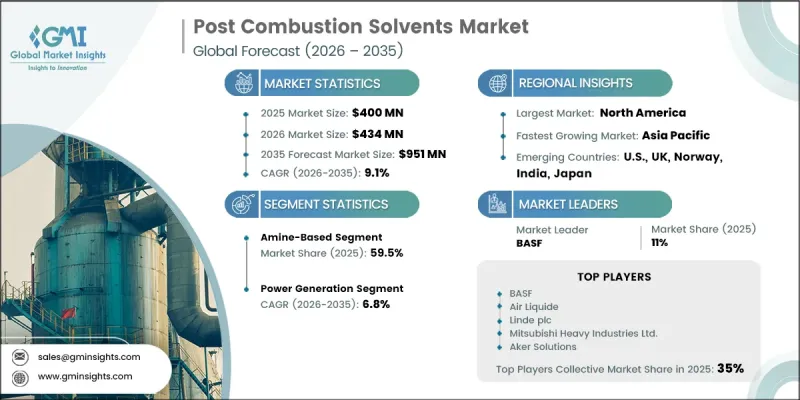
The market growth is driven by increasing investments in carbon capture technologies, rising global decarbonization efforts, and the growing requirement for emissions reduction solutions across industries with limited electrification potential. Post combustion solvents play a critical role in carbon capture systems by enabling the separation of CO2 from industrial exhaust streams after fuel combustion through chemical absorption processes. Technology continues to gain importance as industries seek practical solutions for reducing emissions from existing facilities while maintaining operational continuity. Expanding carbon pricing frameworks, government climate targets, and increasing adoption of carbon capture and storage (CCS) infrastructure are creating favorable conditions for market development. Industries including power generation, heavy manufacturing, and processing sectors are increasingly evaluating solvent-based capture systems as a pathway toward achieving emission reduction goals. As carbon management strategies become more advanced, the demand for efficient solvent technologies with improved performance, lower operating costs, and enhanced sustainability characteristics is expected to increase significantly.
| Market Scope | |
|---|---|
| Start Year | 2025 |
| Forecast Year | 2026-2035 |
| Start Value | $400 Million |
| Forecast Value | $951 Million |
| CAGR | 9.1% |
The post combustion solvents market is shaped by rising adoption across power generation, oil & gas, and industrial sectors where emission reduction remains challenging through conventional energy transition methods. While power and oil & gas industries continue to contribute significant demand, sectors such as steel and cement are expected to become major growth contributors as carbon reduction requirements become increasingly stringent. The market is also evolving through a clear distinction between conventional amine-based solvent suppliers and advanced proprietary solvent technology providers. Commodity solvent producers compete primarily through supply capabilities and cost efficiency, whereas specialized technology developers create value through intellectual property, process optimization, performance guarantees, and long-term operational support. This evolving competitive structure is expected to influence investment strategies and supplier positioning throughout the forecast period.
The amine-based solvents segment accounted for 59.5% share in 2025, supported by their extensive commercial adoption, established production networks, and proven chemical performance. Conventional amine solutions continue to serve as widely accepted options for carbon capture applications, particularly where operators prioritize reliability, lower implementation complexity, and compatibility with existing industrial systems. Their established operational history and broad availability continue to support their leading position within solvent-based carbon capture technologies.
The power generation segment held 39% share in 2025, growing at a CAGR of 6.8% through 2035. Existing thermal power facilities across major industrial regions continue to represent significant opportunities for carbon capture deployment, as solvent-based post combustion systems can be integrated with existing combustion and exhaust infrastructure. The compatibility of these solutions with operating power assets makes them a preferred approach for reducing emissions from established generation facilities.
North America Post Combustion Solvents Market accounted for 35.5% share in 2025 and is expected to grow at a CAGR of 7.5%. The region's strong market position is supported by favorable carbon management policies, established industrial infrastructure, and increasing investment in carbon capture projects. Financial incentives supporting carbon storage and emission reduction initiatives are improving the economic feasibility of carbon capture projects across industrial and energy applications, encouraging greater deployment of solvent-based capture technologies.
The post combustion solvents market is moderately concentrated, with leading companies including Mitsubishi Heavy Industries Ltd., BASF, Aker Solutions, Linde plc, and Air Liquide. Companies operating in the post combustion solvents market are strengthening their market presence through technology development, strategic collaborations, and expansion of carbon capture solution portfolios. Market participants are investing in advanced solvent formulations designed to improve CO2 absorption efficiency, reduce energy consumption, and enhance operational performance. Companies are also focusing on partnerships with industrial operators and project developers to expand technology adoption and secure long-term opportunities. Increasing investments in research and development are helping manufacturers develop next-generation solvent solutions with improved environmental performance and cost advantages.
Table of Contents
Chapter 1 Methodology & Scope
- 1.1 Research approach
- 1.2 Quality commitments
- 1.2.1 GMI AI policy & data integrity commitment
- 1.2.1.1 Source consistency protocol
- 1.2.1 GMI AI policy & data integrity commitment
- 1.3 Research trail & confidence scoring
- 1.3.1 Research trail components
- 1.3.2 Scoring components
- 1.4 Data collection
- 1.4.1 Partial list of primary sources
- 1.5 Data mining sources
- 1.5.1 Paid sources
- 1.5.1.1 Sources, by region
- 1.5.1 Paid sources
- 1.6 Base estimates and calculations
- 1.6.1 Base year calculation for any one approach
- 1.7 Market estimates & forecasts parameters
- 1.8 Forecast model
- 1.8.1 Quantified market impact analysis
- 1.8.1.1 Mathematical impact of growth parameters on forecast
- 1.8.1 Quantified market impact analysis
- 1.9 Research transparency addendum
- 1.9.1 Source attribution framework
- 1.9.2 Quality assurance metrics
- 1.9.3 Our commitment to trust
- 1.10 Market definitions
Chapter 2 Executive Summary
- 2.1 Industry synopsis, 2022 - 2035
- 2.1.1 Business trends
- 2.1.2 Solvent type trends
- 2.1.3 Deployment trends
- 2.1.4 End use trends
- 2.1.5 Regional trends
Chapter 3 Industry Insights
- 3.1 Industry ecosystem analysis
- 3.1.1 Raw material suppliers
- 3.1.2 Solvent formulators & manufacturers
- 3.1.3 Engineering, Procurement & Construction (EPC) contractors
- 3.1.4 End-user operators
- 3.1.5 Solvent reclaiming & waste management providers
- 3.2 Technology & innovation landscape
- 3.2.1 Emerging digester configurations
- 3.2.2 Biogas upgrading technology advances
- 3.2.3 Smart digester & IoT-enabled monitoring innovations
- 3.2.4 Co-digestion technology advances & multi-feedstock systems
- 3.3 Regulatory landscape
- 3.3.1 Global climate frameworks driving CCS mandates
- 3.3.2 EU Emissions Trading System (EU ETS) & Carbon Border Adjustment Mechanism (CBAM)
- 3.3.3 Solvent emission standards & environmental permitting
- 3.3.4 Country-specific CCS policy frameworks
- 3.4 Industry impact forces
- 3.4.1 Growth drivers
- 3.4.1.1 Stringent global decarbonization targets and carbon pricing mechanisms
- 3.4.1.2 Rising industrial demand for CO2 capture in hard-to-abate sectors
- 3.4.1.3 Strong government incentives and funding for CCS deployment
- 3.4.2 Industry pitfalls and challenges
- 3.4.2.1 High operational costs and solvent degradation issues
- 3.4.1 Growth drivers
- 3.5 Growth potential analysis
- 3.6 Porter's analysis
- 3.6.1 Bargaining power of suppliers
- 3.6.2 Bargaining power of buyers
- 3.6.3 Threat of new entrants
- 3.6.4 Threat of substitute
- 3.6.5 Intensity of competitive rivalry
- 3.7 PESTEL analysis
- 3.7.1 Political factors
- 3.7.2 Economic factors
- 3.7.3 Social factors
- 3.7.4 Technological factors
- 3.7.5 Environmental factors
- 3.7.6 Legal factors
- 3.8 Impact of AI and generative AI on the market (Driven by primary research)
- 3.8.1 AI-driven disruption of existing solvent formulation & screening
- 3.8.2 GenAI use cases & adoption roadmap
- 3.8.3 Risks, limitations & regulatory considerations for AI in CCS operations
- 3.9 Technology & innovation landscape
- 3.9.1 First-generation solvents (MEA/DEA)
- 3.9.2 Second-generation blended & hindered amine solvents
- 3.9.3 Third-generation advanced solvents
- 3.9.4 Water-lean & non-aqueous solvent development status
- 3.9.5 Process integration innovations & production landscape
Chapter 4 Competitive Landscape, 2026
- 4.1 Introduction
- 4.2 Company market share analysis, by region, 2025
- 4.2.1 North America
- 4.2.2 Europe
- 4.2.3 Asia Pacific
- 4.2.4 Middle East & Africa
- 4.2.5 Latin America
- 4.3 Competitive analysis of major market players
- 4.4 Competitive positioning matrix
- 4.5 Key developments
- 4.5.1 Mergers & acquisitions
- 4.5.2 Partnerships & collaborations
- 4.5.3 New product launches
- 4.5.4 Expansion plans and funding
- 4.6 Company tier benchmarking
- 4.6.1 Tier classification criteria & qualifying thresholds
- 4.6.2 Tier positioning matrix by revenue, geography & innovation
Chapter 5 Market Size and Forecast, By Solvent type, 2022 - 2035 (USD Million)
- 5.1 Key trends
- 5.2 Amine-based
- 5.3 Ammonia-based
- 5.4 Amino acid salt
- 5.5 Ionic liquid
- 5.6 Carbonate-based
- 5.7 Blended/mixed
- 5.8 Others
Chapter 6 Market Size and Forecast, By Deployment, 2022 - 2035 (USD Million)
- 6.1 Key trends
- 6.2 Small/modular scale
- 6.3 Medium-scale
- 6.4 Large-scale
Chapter 7 Market Size and Forecast, By End Use, 2022 - 2035 (USD Million)
- 7.1 Key trends
- 7.2 Power generation
- 7.3 Iron & steel
- 7.4 Cement manufacturing
- 7.5 Oil & gas
- 7.6 Chemical industry
- 7.7 Others
Chapter 8 Market Size and Forecast, By Region, 2022 - 2035 (USD Million)
- 8.1 Key trends
- 8.2 North America
- 8.2.1 U.S.
- 8.2.2 Canada
- 8.2.3 Mexico
- 8.3 Europe
- 8.3.1 Germany
- 8.3.2 UK
- 8.3.3 Norway
- 8.3.4 Netherlands
- 8.4 Asia Pacific
- 8.4.1 China
- 8.4.2 India
- 8.4.3 Japan
- 8.4.4 South Korea
- 8.4.5 Australia
- 8.5 Middle East & Africa
- 8.5.1 Saudi Arabia
- 8.5.2 UAE
- 8.6 Latin America
- 8.6.1 Brazil
Chapter 9 Company Profiles
- 9.1 Air Liquide
- 9.2 Aker Solutions
- 9.3 Axens
- 9.4 BASF
- 9.5 Carbon Clean Solutions Ltd.
- 9.6 Chevron Phillips Chemical Company
- 9.7 DOW Inc.
- 9.8 Evonik Industries
- 9.9 Fluor Corporation
- 9.10 Huntsman Corporation
- 9.11 INEOS Oligomers
- 9.12 ION Engineering
- 9.13 Linde PLC
- 9.14 Mitsubishi Heavy Industries, Ltd.
- 9.15 Nouryon
- 9.16 Shell Catalysts & Technologies
- 9.17 Solvay
- 9.18 Svante Technologies Inc.

