PUBLISHER: Global Market Insights Inc. | PRODUCT CODE: 2109165

PUBLISHER: Global Market Insights Inc. | PRODUCT CODE: 2109165
Inline Camera Inspection Market Opportunity, Growth Drivers, Industry Trend Analysis, and Forecast 2026 - 2035
The Global Inline Camera Inspection Market was valued at USD 3.5 billion in 2025 and is estimated to grow at a CAGR of 8.7% to reach USD 8 billion by 2035.
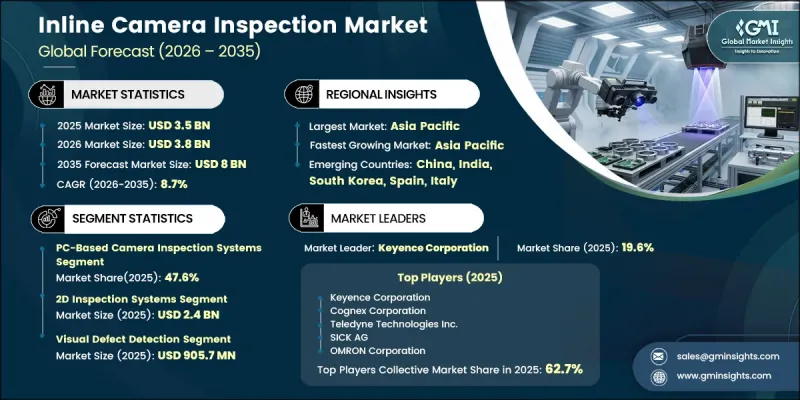
Market growth is being driven by the rapid adoption of Industry 4.0 technologies and smart manufacturing practices across production facilities worldwide. Manufacturers are increasingly investing in advanced inspection systems to improve production efficiency, enhance product quality, and automate quality control processes. Government initiatives supporting industrial modernization and digital manufacturing are further accelerating the deployment of machine vision technologies across multiple industries. Growing emphasis on real-time inspection, predictive maintenance, and automated production monitoring is creating favorable opportunities for market expansion. At the same time, the increasing use of artificial intelligence in quality inspection is enabling manufacturers to minimize production errors, improve operational efficiency, and maximize throughput. The inline camera inspection market is also benefiting from continuous advancements in imaging technologies, software capabilities, and automation systems that help manufacturers achieve higher accuracy, consistent product quality, and improved manufacturing performance while reducing operational costs across modern production environments.
| Market Scope | |
|---|---|
| Start Year | 2025 |
| Forecast Year | 2026-2035 |
| Start Value | $3.5 Billion |
| Forecast Value | $8 Billion |
| CAGR | 8.7% |
The PC-based camera inspection systems segment accounted for 47.6% share in 2025, making it the largest segment by revenue. Its leading position is supported by strong processing capabilities, high scalability, and the flexibility required to perform advanced image analysis and high-speed inspection tasks. Increasing adoption of artificial intelligence and advanced image-processing technologies continues to improve inspection accuracy, production efficiency, and defect detection capabilities, making PC-based systems a preferred choice across multiple manufacturing environments where precision and productivity remain critical.
The 2D inspection systems segment reached USD 2.4 billion in 2025. The segment continues to experience strong demand because of its broad compatibility with high-speed manufacturing operations and its ability to perform reliable surface inspection, dimensional verification, identification, and quality assessment. Easy integration into existing production lines, cost-effective implementation, and dependable performance in continuous manufacturing environments continue to support widespread adoption across diverse industrial applications.
North America Inline Camera Inspection Market accounted for 29.8% share in 2025. Regional growth is supported by increasing investments in industrial automation, greater adoption of smart manufacturing technologies, and rising demand for consistent product quality across manufacturing industries. Government initiatives encouraging digital transformation and advanced manufacturing practices continue to accelerate the deployment of machine vision technologies. Growing implementation of Industry 4.0 solutions is further driving demand for high-speed inline inspection systems capable of improving production efficiency, reducing quality-related defects, and supporting automated manufacturing operations.
Major companies operating in the global inline camera inspection market include Antares Vision S.p.A., Baumer Group, Cognex Corporation, IMAGO Technologies GmbH, Keyence Corporation, Mettler Toledo International Inc., OMRON Corporation, OPTEL Group, SEA Vision S.r.l., SICK AG, Syntegon Technology GmbH, Teledyne Technologies Inc., Videojet Technologies Inc., and VITRONIC GmbH. innovation, continuous technology advancement, and expanding automation capabilities to strengthen their competitive position. Manufacturers invest significantly in research and development to improve image-processing accuracy, artificial intelligence integration, and inspection speed while meeting evolving industrial requirements. Strategic partnerships, collaborations, and technology alliances help companies broaden their customer base and accelerate solution adoption across multiple manufacturing sectors. Businesses also prioritize expanding production capacity, strengthening global distribution networks, and enhancing after-sales support to improve customer satisfaction. In addition, mergers, acquisitions, and portfolio diversification enable market participants to strengthen technological expertise, enter new regional markets, and deliver comprehensive inspection solutions that support higher productivity, improved quality control, and long-term operational efficiency across modern manufacturing environments.
Table of Contents
Chapter 1 Methodology and Scope
- 1.1 Market scope and definition
- 1.2 Research design
- 1.2.1 Research approach
- 1.2.2 Data collection methods
- 1.3 Data mining sources
- 1.3.1 Global
- 1.3.2 Regional/Country
- 1.4 Base estimates and calculations
- 1.4.1 Base year calculation
- 1.4.2 Key trends for market estimation
- 1.5 Primary research and validation
- 1.5.1 Primary sources
- 1.6 Forecast model
- 1.7 Research assumptions and limitations
Chapter 2 Executive Summary
- 2.1 Industry 360° synopsis, 2022 - 2035
- 2.2 Key market trends
- 2.2.1 System architecture trends
- 2.2.2 Imaging technology trends
- 2.2.3 Application trends
- 2.2.4 End-use industry trends
- 2.2.5 Regional trends
- 2.3 TAM Analysis, 2026-2035
- 2.4 CXO perspectives: Strategic imperatives
Chapter 3 Industry Insights
- 3.1 Industry ecosystem analysis
- 3.1.1 Supplier Landscape
- 3.1.2 Profit Margin
- 3.1.3 Cost structure
- 3.1.4 Value addition at each stage
- 3.1.5 Factor affecting the value chain
- 3.1.6 Disruptions
- 3.2 Industry impact forces
- 3.2.1 Growth drivers
- 3.2.1.1 Increasing adoption of Industry 4.0 and smart manufacturing initiatives
- 3.2.1.2 Rising demand for AI-powered automated quality inspection
- 3.2.1.3 Expansion of semiconductor and electronics manufacturing
- 3.2.1.4 Growing investments in electric vehicle (EV) battery manufacturing
- 3.2.1.5 Stringent quality and traceability regulations across pharmaceutical, food & beverage, and medical device industries
- 3.2.2 Industry pitfalls and challenges
- 3.2.2.1 High initial investment and system integration costs
- 3.2.2.2 Complex deployment in high-speed and diverse production environments
- 3.2.3 Market opportunities
- 3.2.3.1 Expansion of AI and deep learning-based machine vision technologies
- 3.2.3.2 Growing adoption in EV battery, semiconductor, and pharmaceutical manufacturing
- 3.2.1 Growth drivers
- 3.3 Growth potential analysis
- 3.4 Regulatory landscape
- 3.4.1 North America
- 3.4.2 Europe
- 3.4.3 Asia Pacific
- 3.4.4 Latin America
- 3.4.5 Middle East & Africa
- 3.5 Porter's analysis
- 3.6 PESTEL analysis
- 3.7 Technology and Innovation landscape
- 3.7.1 Current technological trends
- 3.7.2 Emerging technologies
- 3.8 Price trends
- 3.8.1 By region
- 3.8.2 By product
- 3.9 Pricing Strategies
- 3.10 Emerging Business Models
- 3.11 Compliance Requirements
- 3.12 Patent and IP analysis
Chapter 4 Competitive Landscape, 2025
- 4.1 Introduction
- 4.2 Company market share analysis
- 4.2.1 By region
- 4.2.1.1 North America
- 4.2.1.2 Europe
- 4.2.1.3 Asia Pacific
- 4.2.1.4 Latin America
- 4.2.1.5 Middle East & Africa
- 4.2.2 Market concentration analysis
- 4.2.1 By region
- 4.3 Competitive benchmarking of key players
- 4.3.1 Financial performance comparison
- 4.3.1.1 Revenue
- 4.3.1.2 Profit margin
- 4.3.1.3 R&D
- 4.3.2 Product portfolio comparison
- 4.3.2.1 Product range breadth
- 4.3.2.2 Technology
- 4.3.2.3 Innovation
- 4.3.3 Geographic presence comparison
- 4.3.3.1 Global footprint analysis
- 4.3.3.2 Service network coverage
- 4.3.3.3 Market penetration by region
- 4.3.4 Competitive positioning matrix
- 4.3.4.1 Leaders
- 4.3.4.2 Challengers
- 4.3.4.3 Followers
- 4.3.4.4 Niche players
- 4.3.5 Strategic outlook matrix
- 4.3.1 Financial performance comparison
- 4.4 Key developments
- 4.4.1 Mergers and acquisitions
- 4.4.2 Partnerships and collaborations
- 4.4.3 Technological advancements
- 4.4.4 Expansion and investment strategies
- 4.4.5 Digital transformation initiatives
- 4.5 Emerging/ startup competitors landscape
Chapter 5 Market Estimates and Forecast, By System Architecture, 2022 - 2035 (USD Million)
- 5.1 Key trends
- 5.2 Smart camera inspection systems
- 5.3 Pc-based camera inspection systems
- 5.4 Embedded vision inspection systems
Chapter 6 Market Estimates and Forecast, By Imaging Technology, 2022 - 2035 (USD Million)
- 6.1 Key trends
- 6.2 2D inspection systems
- 6.3 3D inspection systems
Chapter 7 Market Estimates and Forecast, By Application, 2022 - 2035 (USD Million)
- 7.1 Key trends
- 7.2 Foreign material & contamination detection
- 7.3 Visual defect detection
- 7.4 Dimensional measurement & verification
- 7.5 Identification, verification & traceability
- 7.6 Packaging integrity & seal inspection
- 7.7 Others
Chapter 8 Market Estimates and Forecast, By End-Use Industry, 2022 - 2035 (USD Million)
- 8.1 Key trends
- 8.2 Food & beverage
- 8.3 Pharmaceuticals & biotech
- 8.4 Automotive
- 8.5 Electronics & semiconductors
- 8.6 Medical devices
- 8.7 Consumer goods & personal care
- 8.8 Others
Chapter 9 Market Estimates and Forecast, By Region, 2022 - 2035 (USD Million)
- 9.1 Key trends
- 9.2 North America
- 9.2.1 U.S.
- 9.2.2 Canada
- 9.3 Europe
- 9.3.1 Germany
- 9.3.2 UK
- 9.3.3 France
- 9.3.4 Spain
- 9.3.5 Italy
- 9.4 Asia Pacific
- 9.4.1 China
- 9.4.2 India
- 9.4.3 Japan
- 9.4.4 Australia
- 9.4.5 South Korea
- 9.5 Latin America
- 9.5.1 Brazil
- 9.5.2 Mexico
- 9.5.3 Argentina
- 9.6 Middle East and Africa
- 9.6.1 South Africa
- 9.6.2 Saudi Arabia
- 9.6.3 UAE
Chapter 10 Company Profiles
- 10.1 Global Key Players
- 10.1.1 Keyence Corporation
- 10.1.2 Cognex Corporation
- 10.1.3 Teledyne Technologies Inc.
- 10.1.4 SICK AG
- 10.1.5 OMRON Corporation
- 10.2 Regional key players
- 10.2.1 North America
- 10.2.1.1 Mettler Toledo International Inc.
- 10.2.1.2 Videojet Technologies Inc.
- 10.2.1.3 OPTEL Group
- 10.2.2 Europe
- 10.2.2.1 Syntegon Technology GmbH
- 10.2.2.2 Baumer Group
- 10.2.2.3 Antares Vision S.p.A.
- 10.2.2.4 VITRONIC GmbH
- 10.2.1 North America
- 10.3 Niche Players/Disruptors
- 10.3.1 SEA Vision S.r.l.
- 10.3.2 IMAGO Technologies GmbH

