
PUBLISHER: Global Market Insights Inc. | PRODUCT CODE: 1716641

PUBLISHER: Global Market Insights Inc. | PRODUCT CODE: 1716641
Home Standby Gensets Market Opportunity, Growth Drivers, Industry Trend Analysis, and Forecast 2025 - 2034
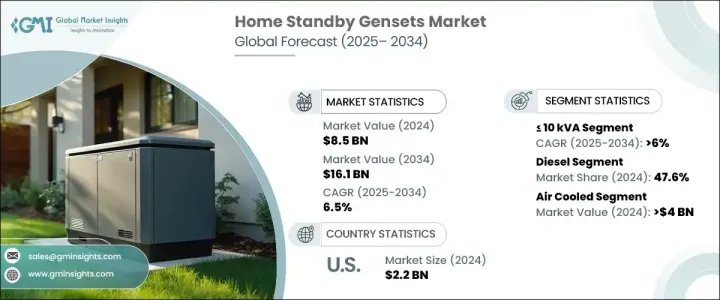
The Global Home Standby Gensets Market was valued at USD 8.5 billion in 2024 and is projected to grow at a 6.5% CAGR between 2025 and 2034. The demand for reliable backup power systems is rising as residential construction expands, particularly in single-family and multifamily homes. With increasing concerns over grid reliability, homeowners are prioritizing solutions that ensure uninterrupted power during outages. The growing frequency of extreme weather events, from hurricanes to snowstorms, is further driving the adoption of standby generators.
Urbanization trends are also playing a crucial role in market growth, as densely populated areas face higher risks of power disruptions. Consumers are increasingly looking for advanced features such as remote monitoring and automatic transfer switches, making modern home standby gensets more attractive than ever. Furthermore, innovations in fuel efficiency, reduced noise levels, and extended runtimes are influencing purchasing decisions. As environmental regulations tighten, manufacturers are focusing on sustainability by shifting towards cleaner fuel sources, including natural gas and propane, reinforcing long-term market growth.
| Market Scope | |
|---|---|
| Start Year | 2024 |
| Forecast Year | 2025-2034 |
| Start Value | $8.5 Billion |
| Forecast Value | $16.1 Billion |
| CAGR | 6.5% |
The home standby gensets market, with a power rating of <= 10 kVA, is expected to grow at a 6% CAGR by 2034. These compact and lightweight units offer unmatched versatility for homeowners, providing essential backup power without occupying significant space. With modern households relying on multiple appliances, from HVAC systems to home entertainment setups, demand for efficient, space-saving gensets continues to rise. Their portability and ease of maintenance add to their appeal, making them an ideal choice for a broad consumer base. As technology advances, these smaller gensets are becoming more efficient and capable, meeting evolving residential power demands while maintaining cost-effectiveness.
The demand for gas-powered home standby gensets is expected to generate USD 6 billion by 2034. The rising availability of natural gas, coupled with government policies promoting lower carbon emissions, is accelerating adoption. Gas-powered gensets offer a major advantage by connecting directly to municipal gas lines, ensuring a constant and reliable fuel supply. Unlike diesel generators, these units produce fewer emissions and require less maintenance, making them a preferred choice among environmentally conscious consumers. As homeowners increasingly prioritize sustainability and long-term cost savings, gas-powered generators will continue to dominate the market, backed by ongoing technological enhancements in fuel efficiency and automation.
U.S. home standby gensets market generated USD 2.2 billion in 2024. With more homeowners upgrading their properties to incorporate advanced electrical systems, the need for robust backup power solutions is growing. The increasing number of home-based businesses and remote work setups has also contributed to higher demand for uninterrupted power supply. Additionally, the adoption of smart home technology and high-power appliances has led to greater reliance on gensets as a safeguard against power outages. As the industry evolves, innovations in noise reduction, fuel efficiency, and smart connectivity are shaping consumer preferences, driving further investment and market expansion.
Table of Contents
Chapter 1 Methodology & Scope
- 1.1 Market scope & definitions
- 1.2 Market estimates & forecast parameters
- 1.3 Forecast calculation
- 1.4 Data sources
- 1.4.1 Primary
- 1.4.2 Secondary
- 1.4.2.1 Paid
- 1.4.2.2 Public
Chapter 2 Executive Summary
- 2.1 Industry synopsis, 2021 - 2034
Chapter 3 Industry Insights
- 3.1 Industry ecosystem analysis
- 3.2 Regulatory landscape
- 3.3 Industry impact forces
- 3.3.1 Growth drivers
- 3.3.2 Industry pitfalls & challenges
- 3.4 Growth potential analysis
- 3.5 Porter's analysis
- 3.5.1 Bargaining power of suppliers
- 3.5.2 Bargaining power of buyers
- 3.5.3 Threat of new entrants
- 3.5.4 Threat of substitutes
- 3.6 PESTEL Analysis
Chapter 4 Competitive Landscape, 2025
- 4.1 Introduction
- 4.2 Strategic outlook
- 4.3 Innovation & sustainability landscape
Chapter 5 Market Size and Forecast, By Power Rating, 2021 - 2034 (USD Million & '000 Units)
- 5.1 Key trends
- 5.2 ≤ 10 kVA
- 5.3 > 10 kVA - 50 kVA
- 5.4 > 50 kVA - 100 kVA
- 5.5 > 100 kVA
Chapter 6 Market Size and Forecast, By Fuel, 2021 - 2034 (USD Million & '000 Units)
- 6.1 Key trends
- 6.2 Diesel
- 6.3 Gas
- 6.4 Others
Chapter 7 Market Size and Forecast, By Phase, 2021 - 2034 (USD Million & '000 Units)
- 7.1 Key trends
- 7.2 Single phase
- 7.3 Three phase
Chapter 8 Market Size and Forecast, By Product, 2021 - 2034 (USD Million & '000 Units)
- 8.1 Key trends
- 8.2 Air cooled
- 8.3 Liquid cooled
Chapter 9 Market Size and Forecast, By Region, 2021 - 2034 (USD Million & '000 Units)
- 9.1 Key trends
- 9.2 North America
- 9.2.1 U.S.
- 9.2.2 Canada
- 9.3 Europe
- 9.3.1 Russia
- 9.3.2 UK
- 9.3.3 Germany
- 9.3.4 France
- 9.3.5 Spain
- 9.3.6 Austria
- 9.3.7 Italy
- 9.4 Asia Pacific
- 9.4.1 China
- 9.4.2 Australia
- 9.4.3 India
- 9.4.4 Japan
- 9.4.5 South Korea
- 9.4.6 Indonesia
- 9.4.7 Malaysia
- 9.4.8 Thailand
- 9.4.9 Vietnam
- 9.4.10 Philippines
- 9.5 Middle East
- 9.5.1 Saudi Arabia
- 9.5.2 UAE
- 9.5.3 Qatar
- 9.5.4 Turkey
- 9.5.5 Iran
- 9.5.6 Oman
- 9.6 Africa
- 9.6.1 Egypt
- 9.6.2 Nigeria
- 9.6.3 Algeria
- 9.6.4 South Africa
- 9.6.5 Angola
- 9.6.6 Kenya
- 9.6.7 Mozambique
- 9.7 Latin America
- 9.7.1 Brazil
- 9.7.2 Mexico
- 9.7.3 Argentina
- 9.7.4 Chile
Chapter 10 Company Profiles
- 10.1 Ashok Leyland
- 10.2 Briggs and Stratton
- 10.3 Caterpillar
- 10.4 Champion Power Equipment
- 10.5 Cummins
- 10.6 Eaton
- 10.7 Echo Group
- 10.8 Generac Power Systems
- 10.9 Gillette Generators
- 10.10 HIMOINSA
- 10.11 Hipower
- 10.12 Kirloskar
- 10.13 Mahindra Powerol
- 10.14 Pinnacle Generators
- 10.15 Powerica
- 10.16 PR Industrial
- 10.17 Rehlko
- 10.18 Sichuan Xinyici Power Machinery

