
PUBLISHER: Global Market Insights Inc. | PRODUCT CODE: 1766305

PUBLISHER: Global Market Insights Inc. | PRODUCT CODE: 1766305
Digital Oilfield Market Opportunity, Growth Drivers, Industry Trend Analysis, and Forecast 2025 - 2034
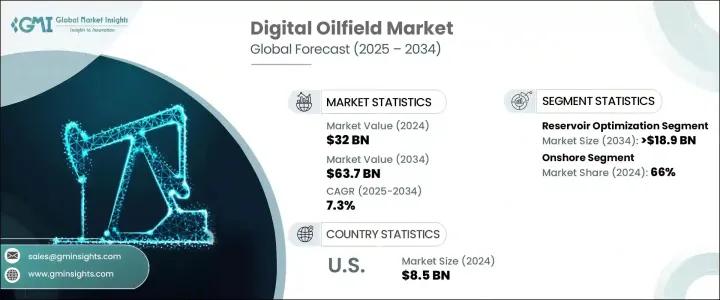
The Global Digital Oilfield Market was valued at USD 32 billion in 2024 and is estimated to grow at a CAGR of 7.3% to reach USD 63.7 billion by 2034. This growth is largely driven by the increasing push for streamlined operations, faster decision-making, and heightened safety protocols across upstream and midstream oil and gas sectors. The ongoing shift to smart technologies-such as artificial intelligence, the Internet of Things (IoT), and cloud platforms-is transforming traditional practices into automated, predictive, and data-rich systems.
With real-time analytics and remote access becoming central to operations, companies are harnessing centralized control systems to improve uptime and asset utilization. Enhanced productivity, operational agility, and cost optimization remain key benefits fueling this transformation. In the face of fluctuating oil prices, aging equipment, climate concerns, and mounting regulatory pressures, the industry's digital shift continues to gain traction. However, the widespread implementation of digital oilfield solutions still encounters resistance due to steep initial investments, cybersecurity vulnerabilities, and legacy cultures that are slow to embrace innovation.
| Market Scope | |
|---|---|
| Start Year | 2024 |
| Forecast Year | 2025-2034 |
| Start Value | $32 billion |
| Forecast Value | $63.7 billion |
| CAGR | 7.3% |
Reservoir optimization is projected to reach USD 18.9 billion by 2034, as oilfield operators lean into artificial intelligence and machine learning to deliver high-precision modeling and resource allocation. Real-time data is leveraged to automate performance analytics and enhance recovery strategies while reducing production costs. The emphasis on maximizing reservoir output without sacrificing operational efficiency is expected to keep this segment at the forefront of the market.
Onshore deployment accounted for a 66% share in 2024 and is forecasted to grow at a CAGR of 7% through 2034. Onshore sites benefit from greater access to existing infrastructure, more manageable costs, and fewer regulatory complications, which accelerates the uptake of digital platforms. Enhanced monitoring and analytics tools are improving environmental performance and operational output. Offshore sites, despite being more remote and exposed to tougher conditions, are gradually adopting digitalization to simplify operations and increase reliability.
United States Digital Oilfield Market was valued at USD 8.5 billion in 2024 and is estimated to reach USD 17 billion by 2034, driven by a strong drive to modernize aging infrastructures and adopt cost-saving innovations. With regulatory support and increased capital directed toward digital transformation, companies in the US are prioritizing efficiency and sustainability. The nation's mature oil and gas ecosystem continues to embrace digital tools that reduce downtime and improve system responsiveness.
Key companies active in the Digital Oilfield Market include General Electric, Digi International, Siemens, Rockwell Automation, Kuwait Oil Company, Honeywell International, EDG, Intel Corporation, National Oilwell Varco, Saudi Arabian Oil Company (Saudi Aramco), Cisco Systems, Accenture, ABB, Enovate Upstream, Infosys Limited, Emerson Electric, OleumTech, Pason Systems, Schneider Electric, Halliburton, WEG, CGG, Sinopec Oilfield Service Corporation, SLB, Weatherford, Katalyst Data Management, Aviat Networks, and Wipro. Leading players are heavily investing in AI and machine learning to improve predictive analytics and reduce unplanned downtime. Strategic collaborations with tech firms allow for seamless integration of IoT, cloud, and SCADA systems across field operations. Companies are also prioritizing cybersecurity upgrades to safeguard data and infrastructure. Mergers and acquisitions are being used to expand digital portfolios and gain competitive advantage.
Table of Contents
Chapter 1 Methodology & Scope
- 1.1 Market definitions
- 1.2 Base estimates & calculations
- 1.3 Forecast calculation
- 1.4 Data sources
- 1.4.1 Primary
- 1.4.2 Secondary
- 1.4.2.1 Paid
- 1.4.2.2 Public
Chapter 2 Executive Summary
- 2.1 Industry synopsis, 2021 - 2034
Chapter 3 Industry Insights
- 3.1 Industry ecosystem analysis
- 3.2 Regulatory landscape
- 3.3 Industry impact forces
- 3.3.1 Growth drivers
- 3.3.2 Industry pitfalls & challenges
- 3.4 Growth potential analysis
- 3.5 Porter's analysis
- 3.5.1 Bargaining power of suppliers
- 3.5.2 Bargaining power of buyers
- 3.5.3 Threat of new entrants
- 3.5.4 Threat of substitutes
- 3.6 PESTEL analysis
Chapter 4 Competitive landscape, 2025
- 4.1 Introduction
- 4.2 Company market share analysis, 2024
- 4.3 Strategic initiatives
- 4.4 Competitive benchmarking
- 4.5 Innovation & technology landscape
Chapter 5 Market Size and Forecast, By Process, 2021 - 2034 (USD Million)
- 5.1 Key trends
- 5.2 Production optimization
- 5.3 Reservoir optimization
- 5.4 Drilling optimization
- 5.5 Others
Chapter 6 Market Size and Forecast, By Service, 2021 - 2034 (USD Million)
- 6.1 Key trends
- 6.2 Instrumentation & automation
- 6.2.1 Security systems
- 6.2.2 Smart wells
- 6.2.3 Wireless systems
- 6.2.4 Distributed control system
- 6.2.5 SCADA
- 6.3 Information technology
- 6.3.1 Software
- 6.3.2 Computer equipment & application hardware
- 6.3.3 IT outsourcing services
- 6.3.4 Others
Chapter 7 Market Size and Forecast, By Application, 2021 - 2034 (USD Million)
- 7.1 Key trends
- 7.2 Onshore
- 7.3 Offshore
Chapter 8 Market Size and Forecast, By Technology, 2021 - 2034 (USD Million)
- 8.1 Key trends
- 8.2 IoT
- 8.3 Advance analytics
- 8.4 Robotics
- 8.5 Cloud computing
- 8.6 Mobility
- 8.7 Others
Chapter 9 Market Size and Forecast, By Region, 2021 - 2034 (USD Million)
- 9.1 Key trends
- 9.2 North America
- 9.2.1 U.S.
- 9.2.2 Canada
- 9.2.3 Mexico
- 9.3 Europe
- 9.3.1 Russia
- 9.3.2 Norway
- 9.3.3 UK
- 9.3.4 Denmark
- 9.3.5 Italy
- 9.3.6 Germany
- 9.3.7 Netherlands
- 9.3.8 France
- 9.4 Asia Pacific
- 9.4.1 China
- 9.4.2 India
- 9.4.3 Indonesia
- 9.4.4 Malaysia
- 9.4.5 Thailand
- 9.4.6 Australia
- 9.5 Middle East & Africa
- 9.5.1 Saudi Arabia
- 9.5.2 Iraq
- 9.5.3 Kuwait
- 9.5.4 UAE
- 9.5.5 Qatar
- 9.5.6 Oman
- 9.5.7 Nigeria
- 9.5.8 South Africa
- 9.6 Latin America
- 9.6.1 Brazil
- 9.6.2 Argentina
Chapter 10 Company Profiles
- 10.1 ABB
- 10.2 Accenture
- 10.3 Aviat Networks
- 10.4 CGG
- 10.5 Cisco Systems
- 10.6 Digi International
- 10.7 EDG
- 10.8 Emerson Electric
- 10.9 Enovate Upstream
- 10.10 General Electric
- 10.11 Halliburton
- 10.12 Honeywell International
- 10.13 Infosys Limited
- 10.14 Intel Corporation
- 10.15 Katalyst Data Management
- 10.16 Kuwait Oil Company
- 10.17 National Oilwell Varco
- 10.18 OleumTech.
- 10.19 Pason Systems
- 10.20 Rockwell Automation
- 10.21 Saudi Arabian Oil Company (Saudi Aramco)
- 10.22 Schneider Electric
- 10.23 Siemens
- 10.24 Sinopec Oilfield Service Corporation
- 10.25 SLB
- 10.26 Weatherford
- 10.27 WEG
- 10.28 Wipro

