
PUBLISHER: Global Market Insights Inc. | PRODUCT CODE: 1699280

PUBLISHER: Global Market Insights Inc. | PRODUCT CODE: 1699280
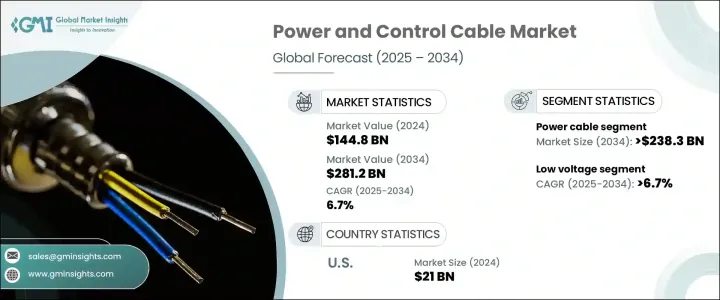
Power and Control Cable Market Opportunity, Growth Drivers, Industry Trend Analysis, and Forecast 2025-2034
The Global Power And Control Cable Market reached USD 144.8 billion in 2024 and is projected to grow at a CAGR of 6.7% between 2025 and 2034. The market is witnessing robust growth driven by increasing demand across industrial, commercial, and utility sectors. The global push for infrastructure development, rapid urbanization, and the rising need for efficient electricity distribution are fueling expansion. Governments worldwide are investing heavily in large-scale power transmission projects to enhance grid efficiency and meet growing energy demands. The shift toward smart cities and automation in industries is further accelerating demand for advanced cabling solutions, ensuring seamless power delivery and control across various applications.
With the rise of renewable energy installations, power and control cables play a critical role in integrating wind, solar, and hydroelectric power sources into the grid. The global energy transition is prompting utilities to upgrade aging electrical networks and deploy high-performance cables for improved transmission efficiency. Additionally, the increasing electrification of transportation, including the expansion of electric vehicle (EV) charging networks, is boosting market prospects. Developing economies, particularly in Asia-Pacific, are witnessing a surge in investments in electrical infrastructure, strengthening demand for power and control cables.
| Market Scope | |
|---|---|
| Start Year | 2024 |
| Forecast Year | 2025-2034 |
| Start Value | $144.8 Billion |
| Forecast Value | $281.2 Billion |
| CAGR | 6.7% |
The power cable segment is expected to generate USD 238.3 billion by 2034, driven by the rapid adoption of renewable energy. The transition to cleaner energy sources requires durable and high-capacity cables capable of transmitting electricity efficiently from renewable power plants to end users. Governments are prioritizing energy sustainability and investing in modern grid infrastructure to accommodate rising renewable energy output. This shift is driving the deployment of advanced power cables designed to minimize transmission losses and enhance grid stability.
Based on voltage, the low-voltage cable segment is set to grow at a CAGR of 6.7% through 2034, supported by the rapid expansion of urban centers and increasing construction activities. The growing demand for smart buildings, intelligent power management systems, and energy-efficient electrical networks is propelling the need for flexible and durable low-voltage cables. As urban landscapes evolve, infrastructure projects integrating modern electrical solutions are reinforcing the demand for high-quality wiring systems. Governments and private investors are channeling significant funds into power distribution networks, ensuring the seamless transmission of electricity across residential, commercial, and industrial sectors.
The U.S. power and control cable market reached USD 21 billion in 2024 and is set for sustained expansion as the country modernizes its electrical grid. Federal and state-level investments in grid resilience, smart transmission infrastructure, and renewable energy integration are playing a pivotal role in market growth. The rising focus on strengthening overhead electrical infrastructure-including transmission lines, poles, and support structures-is enhancing the reliability and capacity of power distribution systems. As electricity consumption continues to rise, ongoing advancements in electrical grid technology and modernization efforts are ensuring long-term industry stability, enabling efficient power transmission and distribution nationwide.
Table of Contents
Chapter 1 Methodology & Scope
- 1.1 Market definitions
- 1.2 Base estimates & calculations
- 1.3 Forecast calculation
- 1.4 Data sources
- 1.4.1 Primary
- 1.4.2 Secondary
- 1.4.2.1 Paid
- 1.4.2.2 Public
Chapter 2 Executive Summary
- 2.1 Industry synopsis, 2021 - 2034
Chapter 3 Industry Insights
- 3.1 Industry ecosystem analysis
- 3.2 Regulatory landscape
- 3.3 Industry impact forces
- 3.3.1 Growth drivers
- 3.3.2 Industry pitfalls & challenges
- 3.4 Growth potential analysis
- 3.5 Porter's analysis
- 3.5.1 Bargaining power of suppliers
- 3.5.2 Bargaining power of buyers
- 3.5.3 Threat of new entrants
- 3.5.4 Threat of substitutes
- 3.6 PESTEL analysis
Chapter 4 Competitive landscape, 2024
- 4.1 Strategic dashboard
- 4.2 Innovation & sustainability landscape
Chapter 5 Market Size and Forecast, By Product, 2021 – 2034 (USD Million)
- 5.1 Key trends
- 5.2 Power cable
- 5.3 Control cable
Chapter 6 Market Size and Forecast, By Voltage 2021 – 2034 (USD Million)
- 6.1 Key trends
- 6.2 Low voltage
- 6.2.1 LV power
- 6.2.2 LV control
- 6.3 Medium voltage
- 6.4 High voltage
Chapter 7 Market Size and Forecast, By Application 2021 – 2034 (USD Million)
- 7.1 Key trends
- 7.2 Utilities
- 7.3 Industries
- 7.3.1 Oil & Gas
- 7.3.2 Cement
- 7.3.3 Others
Chapter 8 Market Size and Forecast, By Region, 2021 – 2034 (USD Million)
- 8.1 Key trends
- 8.2 North America
- 8.2.1 U.S.
- 8.2.2 Canada
- 8.2.3 Mexico
- 8.3 Europe
- 8.3.1 UK
- 8.3.2 France
- 8.3.3 Netherlands
- 8.3.4 Italy
- 8.3.5 Spain
- 8.3.6 Germany
- 8.3.7 Russia
- 8.4 Asia Pacific
- 8.4.1 China
- 8.4.2 India
- 8.4.3 Japan
- 8.4.4 South Korea
- 8.4.5 Australia
- 8.5 Middle East & Africa
- 8.5.1 Saudi Arabia
- 8.5.2 UAE
- 8.5.3 Qatar
- 8.5.4 Kuwait
- 8.5.5 South Africa
- 8.5.6 Egypt
- 8.6 Latin America
- 8.6.1 Brazil
- 8.6.2 Argentina
- 8.6.3 Peru
Chapter 9 Company Profiles
- 9.1 Bergen Cable Technology
- 9.2 Belden Inc.
- 9.3 FURUKAWA ELECTRIC CO., LTD.
- 9.4 Havells India Ltd
- 9.5 KEI Industries Limited
- 9.6 Klaus Faber AG
- 9.7 LS Cables
- 9.8 Leoni Cables
- 9.9 NKT A/S
- 9.10 Polycab
- 9.11 Prysmian Group
- 9.12 RR Kabel
- 9.13 Riyadh Cables
- 9.14 Sumitomo Electric Industries, Ltd.
- 9.15 Southwire Company LLC
- 9.16 Top Cables
- 9.17 Thermo Cables
- 9.18 ZM Cables

