
PUBLISHER: Global Market Insights Inc. | PRODUCT CODE: 1740971

PUBLISHER: Global Market Insights Inc. | PRODUCT CODE: 1740971
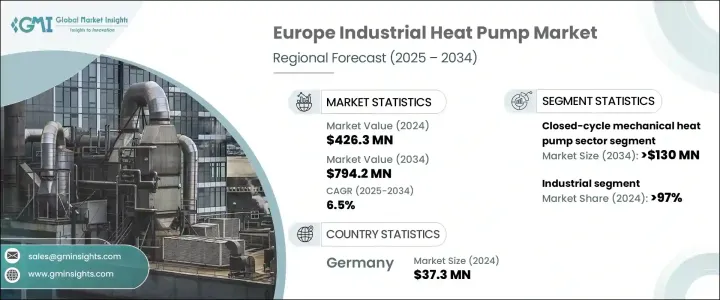
Europe Industrial Heat Pump Market Opportunity, Growth Drivers, Industry Trend Analysis, and Forecast 2025 - 2034
Europe Industrial Heat Pump Market was valued at USD 426.3 million in 2024 and is estimated to grow at a CAGR of 6.5% to reach USD 794.2 million by 2034, propelled by the rising demand for energy-efficient heating solutions, as industries seek to minimize energy consumption and operational costs. The market is witnessing strong momentum as businesses across Europe are actively looking for ways to decarbonize operations while maintaining cost efficiency and complying with evolving environmental regulations. The push toward net-zero goals, coupled with soaring energy prices, is prompting industries to embrace advanced heating technologies that can deliver long-term economic and ecological benefits. Industrial heat pumps are gaining significant traction, as they support sustainability goals and align with government directives aimed at reducing greenhouse gas emissions. The integration of heat pump systems not only helps improve energy performance but also enables businesses to meet corporate sustainability benchmarks, creating long-term value for both businesses and stakeholders. Growing adoption across sectors such as food and beverage, chemical processing, and pharmaceuticals is accelerating market expansion, while advances in industrial automation and smart energy management are further boosting demand.
In addition to the economic benefits, stringent regulatory policies that promote sustainability are playing a crucial role in encouraging businesses to adopt energy-efficient technologies, including industrial heat pumps. These regulations, often centered on cutting emissions and boosting energy efficiency, are pushing industries to adopt solutions that align with their environmental strategies. Industrial heat pumps offer a dependable route to achieving these objectives, helping businesses remain competitive in a carbon-conscious economy.
| Market Scope | |
|---|---|
| Start Year | 2024 |
| Forecast Year | 2025-2034 |
| Start Value | $426.3 Million |
| Forecast Value | $794.2 Million |
| CAGR | 6.5% |
Moreover, the ongoing shift toward low-carbon industrial operations is playing a key role in accelerating the adoption of energy-efficient heating technologies. As industrial facilities face growing pressure to curb emissions and hit sustainability targets, heat pumps are proving to be a highly effective tool. These systems not only deliver efficient heating and cooling but also recover and repurpose waste heat-resulting in lower overall energy use and fewer emissions. This dual functionality makes heat pumps a cornerstone of sustainable industrial strategies across Europe.
The industrial segment is set to dominate the market, accounting for 97% of the total share in 2024, and is expected to maintain robust growth through 2034. Rising demand for energy-efficient heating and cooling systems in manufacturing, food processing, and pharmaceutical sectors is driving this momentum. Industrial heat pumps are becoming essential components in modern operations due to their ability to optimize energy use, enhance efficiency, and reduce costs. As sustainability and cost reduction remain top priorities for businesses, the demand for advanced heat pump solutions will only grow stronger over the coming years.
The closed-cycle mechanical heat pump category is projected to generate USD 130 million by 2034. This growth stems from rising demand across sectors such as manufacturing, chemical processing, and district heating. These systems are especially valued for their ability to deliver reliable, low-emission heating and cooling while recovering energy from waste heat sources. The environmental and operational benefits of this technology are making it a go-to choice for industries seeking sustainable performance without compromising output.
United Kingdom Industrial Heat Pump Market is expected to grow at a CAGR of 7% through 2034. Advancements in electrical heating systems are supporting this upward trend, while the pursuit of greater energy independence and the burden of rising energy prices are reinforcing the need for more efficient heating solutions. As industries in the UK look for ways to reduce operational expenses and environmental impact, heat pumps are emerging as a preferred option. Additionally, supportive government policies aimed at cutting emissions and expanding district heating infrastructure are set to fuel wider adoption across the country.
Key industry players operating in the Europe Industrial Heat Pump Market include AGO Energie + Anlagen, Atlas Copco, Carrier, Daikin Applied Europe, Danfoss, GEA Group, Heliotherm Warmepumpentechnik, Johnson Controls, MAN Energy Solutions, Ochsner, Oilon Group, Piller Blowers & Compressors, Siemens Energy, Swegon Group, Thermax, Trane, and Turboden. Leading companies are investing in R&D to boost product efficiency, forging strategic alliances to strengthen their market footprint, and pursuing acquisitions to expand their offerings. Many are also customizing solutions to meet the specific needs of various industries, enhancing satisfaction and long-term customer retention.
Table of Contents
Chapter 1 Methodology & Scope
- 1.1 Market definitions
- 1.2 Base estimates & calculations
- 1.3 Forecast calculation
- 1.4 Data sources
- 1.4.1 Primary
- 1.4.2 Secondary
- 1.4.2.1 Paid
- 1.4.2.2 Public
Chapter 2 Industry Insights
- 2.1 Industry ecosystem analysis
- 2.2 Trump administration tariffs analysis
- 2.2.1 Impact on trade
- 2.2.1.1 Trade volume disruptions
- 2.2.1.2 Retaliatory measures
- 2.2.2 Impact on the industry
- 2.2.2.1 Supply-side impact (raw materials)
- 2.2.2.1.1 Price volatility in key materials
- 2.2.2.1.2 Supply chain restructuring
- 2.2.2.1.3 Production cost implications
- 2.2.2.2 Demand-side impact (selling price)
- 2.2.2.2.1 Price transmission to end markets
- 2.2.2.2.2 Market share dynamics
- 2.2.2.2.3 Consumer response patterns
- 2.2.2.1 Supply-side impact (raw materials)
- 2.2.3 Key companies impacted
- 2.2.4 Strategic industry responses
- 2.2.4.1 Supply chain reconfiguration
- 2.2.4.2 Pricing and product strategies
- 2.2.4.3 Policy engagement
- 2.2.5 Outlook and future considerations
- 2.2.1 Impact on trade
- 2.3 Regulatory landscape
- 2.4 Industry impact forces
- 2.4.1 Growth drivers
- 2.4.2 Industry pitfalls & challenges
- 2.5 Growth potential analysis
- 2.6 Porter's Analysis
- 2.6.1 Bargaining power of suppliers
- 2.6.2 Bargaining power of buyers
- 2.6.3 Threat of new entrants
- 2.6.4 Threat of substitutes
- 2.7 PESTEL Analysis
Chapter 3 Competitive Landscape, 2024
- 3.1 Introduction
- 3.2 Strategic outlook
- 3.3 Innovation & sustainability landscape
Chapter 4 Market Size and Forecast, By Product, 2021 - 2034, (Units & USD Million)
- 4.1 Key trends
- 4.2 Air source
- 4.3 Ground source
- 4.4 Water source
- 4.5 Closed cycle mechanical heat pump
- 4.6 Open cycle mechanical vapor compression heat pump
- 4.7 Open cycle thermocompression heat pump
- 4.8 Closed cycle absorption heat pump
Chapter 5 Market Size and Forecast, By Capacity, 2021 - 2034, (Units & USD Million)
- 5.1 Key trends
- 5.2 Up to 500 kW
- 5.3 500 kW to 2 MW
- 5.4 2 MW - 5 MW
- 5.5 > 5 MW
Chapter 6 Market Size and Forecast, By Temperature, 2021 - 2034, (Units & USD Million)
- 6.1 Key trends
- 6.2 80°C - 100°C
- 6.3 100°C - 150°C
- 6.4 150°C - 200°C
- 6.5 > 200°C
Chapter 7 Market Size and Forecast, By Application, 2021 - 2034, (Units & USD Million)
- 7.1 Key trends
- 7.2 Industrial
- 7.2.1 Paper
- 7.2.2 Food & beverages
- 7.2.3 Chemical
- 7.2.4 Iron & steel
- 7.2.5 Machinery
- 7.2.6 Non-metallic minerals
- 7.2.7 Others
- 7.3 District Heating
Chapter 8 Market Size and Forecast, By Country, 2021 - 2034, (Units & USD Million)
- 8.1 Key trends
- 8.2 UK
- 8.3 Norway
- 8.4 Denmark
- 8.5 Finland
- 8.6 Sweden
- 8.7 Germany
- 8.8 Poland
- 8.9 Spain
- 8.10 Austria
Chapter 9 Company Profiles
- 9.1 AGO Energie + Anlagen
- 9.2 Atlas Copco
- 9.3 Carrier
- 9.4 Daikin Applied Europe
- 9.5 Danfoss
- 9.6 GEA Group
- 9.7 Heliotherm Warmepumpentechnik
- 9.8 Johnson Controls
- 9.9 MAN Energy Solutions
- 9.10 Ochsner
- 9.11 Oilon Group
- 9.12 Piller Blowers & Compressors
- 9.13 Siemens Energy
- 9.14 Swegon Group
- 9.15 Thermax
- 9.16 Trane
- 9.17 Turboden

