
PUBLISHER: Industry Experts | PRODUCT CODE: 1767029

PUBLISHER: Industry Experts | PRODUCT CODE: 1767029
Natural Source Vitamin E (Tocopherols and Tocotrienols) - A Global Market Overview
Global Natural Source Vitamin E Market Trends and Outlook
| Key Metrics | |
|---|---|
| Historical Period: | 2021-2023 |
| Base Year: | 2024 |
| Forecast Period: | 2024-2030 |
| Units: | Volume in Metric Tons and Value market in US$ |
| Companies Mentioned: | 38 |
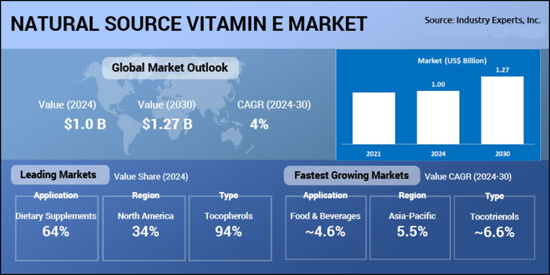
The global natural vitamin E market is undergoing a steady evolution, propelled by shifting consumer preferences toward clean-label nutrition, growing interest in natural antioxidants, and tightening regulatory standards in fortified food and nutraceuticals. Derived primarily from vegetable oils, natural vitamin E, comprising tocopherols and tocotrienols, serves as a potent antioxidant with wide-ranging applications in dietary supplements, functional foods, personal care, and animal nutrition. After a brief contraction during 2023-2024 due to destocking and pricing normalization following post-pandemic disruptions, the market has returned to a growth trajectory. In 2024, global demand stood at just over US$1 billion. From this base, the market is expected to reach close to US$1.3 billion by 2030, growing at a compound annual rate of 4% in value.
INFOGRAPHICS
Demand for natural vitamin E in the dietary supplements industry experienced significant volatility in the aftermath of the COVID-19 pandemic. Following a period of strong growth driven by heightened interest in immunity-boosting formulations, particularly multivitamin combinations containing vitamin E and C, market momentum slowed sharply. In 2022, growth was limited to just 0.6%, and by 2023, global demand contracted by 4.4% in volume terms. The decline was most evident in developed regions, where consumer focus on immune health began to normalize and discretionary spending came under pressure. However, this softness was partially offset by growing interest in other health segments, such as brain and mood support, energy and stamina, and skin health. By 2024, the market began to show early signs of stabilization, as demand for immunity-supporting supplements steadied and broader wellness trends, especially holistic well-being and beauty-from-within, continued to drive interest in natural vitamin E formulations.
Natural vitamin E demand is largely anchored in the dietary supplement segment, with growing contributions from food fortification and skincare innovation. Clean-label positioning and rising consumer focus on immunity and healthy aging are reinforcing its importance across product categories. Meanwhile, tocotrienols, though smaller in share, are gaining visibility for their superior antioxidant efficacy and emerging clinical interest. Looking ahead, differentiated growth patterns are expected to define the global landscape. While tocopherols will continue to dominate by volume, tocotrienols will see faster adoption, especially in high-margin, innovation-driven sectors. Supported by favorable regulatory environments and shifting health-conscious lifestyles, the natural vitamin E market is well-positioned for long-term expansion across both developed and emerging economies.
Natural Source Vitamin E Regional Market Analysis
Between 2021 and 2024, the natural vitamin E market showed modest growth across most regions, impacted by inflation, high raw material costs, and post-pandemic demand correction. Asia-Pacific leads both in volume market share (36.4% in 2024) and growth rate, expanding at a CAGR of 5.2% between 2024 and 2030, driven by strong demand in dietary supplements and functional foods, particularly in China, India, and Southeast Asia. North America and Europe, though mature markets, are forecast to grow at more modest rates, supported by stable demand in health supplements and personal care. South America and the Rest of the World are emerging as growth frontiers. These regions are benefitting from expanding fortified food markets, increasing awareness about clean-label nutrition, and growing adoption of tocotrienols in cosmetics and wellness applications.
Natural Source Vitamin E Market Analysis by Type
Tocopherols continue to represent the dominant share of global natural vitamin E consumption, which cornered a share of 98.7% in 2024 and projected to progress at a CAGR of 3.7% over 2024-2030 outlook period. Their widespread use across dietary supplements, fortified foods, cosmetics, and animal feed underpins their leadership position in the market. While much smaller in scale, tocotrienols are gaining momentum as the fastest-growing type, expanding at an impressive CAGR of 6.4%. Growth is being fueled by their emerging applications in neuroprotection, cardiovascular health, and anti-inflammatory formulations, particularly in the high-value nutraceuticals segment.
Natural Source Vitamin E Market Analysis by End-use Application
In 2024, dietary supplements stood out as the dominant application in the global natural vitamin E market, accounting for approximately 61% of total volume. This segment is expected to maintain its lead through 2030, expanding at a CAGR of 3.5% and reaching nearly 11.8 thousand metric tons. The growth is primarily driven by consumers' increasing inclination toward preventive health, natural immunity boosters, and plant-derived antioxidants. Food & beverages, the second-largest segment, is growing at a faster 4.4% CAGR, supported by expanding fortification regulations and rising demand for functional foods in Asia-Pacific and emerging markets. Meanwhile, cosmetics & personal care applications are also witnessing healthy expansion. This growth is fueled by increased use of tocotrienol-rich formulations in anti-aging, skin-brightening, and antioxidant skincare products.
Natural Source Vitamin E Market Report Scope
This global report on Natural Source Vitamin E analyzes the global and regional market based on product types and end-use applications for the period 2021-2030 with projection from 2024 to 2030 in terms of volume in metric tons and value in US$. In addition to providing profiles of major companies operating in this space, the latest corporate and industrial developments have been covered to offer a clear panorama of how and where the market is progressing. The report also reveals latest production capacities of all players by plant location and region.
Natural Source Vitamin E Market by Geographic Region
- North America (The United States, Canada and Mexico)
- Europe (Germany, France, Italy, Spain, the Netherlands, the United Kingdom, and Rest of Europe)
- Asia-Pacific (China, Japan, India, and Rest of Asia-Pacific)
- South America (Brazil, Argentina, and Rest of South America)
- Rest of World
Natural Source Vitamin E Market by Type
- Tocopherols
- Tocotrienols
Natural Source Vitamin E Market by Application
- Animal Feed
- Dietary Supplements
- Food & Beverages
- Cosmetics
- Others (including pharmaceuticals, medical nutrition, and infant nutrition)
Major Market Players:
|
|
TABLE OF CONTENTS
PART A: GLOBAL MARKET PERSPECTIVE
1. INTRODUCTION
- 1.1. Application-Level Analysis
- 1.2. Regional Market Analysis
- 1.3. Product Type Insights
- 1.4. Overall Vitamin E Market At-a-Glance
- 1.5. Product Outline
- 1.5.1. What is Vitamin E?
- 1.5.2. Forms of Vitamin E
- 1.5.2.1. Synthetic Vitamin E
- 1.5.2.2. Natural Source Vitamin E
- 1.5.2.2.1. Tocopherols
- 1.5.2.2.2. Tocotrienols
- 1.5.2.2.3. Vitamin E TPGS (d-Alpha Tocopheryl Polyethylene Glycol 1000 Succinate)
- 1.5.3. Manufacturing Processes of Vitamin E
- 1.5.3.1. Synthetic Vitamin E
- 1.5.3.2. Natural Source Vitamin E
- 1.5.3.2.1. Tocopherols
- 1.5.3.2.2. Tocotrienols
- 1.5.4. Sources of Vitamin E
- 1.5.4.1. Food Sources
- 1.5.4.2. Dietary Supplements
- 1.5.5. Vitamin E Health Claims
- 1.5.5.1. Coronary Heart Disease
- 1.5.5.2. Cancer
- 1.5.5.3. Disorders of the Eyes
- 1.5.5.4. Cognitive Decline
- 1.5.5.5. Other Health Claims
- 1.5.6. End-Use Applications of Vitamin E
- 1.5.6.1. Animal Nutrition
- 1.5.6.2. Human Nutritional/Dietary Supplements
- 1.5.6.3. Functional Food and Beverages
- 1.5.6.4. Cosmetics
- 1.5.6.5. Other Applications
2. REGULATIONS FOR DIETARY SUPPLEMENTS AND INGREDIENTS
- 2.1. Ministry of Health Malaysia Approves Two Health Claims for Palm Tocotrienols
- 2.2. USDA Review Confirms Continued Use of Tocopherols in Organic Handling
- 2.3. FSSAI Sets Clear Limits on VitaminE Usage in Nutraceuticals and Health Supplements
- 2.4. Regulations for Dietary Supplements and Ingredients as per the US Food and Drug Administration (FDA)
- 2.4.1. Registration of Food Facilities
- 2.4.2. Notification Process for New Dietary Ingredients
- 2.5. FDA Changes Nutrition Facts Label on Food Packaging
- 2.5.1. FDA Guidance for Industry on Converting Units of Measure for Vitamin E
- 2.6. EFSA Scientific Opinion on the Tolerable Upper Intake Level for Vitamin E
- 2.7. European Union: Traceability and Labeling of GMOs
3. INDUSTRY LANDSCAPE
- 3.1. Global Vitamin E Production Capacities
- 3.1.1. Global Natural Vitamin E Tocopherols Capacity
- 3.1.2. Global Natural Vitamin E Tocotrienols Capacity
- 3.1.3. Production Capacity Lagging Behind Market Growth
- 3.2. Natural Vitamin E Tocopherols Manufacturers
- 3.2.1. ARCHER DANIELS MIDLAND COMPANY (UNITED STATES)
- 3.2.2. BTSA BIOTECNOLOGIAS APLICADAS SL (SPAIN)
- 3.2.3. COFCO BIOTECHNOLOGY CO., LTD. (CHINA)
- 3.2.4. DSM-FIRMENICH (SWITZERLAND)
- 3.2.5. ECA HEALTHCARE INC. (CHINA)
- 3.2.6. FAIRCHEM ORGANICS LIMITED (INDIA)
- 3.2.7. FENCHEM BIOTEK LTD (CHINA)
- 3.2.8. FUJIAN GLANNY BIO-ENGINEERING CO., LTD. (CHINA)
- 3.2.9. JIANGSU CONAT BIOLOGICAL PRODUCTS CO., LTD. (CHINA)
- 3.2.10. JIANGSU XIXIN VITAMIN CO., LTD. (CHINA)
- 3.2.11. JIANGSU YUEHONG BIO-TEC CO., LTD. (CHINA)
- 3.2.12. JIANGXI ATUREX CO LTD (CHINA)
- 3.2.13. J-OIL MILLS, INC. (JAPAN)
- 3.2.14. KENSING, LLC. (UNITED STATES)
- 3.2.14.1. Advanced Organic Materials S.A. (AOM S.A.) (Argentina)
- 3.2.14.2. Vitae Naturals S.A. (Spain)
- 3.2.15. MATRIX LIFE SCIENCE PVT. LTD. (INDIA)
- 3.2.16. MITSUBISHI-CHEMICAL FOODS CORPORATION (JAPAN)
- 3.2.16.1. Tama Biochemical Co Ltd (Japan)
- 3.2.17. NINGBO DAHONGYING BIO-ENGINEERING CO., LTD. (CHINA)
- 3.2.18. RIKEN VITAMIN CO LTD (JAPAN)
- 3.2.19. SHANDONG NEW ELEMENT BIOTECHNOLOGY CO., LTD. (CHINA)
- 3.2.20. VITA-SOLAR BIOTECHNOLOGY CO., LTD. (CHINA)
- 3.2.21. WILMAR INTERNATIONAL LIMITED (SINGAPORE)
- 3.2.22. XI'AN HEALTHFUL BIOTECHNOLOGY CO LTD (HSF) (CHINA)
- 3.2.23. YICHUN DAHAIGUI LIFE SCIENCE CO., LTD. (CHINA)
- 3.2.24. ZHEJIANG MEDICINE CO LTD (CHINA)
- 3.2.25. ZHEJIANG WORLDBESTVE BIOTECHNOLOGY CO LTD (CHINA)
- 3.3. Natural Vitamin E Tocotrienols Manufacturers
- 3.3.1. AMERICAN RIVER NUTRITION, INC. (UNITED STATES)
- 3.3.2. BEIJING GINGKO GROUP (CHINA)
- 3.3.3. EXCELVITE SDN. BHD (MALAYSIA)
- 3.3.4. KLK OLEO (DAVOS LIFE SCIENCE) (SINGAPORE)
- 3.3.5. MUSIM MAS GROUP (SINGAPORE)
- 3.3.6. ORYZA OIL & FAT CHEMICAL CO., LTD. (JAPAN)
- 3.3.7. PWANI OIL PRODUCTS LIMITED (KENYA)
- 3.3.8. PHYTOGAIA SDN. BHD. (MALAYSIA)
- 3.3.9. SD GUTHRIE INTERNATIONAL NUTRITION (MALAYSIA)
- 3.3.10. SOP NUTRACEUTICALS SDN. BHD. (MALAYSIA)
- 3.3.11. SUPERVITAMINS SDN. BHD. (MALAYSIA)
- 3.3.12. VANCE GROUP LTD. (SINGAPORE)
- 3.3.13. XI'AN HEALTHFUL BIOTECHNOLOGY CO LTD (HSF) (CHINA)
4. KEY BUSINESS TRENDS
- 4.1. June 2025
- 4.1.1. ADM Unveils New R&D Center in Switzerland
- 4.2. May 2025
- 4.2.1. Everwell Health Announces Acquisition of American River Nutrition
- 4.3. April 2025
- 4.3.1. Kensing Unveils Sustainable Vitamin E Product Sun E-R
- 4.4. March 2025
- 4.4.1. Shandong New Element Introduces Novel Breakthroughs at Food Ingredients China 2025
- 4.4.2. Louis Dreyfus Company Unveils new Plant-Based Vitamin E Product Line
- 4.5. January 2025
- 4.5.1. BTSA Introduces Tocobiol-R SF T70
- 4.6. December 2024
- 4.6.1. A.C. Grace Company Recognized by ConsumerLab.com for its UNIQUE E-R Mixed Tocopherols
- 4.7. September 2024
- 4.7.1. BRAND'S-R Bird's Nest Unveils Ready-to-Drink BRAND'S-R Bird's Nest with Vitamin E
- 4.8. August 2024
- 4.8.1. KK Oleo Announces Findings of Groundbreaking Study
- 4.9. July 2024
- 4.9.1. JOYL Announces Launch of New Product AJINOMOTO Health Plus
- 4.10. June 2024
- 4.10.1. Sawit Kinabalu to Pioneer Large-Scale Tocotrienol Production from Palm Oil Waste in Malaysia
- 4.11. May 2024
- 4.11.1. BGG Announces New Global Headquarters
- 4.11.2. Sime Darby Plantation Announces Name Change to SD Guthrie
- 4.12. April 2024
- 4.12.1. PhytoGaia Gains Recognition by NASC as Preferred Supplier Member
- 4.13. February 2024
- 4.13.1. The Body Shop Unveils Vitamin E Range in Sri Lanka
- 4.14. November 2023
- 4.14.1. ExcelVite Unveils Novel Pet Supplement EVFurryAid PRO
- 4.15. October 2023
- 4.15.1. Kensing Announces Acquisition of AOM
5. GLOBAL MARKET OVERVIEW
- 5.1. Global Natural Vitamin E Market Overview by End-use Application
- 5.1.1. Global Natural Vitamin E End-Use Application Market Overview by Geographic Region
- 5.1.1.1. Animal Feed
- 5.1.1.2. Dietary Supplements
- 5.1.1.3. Food & Beverages
- 5.1.1.4. Cosmetics & Personal Care
- 5.1.1.5. Other Applications
- 5.1.1. Global Natural Vitamin E End-Use Application Market Overview by Geographic Region
- 5.2. Global Natural Vitamin E Market Overview by Type
- 5.2.1. Natural Vitamin E - Tocopherols
- 5.2.1.1. Global Natural Vitamin E Tocopherols Market Overview by End-use Application
- 5.2.2. Natural Vitamin E - Tocotrienols
- 5.2.2.1. Global Natural Vitamin E Tocotrienols Market Overview by End-use Application
- 5.2.1. Natural Vitamin E - Tocopherols
PART B: REGIONAL MARKET PERSPECTIVE
- Global Natural Vitamin E Market Overview by Geographic Region
- Global Natural Vitamin E Tocopherols Market Overview by Geographic Region
- Global Natural Vitamin E Tocotrienols Market Overview by Geographic Region
REGIONAL MARKET OVERVIEW
6. NORTH AMERICA
- 6.1. North American Natural Vitamin E Market Overview by End-use Application
- 6.2. North American Natural Vitamin E Market Overview by Geographic Region
- 6.3. North American Natural Vitamin E Market Overview by Type
- 6.3.1. Natural Vitamin E - Tocopherols
- 6.3.1.1. North American Natural Vitamin E Tocopherols Market Overview by End-use Application
- 6.3.1.2. North American Natural Vitamin E Tocopherols Market Overview by Geographic Region
- 6.3.2. Natural Vitamin E - Tocotrienols
- 6.3.2.1. North American Natural Vitamin E Tocotrienols Market Overview by End-use Application
- 6.3.2.2. North American Natural Vitamin E Tocotrienols Market Overview by Geographic Region
- 6.3.1. Natural Vitamin E - Tocopherols
- 6.4. Country-wise Analysis of North American Natural Vitamin E Market
- 6.4.1. THE UNITED STATES
- 6.4.1.1. United States Natural Vitamin E Market Overview by End-use Application
- 6.4.1.2. United States Natural Vitamin E Market Overview by Type
- 6.4.1.2.1. United States Natural Vitamin E Tocopherols Market Overview by End-use Application
- 6.4.1.2.2. United States Natural Vitamin E Tocotrienols Market Overview by End-use Application
- 6.4.2. CANADA
- 6.4.2.1. Canadian Natural Vitamin E Market Overview by End-use Application
- 6.4.2.2. Canadian Natural Vitamin E Market Overview by Type
- 6.4.2.2.1. Canadian Natural Vitamin E Tocopherols Market Overview by End-use Application
- 6.4.2.2.2. Canadian Natural Vitamin E Tocotrienols Market Overview by End-use Application
- 6.4.3. MEXICO
- 6.4.3.1. Mexican Natural Vitamin E Market Overview by End-use Application
- 6.4.3.2. Mexican Natural Vitamin E Market Overview by Type
- 6.4.3.2.1. Mexican Natural Vitamin E Tocopherols Market Overview by End-use Application
- 6.4.3.2.2. Mexican Natural Vitamin E Tocotrienols Market Overview by End-use Application
- 6.4.1. THE UNITED STATES
7. EUROPE
- 7.1. European Natural Vitamin E Market Overview by End-use Application
- 7.2. European Natural Vitamin E Market Overview by Geographic Region
- 7.3. European Natural Vitamin E Market Overview by Type
- 7.3.1. Natural Vitamin E - Tocopherols
- 7.3.1.1. European Natural Vitamin E Tocopherols Market Overview by End-use Application
- 7.3.1.2. European Natural Vitamin E Tocopherols Market Overview by Geographic Region
- 7.3.2. Natural Vitamin E - Tocotrienols
- 7.3.2.1. European Natural Vitamin E Tocotrienols Market Overview by End-use Application
- 7.3.1. Natural Vitamin E - Tocopherols
- 7.4. Country-wise Analysis of European Natural Vitamin E Market
- 7.4.1. FRANCE
- 7.4.1.1. France Natural Vitamin E Tocopherols Market Overview by End-use Application
- 7.4.2. GERMANY
- 7.4.2.1. German Natural Vitamin E Tocopherols Market Overview by End-use Application
- 7.4.3. ITALY
- 7.4.3.1. Italian Natural Vitamin E Tocopherols Market Overview by End-use Application
- 7.4.4. THE NETHERLANDS
- 7.4.4.1. Dutch Natural Vitamin E Tocopherols Market Overview by End-use Application
- 7.4.5. SPAIN
- 7.4.5.1. Spanish Natural Vitamin E Tocopherols Market Overview by End-use Application
- 7.4.6. THE UNITED KINGDOM
- 7.4.6.1. United Kingdom Natural Vitamin E Tocopherols Market Overview by End-use Application
- 7.4.7. REST OF EUROPE
- 7.4.7.1. Rest of Europe Natural Vitamin E Tocopherols Market Overview by End-use Application
- 7.4.1. FRANCE
8. ASIA-PACIFIC
- 8.1. Asia-Pacific Natural Vitamin E Market Overview by End-use Application
- 8.2. Asia-Pacific Natural Vitamin E Market Overview by Geographic Region
- 8.3. Asia-Pacific Natural Vitamin E Market Overview by Type
- 8.3.1. Natural Vitamin E - Tocopherols
- 8.3.1.1. Asia-Pacific Natural Vitamin E Tocopherols Market Overview by End-use Application
- 8.3.1.2. Asia-Pacific Natural Vitamin E Tocopherols Market Overview by Geographic Region
- 8.3.2. Natural Vitamin E - Tocotrienols
- 8.3.2.1. Asia-Pacific Natural Vitamin E Tocotrienols Market Overview by End-use Application
- 8.3.2.2. Asia-Pacific Natural Vitamin E Tocotrienols Market Overview by Geographic Region
- 8.3.1. Natural Vitamin E - Tocopherols
- 8.4. Country-wise Analysis of Asia-Pacific Natural Vitamin E Market
- 8.4.1. CHINA
- 8.4.1.1. Chinese Natural Vitamin E Market Overview by End-use Application
- 8.4.1.2. Chinese Natural Vitamin E Market Overview by Type
- 8.4.1.2.1. Chinese Natural Vitamin E Tocopherols Market Overview by End-use Application
- 8.4.1.2.2. Chinese Natural Vitamin E Tocotrienols Market Overview by End-use Application
- 8.4.2. INDIA
- 8.4.2.1. Indian Natural Vitamin E Market Overview by End-use Application
- 8.4.2.2. Indian Natural Vitamin E Market Overview by Type
- 8.4.2.2.1. Indian Natural Vitamin E Tocopherols Market Overview by End-use Application
- 8.4.2.2.2. Indian Natural Vitamin E Tocotrienols Market Overview by End-use Application
- 8.4.3. JAPAN
- 8.4.3.1. Japanese Natural Vitamin E Market Overview by End-use Application
- 8.4.3.2. Japanese Natural Vitamin E Market Overview by Type
- 8.4.3.2.1. Japanese Natural Vitamin E Tocopherols Market Overview by End-use Application
- 8.4.3.2.2. Japanese Natural Vitamin E Tocotrienols Market Overview by End-use Application
- 8.4.4. REST OF ASIA-PACIFIC
- 8.4.4.1. Rest of Asia-Pacific Natural Vitamin E Market Overview by End-use Application
- 8.4.4.2. Rest of Asia-Pacific Natural Vitamin E Market Overview by Type
- 8.4.4.2.1. Rest of Asia-Pacific Natural Vitamin E Tocopherols Market Overview by End-use Application
- 8.4.4.2.2. Rest of Asia-Pacific Natural Vitamin E Tocotrienols Market Overview by End-use Application
- 8.4.1. CHINA
9. SOUTH AMERICA
- 9.1. South American Natural Vitamin E Tocopherols Market Overview by End-use Application
- 9.2. South American Natural Vitamin E Tocopherols Market Overview by Geographic Region
- 9.3. Country-wise Analysis of South American Natural Vitamin E Market
- 9.3.1. ARGENTINA
- 9.3.1.1. Argentine Natural Vitamin E Tocopherols Market Overview by End-use Application
- 9.3.2. BRAZIL
- 9.3.2.1. Brazilian Natural Vitamin E Tocopherols Market Overview by End-use Application
- 9.3.3. REST OF SOUTH AMERICA
- 9.3.3.1. Rest of South America Natural Vitamin E Tocopherols Market Overview by End-use Application
- 9.3.1. ARGENTINA
10. REST OF WORLD
- 10.1. Rest of World Natural Vitamin E Market Overview by End-use Application
- 10.2. Rest of World Natural Vitamin E Market Overview by Type
- 10.2.1. Natural Vitamin E - Tocopherols
- 10.2.1.1. Rest of World Natural Vitamin E Tocopherols Market Overview by End-use Application
- 10.2.2. Natural Vitamin E - Tocotrienols
- 10.2.2.1. Rest of World Natural Vitamin E Tocotrienols Market Overview by End-use Application
- 10.2.1. Natural Vitamin E - Tocopherols
PART C: GUIDE TO THE INDUSTRY
1. MAJOR MANUFACTURERS AND SUPPLIERS OF VITAMIN E
- 1.1. Manufacturers of Natural Vitamin E Tocopherols
- 1.2. Manufacturers of Natural Vitamin E Tocotrienols
- 1.3. Vitamins and Other Ingredients Distributors
2. MAJOR COMPANIES IN THE END-USE APPLICATION INDUSTRIES FOR VITAMIN E
- 2.1. Nutritional Supplements Companies
- 2.2. Direct Selling Companies - Supplements and Personal Care
- 2.3. Direct Selling Companies - Supplements and Personal Care
- 2.4. Animal Nutrition Companies
- 2.5. Vitamins and Other Ingredients Distributors and Formulators
PART D: ANNEXURE
- 1. RESEARCH METHODOLOGY
- 2. FEEDBACK
Charts & Graphs
PART A: GLOBAL MARKET PERSPECTIVE
- Chart 1: Global Natural Vitamin E Market 2021, 2024 and 2030
- Chart 2: Global Natural Vitamin E Market 2021, 2024 and 2030 by End-use Application
- Chart 3: Global Natural Vitamin E Market 2021, 2024 and 2030 by Geographic Region
- Chart 4: Global Natural Vitamin E Market 2021, 2024 and 2030 by Product Type
- Chart 5: Global Vitamin E Market Analysis (2021, 2024 and 2030) by Category - Synthetic Vitamin E and Natural Vitamin E (Volume in Metric Tons and Value in USD Million)
- Chart 6: Glance at 2021, 2024 and 2030 Global Vitamin E Volume & Value Market Share (%) by Category - Synthetic Vitamin E and Natural Vitamin E
- Chart 7: 2024 Global Vitamin E Capacity by Vitamin E Type
- Chart 8: 2024 Global Natural Vitamin E Tocopherols Capacity by Manufacturer in Metric Tons
- Chart 9: 2024 Global Natural Vitamin E Tocotrienols Capacity by Major Players in Metric Tons
GLOBAL MARKET OVERVIEW
- Chart 10: Global Natural Vitamin E Market Analysis (2021-2030) by Volume in Metric Tons and Value in USD Million
- Chart 11: Global Natural Vitamin E Market Analysis (2021-2030) by End-use Application - Animal Feed, Dietary Supplements, Food & Beverages, Cosmetics and Others in Metric Tons
- Chart 12: Glance at 2021, 2024 and 2030 Global Natural Vitamin E Market Share (%) by End-use Application - Animal Feed, Dietary Supplements, Food & Beverages, Cosmetics and Others
- Chart 13: Global Natural Vitamin E Market Analysis (2021-2030) by End-use Application - Animal Feed, Dietary Supplements, Food & Beverages, Cosmetics and Others in US$ Million
- Chart 14: Glance at 2021, 2024 and 2030 Global Natural Vitamin E Market Share (%) by End-use Application - Animal Feed, Dietary Supplements, Food & Beverages, Cosmetics and Others
- Chart 15: Global Natural Vitamin E Market Analysis (2021-2030) in Animal Feed by Geographic Region - North America, Europe, Asia-Pacific, South America and Rest of World in Metric Tons
- Chart 16: Glance at 2021, 2024 and 2030 Global Natural Vitamin E Market Share (%) in Animal Feed by Geographic Region - North America, Europe, Asia-Pacific, South America and Rest of World
- Chart 17: Global Natural Vitamin E Market Analysis (2021-2030) in Animal Feed by Geographic Region - North America, Europe, Asia-Pacific, South America and Rest of World in US$ Million
- Chart 18: Glance at 2021, 2024 and 2030 Global Natural Vitamin E Market Share (%) in Animal Feed by Geographic Region - North America, Europe, Asia-Pacific, South America and Rest of World
- Chart 19: Global Natural Vitamin E Market Analysis (2021-2030) in Dietary Supplements by Geographic Region - North America, Europe, Asia-Pacific, South America and Rest of World in Metric Tons
- Chart 20: Glance at 2021, 2024 and 2030 Global Natural Vitamin E Market Share (%) in Dietary Supplements by Geographic Region - North America, Europe, Asia-Pacific, South America and Rest of World
- Chart 21: Global Natural Vitamin E Market Analysis (2021-2030) in Dietary Supplements by Geographic Region - North America, Europe, Asia-Pacific, South America and Rest of World in US$ Million
- Chart 22: Glance at 2021, 2024 and 2030 Global Natural Vitamin E Market Share (%) in Dietary Supplements by Geographic Region - North America, Europe, Asia-Pacific, South America and Rest of World
- Chart 23: Global Natural Vitamin E Market Analysis (2021-2030) in Food & Beverages by Geographic Region - North America, Europe, Asia-Pacific, South America and Rest of World in Metric Tons
- Chart 24: Glance at 2021, 2024 and 2030 Global Natural Vitamin E Market Share (%) in Food & Beverages by Geographic Region - North America, Europe, Asia-Pacific, South America and Rest of World
- Chart 25: Global Natural Vitamin E Market Analysis (2021-2030) in Food & Beverages by Geographic Region - North America, Europe, Asia-Pacific, South America and Rest of World in US$ Million
- Chart 26: Glance at 2021, 2024 and 2030 Global Natural Vitamin E Market Share (%) in Food & Beverages by Geographic Region - North America, Europe, Asia-Pacific, South America and Rest of World
- Chart 27: Global Natural Vitamin E Market Analysis (2021-2030) in Cosmetics & Personal Care by Geographic Region - North America, Europe, Asia-Pacific, South America and Rest of World in Metric Tons
- Chart 28: Glance at 2021, 2024 and 2030 Global Natural Vitamin E Market Share (%) in Cosmetics & Personal Care by Geographic Region - North America, Europe, Asia-Pacific, South America and Rest of World
- Chart 29: Global Natural Vitamin E Market Analysis (2021-2030) in Cosmetics & Personal Care by Geographic Region - North America, Europe, Asia-Pacific, South America and Rest of World in US$ Million
- Chart 30: Glance at 2021, 2024 and 2030 Global Natural Vitamin E Market Share (%) in Cosmetics & Personal Care by Geographic Region - North America, Europe, Asia-Pacific, South America and Rest of World
- Chart 31: Global Natural Vitamin E Market Analysis (2021-2030) in Other Applications by Geographic Region - North America, Europe, Asia-Pacific, South America and Rest of World in Metric Tons
- Chart 32: Glance at 2021, 2024 and 2030 Global Natural Vitamin E Market Share (%) in Other Applications by Geographic Region - North America, Europe, Asia-Pacific, South America and Rest of World
- Chart 33: Global Natural Vitamin E Market Analysis (2021-2030) in Other Applications by Geographic Region - North America, Europe, Asia-Pacific, South America and Rest of World in US$ Million
- Chart 34: Glance at 2021, 2024 and 2030 Global Natural Vitamin E Market Share (%) in Other Applications by Geographic Region - North America, Europe, Asia-Pacific, South America and Rest of World
- Chart 35: Global Natural Vitamin E Market Analysis (2021-2030) by Type - Tocopherols and Tocotrienols in Metric Tons
- Chart 36: Glance at 2021, 2024 and 2030 Global Natural Vitamin E Market Share (%) by Type - Tocopherols and Tocotrienols
- Chart 37: Global Natural Vitamin E Market Analysis (2021-2030) by Type - Tocopherols and Tocotrienols in US$ Million
- Chart 38: Glance at 2021, 2024 and 2030 Global Natural Vitamin E Market Share (%) by Type - Tocopherols and Tocotrienols
- Chart 39: Global Natural Vitamin E Tocopherols Market Analysis (2021-2030) by Volume in Metric Tons and Value in US$ Million
- Chart 40: Global Natural Vitamin E Tocopherols Market Analysis (2021-2030) by End-use Application - Animal Feed, Dietary Supplements, Food & Beverages, Cosmetics and Others in Metric Tons
- Chart 41: Glance at 2021, 2024 and 2030 Global Natural Vitamin E Tocopherols Market Share (%) by End-use Application - Animal Feed, Dietary Supplements, Food & Beverages, Cosmetics and Others
- Chart 42: Global Natural Vitamin E Tocopherols Market Analysis (2021-2030) by End-use Application - Animal Feed, Dietary Supplements, Food & Beverages, Cosmetics and Others in US$ Million
- Chart 43: Glance at 2021, 2024 and 2030 Global Natural Vitamin E Tocopherols Market Share (%) by End-use Application - Animal Feed, Dietary Supplements, Food & Beverages, Cosmetics and Others
- Chart 44: Global Natural Vitamin E Tocotrienols Market Analysis (2021-2030) by Volume in Metric Tons and Value in US$ Million
- Chart 45: Global Natural Vitamin E Tocotrienols Market Analysis (2021-2030) by End-use Application - Dietary Supplements, Food & Beverages and Cosmetics in Metric Tons
- Chart 46: Glance at 2021, 2024 and 2030 Global Natural Vitamin E Tocotrienols Market Share (%) by End-use Application - Dietary Supplements, Food & Beverages and Cosmetics
- Chart 47: Global Natural Vitamin E Tocotrienols Market Analysis (2021-2030) by End-use Application - Dietary Supplements, Food & Beverages and Cosmetics in US$ Million
- Chart 48: Glance at 2021, 2024 and 2030 Global Natural Vitamin E Tocotrienols Market Share (%) by End-use Application - Dietary Supplements, Food & Beverages and Cosmetics
PART B: REGIONAL MARKET PERSPECTIVE
- Chart 49: Global Natural Vitamin E Market Analysis (2021-2030) by Geographic Region - North America, Europe, Asia-Pacific, South America and Rest of World in Metric Tons
- Chart 50: Glance at 2021, 2024 and 2030 Global Natural Vitamin E Market Share (%) by Geographic Region - North America, Europe, Asia-Pacific, South America and Rest of World
- Chart 51: Global Natural Vitamin E Market Analysis (2021-2030) by Geographic Region - North America, Europe, Asia-Pacific, South America and Rest of World in US$ Million
- Chart 52: Glance at 2021, 2024 and 2030 Global Natural Vitamin E Market Share (%) by Geographic Region - North America, Europe, Asia-Pacific, South America and Rest of World
- Chart 53: Global Natural Vitamin E Tocopherols Market Analysis (2021-2030) by Geographic Region - North America, Europe, Asia-Pacific, South America and Rest of World in Metric Tons
- Chart 54: Glance at 2021, 2024 and 2030 Global Natural Vitamin E Natural Vitamin E Tocopherols Market Share (%) by Geographic Region - North America, Europe, Asia-Pacific, South America and Rest of World
- Chart 55: Global Natural Vitamin E Tocopherols Market Analysis (2021-2030) by Geographic Region - North America, Europe, Asia-Pacific, South America and Rest of World in US$ Million
- Chart 56: Glance at 2021, 2024 and 2030 Global Natural Vitamin E Natural Vitamin E Tocopherols Market Share (%) by Geographic Region - North America, Europe, Asia-Pacific, South America and Rest of World
- Chart 57: Global Natural Vitamin E Natural Vitamin E Tocotrienols Market Analysis (2021-2030) by Geographic Region - North America, Europe, Asia-Pacific and Rest of World in Metric Tons
- Chart 58: Glance at 2021, 2024 and 2030 Global Natural Vitamin E Natural Vitamin E Tocotrienols Market Share (%) by Geographic Region - North America, Europe, Asia-Pacific and Rest of World
- Chart 59: Global Natural Vitamin E Natural Vitamin E Tocotrienols Market Analysis (2021-2030) by Geographic Region - North America, Europe, Asia-Pacific and Rest of World in US$ Million
- Chart 60: Glance at 2021, 2024 and 2030 Global Natural Vitamin E Natural Vitamin E Tocotrienols Market Share (%) by Geographic Region - North America, Europe, Asia-Pacific and Rest of World
REGIONAL MARKET OVERVIEW
NORTH AMERICA
- Chart 61: North American Natural Vitamin E Market Analysis (2021-2030) by Volume in Metric Tons and Value in US$ Million
- Chart 62: North American Natural Vitamin E Market Analysis (2021-2030) by End-use Application - Animal Feed, Dietary Supplements, Food & Beverages, Cosmetics and Others in Metric Tons
- Chart 63: Glance at 2021, 2024 and 2030 North American Natural Vitamin E Market Share (%) by End-use Application - Animal Feed, Dietary Supplements, Food & Beverages, Cosmetics and Others
- Chart 64: North American Natural Vitamin E Market Analysis (2021-2030) by End-use Application - Animal Feed, Dietary Supplements, Food & Beverages, Cosmetics and Others in US$ Million
- Chart 65: Glance at 2021, 2024 and 2030 North American Natural Vitamin E Market Share (%) by End-use Application - Animal Feed, Dietary Supplements, Food & Beverages, Cosmetics and Others
- Chart 66: North American Natural Vitamin E Market Analysis (2021-2030) by Geographic Region - United States, Mexico and Canada in Metric Tons
- Chart 67: Glance at 2021, 2024 and 2030 North American Natural Vitamin E Market Share (%) by Geographic Region - United States, Mexico and Canada
- Chart 68: North American Natural Vitamin E Market Analysis (2021-2030) by Geographic Region - United States, Mexico and Canada in US$ Million
- Chart 69: Glance at 2021, 2024 and 2030 North American Natural Vitamin E Market Share (%) by Geographic Region - United States, Mexico and Canada
- Chart 70: North American Natural Vitamin E Market Analysis (2021-2030) by Type - Tocopherols and Tocotrienols in Metric Tons
- Chart 71: Glance at 2021, 2024 and 2030 North American Natural Vitamin E Market Share (%) by Type - Tocopherols and Tocotrienols
- Chart 72: North American Natural Vitamin E Market Analysis (2021-2030) by Type - Tocopherols and Tocotrienols in US$ Million
- Chart 73: Glance at 2021, 2024 and 2030 North American Natural Vitamin E Market Share (%) by Type - Tocopherols and Tocotrienols
- Chart 74: North American Natural Vitamin E Tocopherols Market Analysis (2021-2030) by Volume in Metric Tons and Value in US$ Million
- Chart 75: North American Natural Vitamin E Tocopherols Market Analysis (2021-2030) by End-use Application - Animal Feed, Dietary Supplements, Food & Beverages, Cosmetics and Others in Metric Tons
- Chart 76: Glance at 2021, 2024 and 2030 North American Natural Vitamin E Natural Vitamin E Tocopherols Market Share (%) by End-use Application - Animal Feed, Dietary Supplements, Food & Beverages, Cosmetics and Others
- Chart 77: North American Natural Vitamin E Tocopherols Market Analysis (2021-2030) by End-use Application - Animal Feed, Dietary Supplements, Food & Beverages, Cosmetics and Others in US$ Million
- Chart 78: Glance at 2021, 2024 and 2030 North American Natural Vitamin E Natural Vitamin E Tocopherols Market Share (%) by End-use Application - Animal Feed, Dietary Supplements, Food & Beverages, Cosmetics and Others
- Chart 79: North American Natural Vitamin E Tocopherols Market Analysis (2021-2030) by Geographic Region - The United States, Mexico and Canada in Metric Tons
- Chart 80: Glance at 2021, 2024 and 2030 North American Natural Vitamin E Natural Vitamin E Tocopherols Market Share (%) by Geographic Region - The United States, Mexico and Canada
- Chart 81: North American Natural Vitamin E Tocopherols Market Analysis (2021-2030) by Geographic Region - The United States, Mexico and Canada in US$ Million
- Chart 82: Glance at 2021, 2024 and 2030 North American Natural Vitamin E Natural Vitamin E Tocopherols Market Share (%) by Geographic Region - The United States, Mexico and Canada
- Chart 83: North American Natural Vitamin E Natural Vitamin E Tocotrienols Market Analysis (2021-2030) by Volume in Metric Tons and Value in US$ Million
- Chart 84: North American Natural Vitamin E Natural Vitamin E Tocotrienols Market Analysis (2021-2030) by End-use Application - Dietary Supplements, Food & Beverages and Cosmetics in Metric Tons
- Chart 85: Glance at 2021, 2024 and 2030 North American Natural Vitamin E Natural Vitamin E Tocotrienols Market Share (%) by End-use Application - Dietary Supplements, Food & Beverages and Cosmetics
- Chart 86: North American Natural Vitamin E Natural Vitamin E Tocotrienols Market Analysis (2021-2030) by End-use Application - Dietary Supplements, Food & Beverages and Cosmetics in US$ Million
- Chart 87: Glance at 2021, 2024 and 2030 North American Natural Vitamin E Natural Vitamin E Tocotrienols Market Share (%) by End-use Application - Dietary Supplements, Food & Beverages and Cosmetics
- Chart 88: North American Natural Vitamin E Natural Vitamin E Tocotrienols Market Analysis (2021-2030) by Geographic Region - The United States, Mexico and Canada in Metric Tons
- Chart 89: Glance at 2021, 2024 and 2030 North American Natural Vitamin E Natural Vitamin E Tocotrienols Market Share (%) by Geographic Region - The United States, Mexico and Canada
- Chart 90: North American Natural Vitamin E Natural Vitamin E Tocotrienols Market Analysis (2021-2030) by Geographic Region - The United States, Mexico and Canada in US$ Million
- Chart 91: Glance at 2021, 2024 and 2030 North American Natural Vitamin E Natural Vitamin E Tocotrienols Market Share (%) by Geographic Region - The United States, Mexico and Canada
THE UNITED STATES
- Chart 92: United States Natural Vitamin E Market Analysis (2021-2030) by End-use Application - Animal Feed, Dietary Supplements, Food & Beverages, Cosmetics and Others in Metric Tons
- Chart 93: Glance at 2021, 2024 and 2030 United States Natural Vitamin E Market Share (%) by End-use Application - Animal Feed, Dietary Supplements, Food & Beverages, Cosmetics and Others
- Chart 94: United States Natural Vitamin E Market Analysis (2021-2030) by End-use Application - Animal Feed, Dietary Supplements, Food & Beverages, Cosmetics and Others in US$ Million
- Chart 95: Glance at 2021, 2024 and 2030 United States Natural Vitamin E Market Share (%) by End-use Application - Animal Feed, Dietary Supplements, Food & Beverages, Cosmetics and Others
- Chart 96: United States Natural Vitamin E Market Analysis (2021-2030) by Type - Tocopherols and Tocotrienols in Metric Tons
- Chart 97: Glance at 2021, 2024 and 2030 United States Natural Vitamin E Market Share (%) by Type - Tocopherols and Tocotrienols
- Chart 98: United States Natural Vitamin E Market Analysis (2021-2030) by Type - Tocopherols and Tocotrienols in US$ Million
- Chart 99: Glance at 2021, 2024 and 2030 United States Natural Vitamin E Market Share (%) by Type - Tocopherols and Tocotrienols
- Chart 100: United States Natural Vitamin E Tocopherols Market Analysis (2021-2030) by End-use Application - Animal Feed, Dietary Supplements, Food & Beverages, Cosmetics and Others in Metric Tons
- Chart 101: Glance at 2021, 2024 and 2030 United States Natural Vitamin E Tocopherols Market Share (%) by End-use Application - Animal Feed, Dietary Supplements, Food & Beverages, Cosmetics and Others
- Chart 102: United States Natural Vitamin E Tocopherols Market Analysis (2021-2030) by End-use Application - Animal Feed, Dietary Supplements, Food & Beverages, Cosmetics and Others in US$ Million
- Chart 103: Glance at 2021, 2024 and 2030 United States Natural Vitamin E Tocopherols Market Share (%) by End-use Application - Animal Feed, Dietary Supplements, Food & Beverages, Cosmetics and Others
- Chart 104: United States Natural Vitamin E Tocotrienols Market Analysis (2021-2030) by End-use Application - Dietary Supplements, Food & Beverages and Cosmetics in Metric Tons
- Chart 105: Glance at 2021, 2024 and 2030 United States Natural Vitamin E Tocotrienols Market Share (%) by End-use Application - Dietary Supplements, Food & Beverages and Cosmetics
- Chart 106: United States Natural Vitamin E Tocotrienols Market Analysis (2021-2030) by End-use Application - Dietary Supplements, Food & Beverages and Cosmetics in US$ Million
- Chart 107: Glance at 2021, 2024 and 2030 United States Natural Vitamin E Tocotrienols Market Share (%) by End-use Application - Dietary Supplements, Food & Beverages and Cosmetics
CANADA
- Chart 108: Canadian Natural Vitamin E Market Analysis (2021-2030) by End-use Application - Animal Feed, Dietary Supplements, Food & Beverages, Cosmetics and Others in Metric Tons
- Chart 109: Glance at 2021, 2024 and 2030 Canadian Natural Vitamin E Market Share (%) by End-use Application - Animal Feed, Dietary Supplements, Food & Beverages, Cosmetics and Others
- Chart 110: Canadian Natural Vitamin E Market Analysis (2021-2030) by End-use Application - Animal Feed, Dietary Supplements, Food & Beverages, Cosmetics and Others in US$ Million
- Chart 111: Glance at 2021, 2024 and 2030 Canadian Natural Vitamin E Market Share (%) by End-use Application - Animal Feed, Dietary Supplements, Food & Beverages, Cosmetics and Others
- Chart 112: Canadian Natural Vitamin E Market Analysis (2021-2030) by Type - Tocopherols and Tocotrienols in Metric Tons
- Chart 113: Glance at 2021, 2024 and 2030 Canadian Natural Vitamin E Market Share (%) by Type - Tocopherols and Tocotrienols
- Chart 114: Canadian Natural Vitamin E Market Analysis (2021-2030) by Type - Tocopherols and Tocotrienols in US$ Million
- Chart 115: Glance at 2021, 2024 and 2030 Canadian Natural Vitamin E Market Share (%) by Type - Tocopherols and Tocotrienols
- Chart 116: Canadian Natural Vitamin E Tocopherols Market Analysis (2021-2030) by End-use Application - Animal Feed, Dietary Supplements, Food & Beverages, Cosmetics and Others in Metric Tons
- Chart 117: Glance at 2021, 2024 and 2030 Canadian Natural Vitamin E Tocopherols Market Share (%) by End-use Application - Animal Feed, Dietary Supplements, Food & Beverages, Cosmetics and Others
- Chart 118: Canadian Natural Vitamin E Tocopherols Market Analysis (2021-2030) by End-use Application - Animal Feed, Dietary Supplements, Food & Beverages, Cosmetics and Others in US$ Million
- Chart 119: Glance at 2021, 2024 and 2030 Canadian Natural Vitamin E Tocopherols Market Share (%) by End-use Application - Animal Feed, Dietary Supplements, Food & Beverages, Cosmetics and Others
- Chart 120: Canadian Natural Vitamin E Tocotrienols Market Analysis (2021-2030) by End-use Application - Dietary Supplements, Food & Beverages and Cosmetics in Metric Tons
- Chart 121: Glance at 2021, 2024 and 2030 Canadian Natural Vitamin E Tocotrienols Market Share (%) by End-use Application - Dietary Supplements, Food & Beverages and Cosmetics
- Chart 122: Canadian Natural Vitamin E Tocotrienols Market Analysis (2021-2030) by End-use Application - Dietary Supplements, Food & Beverages and Cosmetics in US$ Million
- Chart 123: Glance at 2021, 2024 and 2030 Canadian Natural Vitamin E Tocotrienols Market Share (%) by End-use Application - Dietary Supplements, Food & Beverages and Cosmetics
MEXICO
- Chart 124: Mexican Natural Vitamin E Market Analysis (2021-2030) by End-use Application - Animal Feed, Dietary Supplements, Food & Beverages, Cosmetics and Others in Metric Tons
- Chart 125: Glance at 2021, 2024 and 2030 Mexican Natural Vitamin E Market Share (%) by End-use Application - Animal Feed, Dietary Supplements, Food & Beverages, Cosmetics and Others
- Chart 126: Mexican Natural Vitamin E Market Analysis (2021-2030) by End-use Application - Animal Feed, Dietary Supplements, Food & Beverages, Cosmetics and Others in US$ Million
- Chart 127: Glance at 2021, 2024 and 2030 Mexican Natural Vitamin E Market Share (%) by End-use Application - Animal Feed, Dietary Supplements, Food & Beverages, Cosmetics and Others
- Chart 128: Mexican Natural Vitamin E Market Analysis (2021-2030) by Type - Tocopherols and Tocotrienols in Metric Tons
- Chart 129: Glance at 2021, 2024 and 2030 Mexican Natural Vitamin E Market Share (%) by Type - Tocopherols and Tocotrienols
- Chart 130: Mexican Natural Vitamin E Market Analysis (2021-2030) by Type - Tocopherols and Tocotrienols in US$ Million
- Chart 131: Glance at 2021, 2024 and 2030 Mexican Natural Vitamin E Market Share (%) by Type - Tocopherols and Tocotrienols
- Chart 132: Mexican Natural Vitamin E Tocopherols Market Analysis (2021-2030) by End-use Application - Animal Feed, Dietary Supplements, Food & Beverages, Cosmetics and Others in Metric Tons
- Chart 133: Glance at 2021, 2024 and 2030 Mexican Natural Vitamin E Tocopherols Market Share (%) by End-use Application - Animal Feed, Dietary Supplements, Food & Beverages, Cosmetics and Others
- Chart 134: Mexican Natural Vitamin E Tocopherols Market Analysis (2021-2030) by End-use Application - Animal Feed, Dietary Supplements, Food & Beverages, Cosmetics and Others in US$ Million
- Chart 135: Glance at 2021, 2024 and 2030 Mexican Natural Vitamin E Tocopherols Market Share (%) by End-use Application - Animal Feed, Dietary Supplements, Food & Beverages, Cosmetics and Others
- Chart 136: Mexican Natural Vitamin E Tocotrienols Market Analysis (2021-2030) by End-use Application - Dietary Supplements and Others in Metric Tons
- Chart 137: Glance at 2021, 2024 and 2030 Mexican Natural Vitamin E Tocotrienols Market Share (%) by End-use Application - Dietary Supplements and Others
- Chart 138: Mexican Natural Vitamin E Tocotrienols Market Analysis (2021-2030) by End-use Application - Dietary Supplements and Others in US$ Million
- Chart 139: Glance at 2021, 2024 and 2030 Mexican Natural Vitamin E Tocotrienols Market Share (%) by End-use Application - Dietary Supplements and Others
EUROPE
- Chart 140: European Natural Vitamin E Market Analysis (2021-2030) by Volume in Metric Tons and Value in US$ Million
- Chart 141: European Natural Vitamin E Market Analysis (2021-2030) by End-use Application - Animal Feed, Dietary Supplements, Food & Beverages, Cosmetics and Others in Metric Tons
- Chart 142: Glance at 2021, 2024 and 2030 European Natural Vitamin E Market Share (%) by End-use Application - Animal Feed, Dietary Supplements, Food & Beverages, Cosmetics and Others
- Chart 143: European Natural Vitamin E Market Analysis (2021-2030) by End-use Application - Animal Feed, Dietary Supplements, Food & Beverages, Cosmetics and Others in US$ Million
- Chart 144: Glance at 2021, 2024 and 2030 European Natural Vitamin E Market Share (%) by End-use Application - Animal Feed, Dietary Supplements, Food & Beverages, Cosmetics and Others
- Chart 145: European Natural Vitamin E Market Analysis (2021-2030) by Geographic Region - Germany, France, Netherlands, Spain, Italy, United Kingdom and Rest of Europe in Metric Tons
- Chart 146: Glance at 2021, 2024 and 2030 European Natural Vitamin E Market Share (%) by Geographic Region - Germany, France, Netherlands, Spain, Italy, United Kingdom and Rest of Europe
- Chart 147: European Natural Vitamin E Market Analysis (2021-2030) by Geographic Region - Germany, France, Netherlands, Spain, Italy, United Kingdom and Rest of Europe in US$ Million
- Chart 148: Glance at 2021, 2024 and 2030 European Natural Vitamin E Market Share (%) by Geographic Region - Germany, France, Netherlands, Spain, Italy, United Kingdom and Rest of Europe
- Chart 149: European Natural Vitamin E Market Analysis (2021-2030) by Type - Tocopherols and Tocotrienols in Metric Tons
- Chart 150: Glance at 2021, 2024 and 2030 European Natural Vitamin E Market Share (%) by Type - Tocopherols and Tocotrienols
- Chart 151: European Natural Vitamin E Market Analysis (2021-2030) by Type - Tocopherols and Tocotrienols in US$ Million
- Chart 152: Glance at 2021, 2024 and 2030 European Natural Vitamin E Market Share (%) by Type - Tocopherols and Tocotrienols
- Chart 153: European Natural Vitamin E Tocopherols Market Analysis (2021-2030) by Volume in Metric Tons and Value in US$ Million
- Chart 154: European Natural Vitamin E Tocopherols Market Analysis (2021-2030) by End-use Application - Animal Feed, Dietary Supplements, Food & Beverages, Cosmetics and Others in Metric Tons
- Chart 155: Glance at 2021, 2024 and 2030 European Natural Vitamin E Tocopherols Market Share (%) by End-use Application - Animal Feed, Dietary Supplements, Food & Beverages, Cosmetics and Others
- Chart 156: European Natural Vitamin E Tocopherols Market Analysis (2021-2030) by End-use Application - Animal Feed, Dietary Supplements, Food & Beverages, Cosmetics and Others in US$ Million
- Chart 157: Glance at 2021, 2024 and 2030 European Natural Vitamin E Tocopherols Market Share (%) by End-use Application - Animal Feed, Dietary Supplements, Food & Beverages, Cosmetics and Others
- Chart 158: European Natural Vitamin E Tocopherols Market Analysis (2021-2030) by Geographic Region - Germany, France, Netherlands, Spain, Italy, United Kingdom and Rest of Europe in Metric Tons
- Chart 159: Glance at 2021, 2024 and 2030 European Natural Vitamin E Tocopherols Market Share (%) by Geographic Region - Germany, France, Netherlands, Spain, Italy, United Kingdom and Rest of Europe
- Chart 160: European Natural Vitamin E Tocopherols Market Analysis (2021-2030) by Geographic Region - Germany, France, Netherlands, Spain, Italy, United Kingdom and Rest of Europe in US$ Million
- Chart 161: Glance at 2021, 2024 and 2030 European Natural Vitamin E Tocopherols Market Share (%) by Geographic Region - Germany, France, Netherlands, Spain, Italy, United Kingdom and Rest of Europe
- Chart 162: European Natural Vitamin E Natural Vitamin E Tocotrienols Market Analysis (2021-2030) by Volume in Metric Tons and Value in US$ Million
- Chart 163: European Natural Vitamin E Tocotrienols Market Analysis (2021-2030) by End-use Application - Dietary Supplements and Cosmetics in Metric Tons
- Chart 164: Glance at 2021, 2024 and 2030 European Natural Vitamin E Tocotrienols Market Share (%) by End-use Application - Dietary Supplements and Cosmetics
- Chart 165: European Natural Vitamin E Tocotrienols Market Analysis (2021-2030) by End-use Application - Dietary Supplements and Cosmetics in US$ Million
- Chart 166: Glance at 2021, 2024 and 2030 European Natural Vitamin E Tocotrienols Market Share (%) by End-use Application - Dietary Supplements and Cosmetics
FRANCE
- Chart 167: France Natural Vitamin E Tocopherols Market Analysis (2021-2030) by End-use Application - Animal Feed, Dietary Supplements, Food & Beverages, Cosmetics and Others in Metric Tons
- Chart 168: Glance at 2021, 2024 and 2030 France Natural Vitamin E Tocopherols Market Share (%) by End-use Application - Animal Feed, Dietary Supplements, Food & Beverages, Cosmetics and Others
- Chart 169: France Natural Vitamin E Tocopherols Market Analysis (2021-2030) by End-use Application - Animal Feed, Dietary Supplements, Food & Beverages, Cosmetics and Others in US$ Million
- Chart 170: Glance at 2021, 2024 and 2030 France Natural Vitamin E Tocopherols Market Share (%) by End-use Application - Animal Feed, Dietary Supplements, Food & Beverages, Cosmetics and Others
GERMANY
- Chart 171: German Natural Vitamin E Tocopherols Market Analysis (2021-2030) by End-use Application - Animal Feed, Dietary Supplements, Food & Beverages, Cosmetics and Others in Metric Tons
- Chart 172: Glance at 2021, 2024 and 2030 German Natural Vitamin E Tocopherols Market Share (%) by End-use Application - Animal Feed, Dietary Supplements, Food & Beverages, Cosmetics and Others
- Chart 173: German Natural Vitamin E Tocopherols Market Analysis (2021-2030) by End-use Application - Animal Feed, Dietary Supplements, Food & Beverages, Cosmetics and Others in US$ Million
- Chart 174: Glance at 2021, 2024 and 2030 German Natural Vitamin E Tocopherols Market Share (%) by End-use Application - Animal Feed, Dietary Supplements, Food & Beverages, Cosmetics and Others
ITALY
- Chart 175: Italian Natural Vitamin E Tocopherols Market Analysis (2021-2030) by End-use Application - Animal Feed, Dietary Supplements, Food & Beverages, Cosmetics and Others in Metric Tons
- Chart 176: Glance at 2021, 2024 and 2030 Italian Natural Vitamin E Tocopherols Market Share (%) by End-use Application - Animal Feed, Dietary Supplements, Food & Beverages, Cosmetics and Others
- Chart 177: Italian Natural Vitamin E Tocopherols Market Analysis (2021-2030) by End-use Application - Animal Feed, Dietary Supplements, Food & Beverages, Cosmetics and Others in US$ Million
- Chart 178: Glance at 2021, 2024 and 2030 Italian Natural Vitamin E Tocopherols Market Share (%) by End-use Application - Animal Feed, Dietary Supplements, Food & Beverages, Cosmetics and Others
THE NETHERLANDS
- Chart 179: Dutch Natural Vitamin E Tocopherols Market Analysis (2021-2030) by End-use Application - Animal Feed, Dietary Supplements, Food & Beverages, Cosmetics and Others in Metric Tons
- Chart 180: Glance at 2021, 2024 and 2030 Dutch Natural Vitamin E Tocopherols Market Share (%) by End-use Application - Animal Feed, Dietary Supplements, Food & Beverages, Cosmetics and Others
- Chart 181: Dutch Natural Vitamin E Tocopherols Market Analysis (2021-2030) by End-use Application - Animal Feed, Dietary Supplements, Food & Beverages, Cosmetics and Others in US$ Million
- Chart 182: Glance at 2021, 2024 and 2030 Dutch Natural Vitamin E Tocopherols Market Share (%) by End-use Application - Animal Feed, Dietary Supplements, Food & Beverages, Cosmetics and Others
SPAIN
- Chart 183: Spanish Natural Vitamin E Tocopherols Market Analysis (2021-2030) by End-use Application - Animal Feed, Dietary Supplements, Food & Beverages, Cosmetics and Others in Metric Tons
- Chart 184: Glance at 2021, 2024 and 2030 Spanish Natural Vitamin E Tocopherols Market Share (%) by End-use Application - Animal Feed, Dietary Supplements, Food & Beverages, Cosmetics and Others
- Chart 185: Spanish Natural Vitamin E Tocopherols Market Analysis (2021-2030) by End-use Application - Animal Feed, Dietary Supplements, Food & Beverages, Cosmetics and Others in US$ Million
- Chart 186: Glance at 2021, 2024 and 2030 Spanish Natural Vitamin E Tocopherols Market Share (%) by End-use Application - Animal Feed, Dietary Supplements, Food & Beverages, Cosmetics and Others
THE UNITED KINGDOM
- Chart 187: United Kingdom Natural Vitamin E Tocopherols Market Analysis (2021-2030) by End-use Application - Animal Feed, Dietary Supplements, Food & Beverages, Cosmetics and Others in Metric Tons
- Chart 188: Glance at 2021, 2024 and 2030 United Kingdom Natural Vitamin E Tocopherols Market Share (%) by End-use Application - Animal Feed, Dietary Supplements, Food & Beverages, Cosmetics and Others
- Chart 189: United Kingdom Natural Vitamin E Tocopherols Market Analysis (2021-2030) by End-use Application - Animal Feed, Dietary Supplements, Food & Beverages, Cosmetics and Others in US$ Million
- Chart 190: Glance at 2021, 2024 and 2030 United Kingdom Natural Vitamin E Tocopherols Market Share (%) by End-use Application - Animal Feed, Dietary Supplements, Food & Beverages, Cosmetics and Others
REST OF EUROPE
- Chart 191: Rest of Europe Natural Vitamin E Tocopherols Market Analysis (2021-2030) by End-use Application - Animal Feed, Dietary Supplements, Food & Beverages, Cosmetics and Others in Metric Tons
- Chart 192: Glance at 2021, 2024 and 2030 Rest of Europe Natural Vitamin E Tocopherols Market Share (%) by End-use Application - Animal Feed, Dietary Supplements, Food & Beverages, Cosmetics and Others
- Chart 193: Rest of Europe Natural Vitamin E Tocopherols Market Analysis (2021-2030) by End-use Application - Animal Feed, Dietary Supplements, Food & Beverages, Cosmetics and Others in US$ Million
- Chart 194: Glance at 2021, 2024 and 2030 Rest of Europe Natural Vitamin E Tocopherols Market Share (%) by End-use Application - Animal Feed, Dietary Supplements, Food & Beverages, Cosmetics and Others
ASIA-PACIFIC
- Chart 195: Asia-Pacific Natural Vitamin E Market Analysis (2021-2030) by Volume in Metric Tons and Value in US$ Million
- Chart 196: Asia-Pacific Natural Vitamin E Market Analysis (2021-2030) by End-use Application - Animal Feed, Dietary Supplements, Food & Beverages, Cosmetics and Others in Metric Tons
- Chart 197: Glance at 2021, 2024 and 2030 Asia-Pacific Natural Vitamin E Market Share (%) by End-use Application - Animal Feed, Dietary Supplements, Food & Beverages, Cosmetics and Others
- Chart 198: Asia-Pacific Natural Vitamin E Market Analysis (2021-2030) by End-use Application - Animal Feed, Dietary Supplements, Food & Beverages, Cosmetics and Others in US$ Million
- Chart 199: Glance at 2021, 2024 and 2030 Asia-Pacific Natural Vitamin E Market Share (%) by End-use Application - Animal Feed, Dietary Supplements, Food & Beverages, Cosmetics and Others
- Chart 200: Asia-Pacific Natural Vitamin E Market Analysis (2021-2030) by Geographic Region - China, India, Japan and Rest of APAC in Metric Tons
- Chart 201: Glance at 2021, 2024 and 2030 Asia-Pacific Natural Vitamin E Market Share (%) by Geographic Region - China, India, Japan and Rest of APAC
- Chart 202: Asia-Pacific Natural Vitamin E Market Analysis (2021-2030) by Geographic Region - China, India, Japan and Rest of APAC in US$ Million
- Chart 203: Glance at 2021, 2024 and 2030 Asia-Pacific Natural Vitamin E Market Share (%) by Geographic Region - China, India, Japan and Rest of APAC
- Chart 204: Asia-Pacific Natural Vitamin E Market Analysis (2021-2030) by Type - Tocopherols and Tocotrienols in Metric Tons
- Chart 205: Glance at 2021, 2024 and 2030 Asia-Pacific Natural Vitamin E Market Share (%) by Type - Tocopherols and Tocotrienols
- Chart 206: Asia-Pacific Natural Vitamin E Market Analysis (2021-2030) by Type - Tocopherols and Tocotrienols in US$ Million
- Chart 207: Glance at 2021, 2024 and 2030 Asia-Pacific Natural Vitamin E Market Share (%) by Type - Tocopherols and Tocotrienols
- Chart 208: Asia-Pacific Natural Vitamin E Tocopherols Market Analysis (2021-2030) by Volume in Metric Tons and Value in US$ Million
- Chart 209: Asia-Pacific Natural Vitamin E Tocopherols Market Analysis (2021-2030) by End-use Application - Animal Feed, Dietary Supplements, Food & Beverages, Cosmetics and Others in Metric Tons
- Chart 210: Glance at 2021, 2024 and 2030 Asia-Pacific Natural Vitamin E Tocopherols Market Share (%) by End-use Application - Animal Feed, Dietary Supplements, Food & Beverages, Cosmetics and Others
- Chart 211: Asia-Pacific Natural Vitamin E Tocopherols Market Analysis (2021-2030) by End-use Application - Animal Feed, Dietary Supplements, Food & Beverages, Cosmetics and Others in US$ Million
- Chart 212: Glance at 2021, 2024 and 2030 Asia-Pacific Natural Vitamin E Tocopherols Market Share (%) by End-use Application - Animal Feed, Dietary Supplements, Food & Beverages, Cosmetics and Others
- Chart 213: Asia-Pacific Natural Vitamin E Tocopherols Market Analysis (2021-2030) by Geographic Region - China, India, Japan and Rest of APAC in Metric Tons
- Chart 214: Glance at 2021, 2024 and 2030 Asia-Pacific Natural Vitamin E Tocopherols Market Share (%) by Geographic Region - China, India, Japan and Rest of APAC
- Chart 215: Asia-Pacific Natural Vitamin E Tocopherols Market Analysis (2021-2030) by Geographic Region - China, India, Japan and Rest of APAC in US$ Million
- Chart 216: Glance at 2021, 2024 and 2030 Asia-Pacific Natural Vitamin E Tocopherols Market Share (%) by Geographic Region - China, India, Japan and Rest of APAC
- Chart 217: Asia-Pacific Natural Vitamin E Natural Vitamin E Tocotrienols Market Analysis (2021-2030) by Volume in Metric Tons and Value in US$ Million
- Chart 218: Asia-Pacific Natural Vitamin E Tocotrienols Market Analysis (2021-2030) by End-use Application - Dietary Supplements, Food & Beverages and Cosmetics in Metric Tons
- Chart 219: Glance at 2021, 2024 and 2030 Asia-Pacific Natural Vitamin E Tocotrienols Market Share (%) by End-use Application - Dietary Supplements, Food & Beverages and Cosmetics
- Chart 220: Asia-Pacific Natural Vitamin E Tocotrienols Market Analysis (2021-2030) by End-use Application - Dietary Supplements, Food & Beverages and Cosmetics in US$ Million
- Chart 221: Glance at 2021, 2024 and 2030 Asia-Pacific Natural Vitamin E Tocotrienols Market Share (%) by End-use Application - Dietary Supplements, Food & Beverages and Cosmetics
- Chart 222: Asia-Pacific Natural Vitamin E Tocotrienols Market Analysis (2021-2030) by Geographic Region - China, India, Japan and Rest of APAC in Metric Tons
- Chart 223: Glance at 2021, 2024 and 2030 Asia-Pacific Natural Vitamin E Tocotrienols Market Share (%) by Geographic Region - China, India, Japan and Rest of APAC
- Chart 224: Asia-Pacific Natural Vitamin E Tocotrienols Market Analysis (2021-2030) by Geographic Region - China, India, Japan and Rest of APAC in US$ Million
- Chart 225: Glance at 2021, 2024 and 2030 Asia-Pacific Natural Vitamin E Tocotrienols Market Share (%) by Geographic Region - China, India, Japan and Rest of APAC
CHINA
- Chart 226: Chinese Natural Vitamin E Market Analysis (2021-2030) by End-use Application - Animal Feed, Dietary Supplements, Food & Beverages, Cosmetics and Others in Metric Tons
- Chart 227: Glance at 2021, 2024 and 2030 Chinese Natural Vitamin E Market Share (%) by End-use Application - Animal Feed, Dietary Supplements, Food & Beverages, Cosmetics and Others
- Chart 228: Chinese Natural Vitamin E Market Analysis (2021-2030) by End-use Application - Animal Feed, Dietary Supplements, Food & Beverages, Cosmetics and Others in US$ Million
- Chart 229: Glance at 2021, 2024 and 2030 Chinese Natural Vitamin E Market Share (%) by End-use Application - Animal Feed, Dietary Supplements, Food & Beverages, Cosmetics and Others
- Chart 230: Chinese Natural Vitamin E Market Analysis (2021-2030) by Type - Tocopherols and Tocotrienols in Metric Tons
- Chart 231: Glance at 2021, 2024 and 2030 Chinese Natural Vitamin E Market Share (%) by Type - Tocopherols and Tocotrienols
- Chart 232: Chinese Natural Vitamin E Market Analysis (2021-2030) by Type - Tocopherols and Tocotrienols in US$ Million
- Chart 233: Glance at 2021, 2024 and 2030 Chinese Natural Vitamin E Market Share (%) by Type - Tocopherols and Tocotrienols
- Chart 234: Chinese Natural Vitamin E Tocopherols Market Analysis (2021-2030) by End-use Application - Animal Feed, Dietary Supplements, Food & Beverages, Cosmetics and Others in Metric Tons
- Chart 235: Glance at 2021, 2024 and 2030 Chinese Natural Vitamin E Tocopherols Market Share (%) by End-use Application - Animal Feed, Dietary Supplements, Food & Beverages, Cosmetics and Others
- Chart 236: Chinese Natural Vitamin E Tocopherols Market Analysis (2021-2030) by End-use Application - Animal Feed, Dietary Supplements, Food & Beverages, Cosmetics and Others in US$ Million
- Chart 237: Glance at 2021, 2024 and 2030 Chinese Natural Vitamin E Tocopherols Market Share (%) by End-use Application - Animal Feed, Dietary Supplements, Food & Beverages, Cosmetics and Others
- Chart 238: Chinese Natural Vitamin E Tocotrienols Market Analysis (2021-2030) by End-use Application - Dietary Supplements, Food & Beverages and Cosmetics in Metric Tons
- Chart 239: Glance at 2021, 2024 and 2030 Chinese Natural Vitamin E Tocotrienols Market Share (%) by End-use Application - Dietary Supplements, Food & Beverages and Cosmetics
- Chart 240: Chinese Natural Vitamin E Tocotrienols Market Analysis (2021-2030) by End-use Application - Dietary Supplements, Food & Beverages and Cosmetics in US$ Million
- Chart 241: Glance at 2021, 2024 and 2030 Chinese Natural Vitamin E Tocotrienols Market Share (%) by End-use Application - Dietary Supplements, Food & Beverages and Cosmetics
INDIA
- Chart 242: Indian Natural Vitamin E Market Analysis (2021-2030) by End-use Application - Animal Feed, Dietary Supplements, Food & Beverages, Cosmetics and Others in Metric Tons
- Chart 243: Glance at 2021, 2024 and 2030 Indian Natural Vitamin E Market Share (%) by End-use Application - Animal Feed, Dietary Supplements, Food & Beverages, Cosmetics and Others
- Chart 244: Indian Natural Vitamin E Market Analysis (2021-2030) by End-use Application - Animal Feed, Dietary Supplements, Food & Beverages, Cosmetics and Others in US$ Million
- Chart 245: Glance at 2021, 2024 and 2030 Indian Natural Vitamin E Market Share (%) by End-use Application - Animal Feed, Dietary Supplements, Food & Beverages, Cosmetics and Others
- Chart 246: Indian Natural Vitamin E Market Analysis (2021-2030) by Type - Tocopherols and Tocotrienols in Metric Tons
- Chart 247: Glance at 2021, 2024 and 2030 Indian Natural Vitamin E Market Share (%) by Type - Tocopherols and Tocotrienols
- Chart 248: Indian Natural Vitamin E Market Analysis (2021-2030) by Type - Tocopherols and Tocotrienols in US$ Million
- Chart 249: Glance at 2021, 2024 and 2030 Indian Natural Vitamin E Market Share (%) by Type - Tocopherols and Tocotrienols
- Chart 250: Indian Natural Vitamin E Tocopherols Market Analysis (2021-2030) by End-use Application - Animal Feed, Dietary Supplements, Food & Beverages, Cosmetics and Others in Metric Tons
- Chart 251: Glance at 2021, 2024 and 2030 Indian Natural Vitamin E Tocopherols Market Share (%) by End-use Application - Animal Feed, Dietary Supplements, Food & Beverages, Cosmetics and Others
- Chart 252: Indian Natural Vitamin E Tocopherols Market Analysis (2021-2030) by End-use Application - Animal Feed, Dietary Supplements, Food & Beverages, Cosmetics and Others in US$ Million
- Chart 253: Glance at 2021, 2024 and 2030 Indian Natural Vitamin E Tocopherols Market Share (%) by End-use Application - Animal Feed, Dietary Supplements, Food & Beverages, Cosmetics and Others
- Chart 254: Indian Natural Vitamin E Tocotrienols Market Analysis (2021-2030) by End-use Application - Dietary Supplements and Others in Metric Tons
- Chart 255: Glance at 2021, 2024 and 2030 Indian Natural Vitamin E Tocotrienols Market Share (%) by End-use Application - Dietary Supplements and Others
- Chart 256: Indian Natural Vitamin E Tocotrienols Market Analysis (2021-2030) by End-use Application - Dietary Supplements and Others in US$ Million
- Chart 257: Glance at 2021, 2024 and 2030 Indian Natural Vitamin E Tocotrienols Market Share (%) by End-use Application - Dietary Supplements and Others
JAPAN
- Chart 258: Japanese Natural Vitamin E Market Analysis (2021-2030) by End-use Application - Animal Feed, Dietary Supplements, Food & Beverages, Cosmetics and Others in Metric Tons
- Chart 259: Glance at 2021, 2024 and 2030 Japanese Natural Vitamin E Market Share (%) by End-use Application - Animal Feed, Dietary Supplements, Food & Beverages, Cosmetics and Others
- Chart 260: Japanese Natural Vitamin E Market Analysis (2021-2030) by End-use Application - Animal Feed, Dietary Supplements, Food & Beverages, Cosmetics and Others in US$ Million
- Chart 261: Glance at 2021, 2024 and 2030 Japanese Natural Vitamin E Market Share (%) by End-use Application - Animal Feed, Dietary Supplements, Food & Beverages, Cosmetics and Others
- Chart 262: Japanese Natural Vitamin E Market Analysis (2021-2030) by Type - Tocopherols and Tocotrienols in Metric Tons
- Chart 263: Glance at 2021, 2024 and 2030 Japanese Natural Vitamin E Market Share (%) by Type - Tocopherols and Tocotrienols
- Chart 264: Japanese Natural Vitamin E Market Analysis (2021-2030) by Type - Tocopherols and Tocotrienols in US$ Million
- Chart 265: Glance at 2021, 2024 and 2030 Japanese Natural Vitamin E Market Share (%) by Type - Tocopherols and Tocotrienols
- Chart 266: Japanese Natural Vitamin E Tocopherols Market Analysis (2021-2030) by End-use Application - Animal Feed, Dietary Supplements, Food & Beverages, Cosmetics and Others in Metric Tons
- Chart 267: Glance at 2021, 2024 and 2030 Japanese Natural Vitamin E Tocopherols Market Share (%) by End-use Application - Animal Feed, Dietary Supplements, Food & Beverages, Cosmetics and Others
- Chart 268: Japanese Natural Vitamin E Tocopherols Market Analysis (2021-2030) by End-use Application - Animal Feed, Dietary Supplements, Food & Beverages, Cosmetics and Others in US$ Million
- Chart 269: Glance at 2021, 2024 and 2030 Japanese Natural Vitamin E Tocopherols Market Share (%) by End-use Application - Animal Feed, Dietary Supplements, Food & Beverages, Cosmetics and Others
- Chart 270: Japanese Natural Vitamin E Tocotrienols Market Analysis (2021-2030) by End-use Application - Dietary Supplements, Food & Beverages and Cosmetics in Metric Tons
- Chart 271: Glance at 2021, 2024 and 2030 Japanese Natural Vitamin E Tocotrienols Market Share (%) by End-use Application - Dietary Supplements, Food & Beverages and Cosmetics
- Chart 272: Japanese Natural Vitamin E Tocotrienols Market Analysis (2021-2030) by End-use Application - Dietary Supplements, Food & Beverages and Cosmetics in US$ Million
- Chart 273: Glance at 2021, 2024 and 2030 Japanese Natural Vitamin E Tocotrienols Market Share (%) by End-use Application - Dietary Supplements, Food & Beverages and Cosmetics
REST OF ASIA-PACIFIC
- Chart 274: Rest of Asia-Pacific Natural Vitamin E Market Analysis (2021-2030) by End-use Application - Animal Feed, Dietary Supplements, Food & Beverages, Cosmetics and Others in Metric Tons
- Chart 275: Glance at 2021, 2024 and 2030 Rest of Asia-Pacific Natural Vitamin E Market Share (%) by End-use Application - Animal Feed, Dietary Supplements, Food & Beverages, Cosmetics and Others
- Chart 276: Rest of Asia-Pacific Natural Vitamin E Market Analysis (2021-2030) by End-use Application - Animal Feed, Dietary Supplements, Food & Beverages, Cosmetics and Others in US$ Million
- Chart 277: Glance at 2021, 2024 and 2030 Rest of Asia-Pacific Natural Vitamin E Market Share (%) by End-use Application - Animal Feed, Dietary Supplements, Food & Beverages, Cosmetics and Others
- Chart 278: Rest of Asia-Pacific Natural Vitamin E Market Analysis (2021-2030) by Type - Tocopherols and Tocotrienols in Metric Tons
- Chart 279: Glance at 2021, 2024 and 2030 Rest of Asia-Pacific Natural Vitamin E Market Share (%) by Type - Tocopherols and Tocotrienols
- Chart 280: Rest of Asia-Pacific Natural Vitamin E Market Analysis (2021-2030) by Type - Tocopherols and Tocotrienols in US$ Million
- Chart 281: Glance at 2021, 2024 and 2030 Rest of Asia-Pacific Natural Vitamin E Market Share (%) by Type - Tocopherols and Tocotrienols
- Chart 282: Rest of Asia-Pacific Natural Vitamin E Tocopherols Market Analysis (2021-2030) by End-use Application - Animal Feed, Dietary Supplements, Food & Beverages, Cosmetics and Others in Metric Tons
- Chart 283: Glance at 2021, 2024 and 2030 Rest of Asia-Pacific Natural Vitamin E Tocopherols Market Share (%) by End-use Application - Animal Feed, Dietary Supplements, Food & Beverages, Cosmetics and Others
- Chart 284: Rest of Asia-Pacific Natural Vitamin E Tocopherols Market Analysis (2021-2030) by End-use Application - Animal Feed, Dietary Supplements, Food & Beverages, Cosmetics and Others in US$ Million
- Chart 285: Glance at 2021, 2024 and 2030 Rest of Asia-Pacific Natural Vitamin E Tocopherols Market Share (%) by End-use Application - Animal Feed, Dietary Supplements, Food & Beverages, Cosmetics and Others
- Chart 286: Rest of Asia-Pacific Natural Vitamin E Tocotrienols Market Analysis (2021-2030) by End-use Application - Dietary Supplements, Food & Beverages and Cosmetics in Metric Tons
- Chart 287: Glance at 2021, 2024 and 2030 Rest of Asia-Pacific Natural Vitamin E Tocotrienols Market Share (%) by End-use Application - Dietary Supplements, Food & Beverages and Cosmetics
- Chart 288: Rest of Asia-Pacific Natural Vitamin E Tocotrienols Market Analysis (2021-2030) by End-use Application - Dietary Supplements, Food & Beverages and Cosmetics in US$ Million
- Chart 289: Glance at 2021, 2024 and 2030 Rest of Asia-Pacific Natural Vitamin E Tocotrienols Market Share (%) by End-use Application - Dietary Supplements, Food & Beverages and Cosmetics
SOUTH AMERICA
- Chart 290: South American Natural Vitamin E Tocopherols Market Analysis (2021-2030) by Volume in Metric Tons and Value in US$ Million
- Chart 291: South American Natural Vitamin E Tocopherols Market Analysis (2021-2030) by End-use Application - Animal Feed, Dietary Supplements, Food & Beverages, Cosmetics and Others in Metric Tons
- Chart 292: Glance at 2021, 2024 and 2030 South American Natural Vitamin E Tocopherols Market Share (%) by End-use Application - Animal Feed, Dietary Supplements, Food & Beverages, Cosmetics and Others
- Chart 293: South American Natural Vitamin E Tocopherols Market Analysis (2021-2030) by End-use Application - Animal Feed, Dietary Supplements, Food & Beverages, Cosmetics and Others in US$ Million
- Chart 294: Glance at 2021, 2024 and 2030 South American Natural Vitamin E Tocopherols Market Share (%) by End-use Application - Animal Feed, Dietary Supplements, Food & Beverages, Cosmetics and Others
- Chart 295: South American Natural Vitamin E Tocopherols Market Analysis (2021-2030) by Geographic Region - Brazil, Argentina and Rest of SA in Metric Tons
- Chart 296: Glance at 2021, 2024 and 2030 South American Natural Vitamin E Tocopherols Market Share (%) by Geographic Region - Brazil, Argentina and Rest of SA
- Chart 297: South American Natural Vitamin E Tocopherols Market Analysis (2021-2030) by Geographic Region - Brazil, Argentina and Rest of SA in US$ Million
- Chart 298: Glance at 2021, 2024 and 2030 South American Natural Vitamin E Tocopherols Market Share (%) by Geographic Region - Brazil, Argentina and Rest of SA
ARGENTINA
- Chart 299: Argentine Natural Vitamin E Tocopherols Market Analysis (2021-2030) by End-use Application - Animal Feed, Dietary Supplements, Food & Beverages and Others in Metric Tons
- Chart 300: Glance at 2021, 2024 and 2030 Argentine Natural Vitamin E Tocopherols Market Share (%) by End-use Application - Animal Feed, Dietary Supplements, Food & Beverages and Others
- Chart 301: Argentine Natural Vitamin E Tocopherols Market Analysis (2021-2030) by End-use Application - Animal Feed, Dietary Supplements, Food & Beverages and Others in US$ Million
- Chart 302: Glance at 2021, 2024 and 2030 Argentine Natural Vitamin E Tocopherols Market Share (%) by End-use Application - Animal Feed, Dietary Supplements, Food & Beverages and Others
BRAZIL
- Chart 303: Brazilian Natural Vitamin E Tocopherols Market Analysis (2021-2030) by End-use Application - Animal Feed, Dietary Supplements, Food & Beverages, Cosmetics and Others in Metric Tons
- Chart 304: Glance at 2021, 2024 and 2030 Brazilian Natural Vitamin E Tocopherols Market Share (%) by End-use Application - Animal Feed, Dietary Supplements, Food & Beverages, Cosmetics and Others
- Chart 305: Brazilian Natural Vitamin E Tocopherols Market Analysis (2021-2030) by End-use Application - Animal Feed, Dietary Supplements, Food & Beverages, Cosmetics and Others in US$ Million
- Chart 306: Glance at 2021, 2024 and 2030 Brazilian Natural Vitamin E Tocopherols Market Share (%) by End-use Application - Animal Feed, Dietary Supplements, Food & Beverages, Cosmetics and Others
REST OF SOUTH AMERICA
- Chart 307: Rest of South America Natural Vitamin E Tocopherols Market Analysis (2021-2030) by End-use Application - Animal Feed, Dietary Supplements, Food & Beverages and Others in Metric Tons
- Chart 308: Glance at 2021, 2024 and 2030 Rest of South America Natural Vitamin E Tocopherols Market Share (%) by End-use Application - Animal Feed, Dietary Supplements, Food & Beverages and Others
- Chart 309: Rest of South America Natural Vitamin E Tocopherols Market Analysis (2021-2030) by End-use Application - Animal Feed, Dietary Supplements, Food & Beverages and Others in US$ Million
- Chart 310: Glance at 2021, 2024 and 2030 Rest of South America Natural Vitamin E Tocopherols Market Share (%) by End-use Application - Animal Feed, Dietary Supplements, Food & Beverages and Others
REST OF WORLD
- Chart 311: Rest of World Natural Vitamin E Market Analysis (2021-2030) by Volume in Metric Tons and Value in US$ Million
- Chart 312: Rest of World Natural Vitamin E Market Analysis (2021-2030) by End-use Application - Animal Feed, Dietary Supplements, Food & Beverages, Cosmetics and Others in Metric Tons
- Chart 313: Glance at 2021, 2024 and 2030 Rest of World Natural Vitamin E Market Share (%) by End-use Application - Animal Feed, Dietary Supplements, Food & Beverages, Cosmetics and Others
- Chart 314: Rest of World Natural Vitamin E Market Analysis (2021-2030) by End-use Application - Animal Feed, Dietary Supplements, Food & Beverages, Cosmetics and Others in US$ Million
- Chart 315: Glance at 2021, 2024 and 2030 Rest of World Natural Vitamin E Market Share (%) by End-use Application - Animal Feed, Dietary Supplements, Food & Beverages, Cosmetics and Others
- Chart 316: Rest of World Natural Vitamin E Market Analysis (2021-2030) by Type - Tocopherols and Tocotrienols in Metric Tons
- Chart 317: Glance at 2021, 2024 and 2030 Rest of World Natural Vitamin E Market Share (%) by Type - Tocopherols and Tocotrienols
- Chart 318: Rest of World Natural Vitamin E Market Analysis (2021-2030) by Type - Tocopherols and Tocotrienols in US$ Million
- Chart 319: Glance at 2021, 2024 and 2030 Rest of World Natural Vitamin E Market Share (%) by Type - Tocopherols and Tocotrienols
- Chart 320: Rest of World Natural Vitamin E Tocopherols Market Analysis (2021-2030) by Volume in Metric Tons and Value in US$ Million
- Chart 321: Rest of World Natural Vitamin E Tocopherols Market Analysis (2021-2030) by End-use Application - Animal Feed, Dietary Supplements, Food & Beverages, Cosmetics and Others in Metric Tons
- Chart 322: Glance at 2021, 2024 and 2030 Rest of World Natural Vitamin E Tocopherols Market Share (%) by End-use Application - Animal Feed, Dietary Supplements, Food & Beverages, Cosmetics and Others
- Chart 323: Rest of World Natural Vitamin E Tocopherols Market Analysis (2021-2030) by End-use Application - Animal Feed, Dietary Supplements, Food & Beverages, Cosmetics and Others in US$ Million
- Chart 324: Glance at 2021, 2024 and 2030 Rest of World Natural Vitamin E Tocopherols Market Share (%) by End-use Application - Animal Feed, Dietary Supplements, Food & Beverages, Cosmetics and Others
- Chart 325: Rest of World Natural Vitamin E Natural Vitamin E Tocotrienols Market Analysis (2021-2030) by Volume in Metric Tons and Value in US$ Million
- Chart 326: Rest of World Natural Vitamin E Tocotrienols Market Analysis (2021-2030) by End-use Application - Dietary Supplements and Others in Metric Tons
- Chart 327: Glance at 2021, 2024 and 2030 Rest of World Natural Vitamin E Tocotrienols Market Share (%) by End-use Application - Dietary Supplements and Others
- Chart 328: Rest of World Natural Vitamin E Tocotrienols Market Analysis (2021-2030) by End-use Application - Dietary Supplements and Others in US$ Million
- Chart 329: Glance at 2021, 2024 and 2030 Rest of World Natural Vitamin E Tocotrienols Market Share (%) by End-use Application - Dietary Supplements and Others

