
PUBLISHER: 360iResearch | PRODUCT CODE: 1413912

PUBLISHER: 360iResearch | PRODUCT CODE: 1413912
Digital Power Meters Market by Phase (Single Phase, Three Phase), Application (Commercial, Industrial, Residential) - Global Forecast 2024-2030
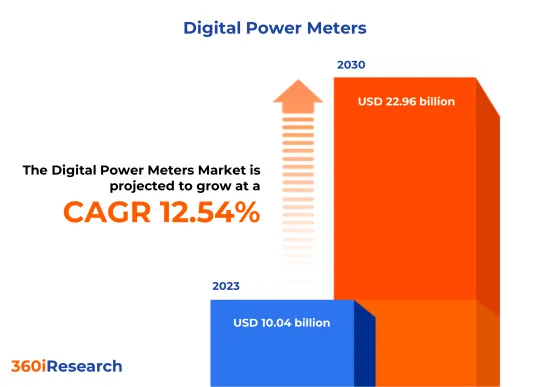
[189 Pages Report] The Digital Power Meters Market size was estimated at USD 10.04 billion in 2023 and expected to reach USD 11.26 billion in 2024, at a CAGR 12.54% to reach USD 22.96 billion by 2030.
Global Digital Power Meters Market
| KEY MARKET STATISTICS | |
|---|---|
| Base Year [2023] | USD 10.04 billion |
| Estimated Year [2024] | USD 11.26 billion |
| Forecast Year [2030] | USD 22.96 billion |
| CAGR (%) | 12.54% |
Digital Power Meters are advanced measurement devices that record the amount of electric energy consumed by a residence, business establishment, or an electronically powered device. Unlike their analog predecessors, these meters employ digital technology to collect, process, and display the data. They are known for their high accuracy, reliability, and ability to provide detailed information about power usage over time. These meters typically feature a digital display and may incorporate sophisticated functions such as time-of-use billing, data communication, and remote reading capabilities. They can monitor various electrical parameters, including voltage, current, power factor, and kilowatt-hours (kWh) energy consumption. Growing number of smart homes with increasing awareness about energy conservation and government initiatives for energy management and smart grid technologies increases the adoption of digital power meters. However, concerns regarding data security and the complex functionality of digital meters with high initial costs may impede market growth. Nevertheless, developing sophisticated energy management software with research into advanced battery storage integration is anticipated to create lucrative opportunities for market growth.
Regional Insights
The Americas is showcasing a strong demand for digital power meters driven by concerted efforts for energy efficiency and grid modernization. These countries have become significant digital power meter technology consumers with many smart homes and an ongoing transition to smart grids. Customers in these territories are inclined towards integrated solutions providing real-time monitoring and energy management. Initiatives such as the U.S. Smart Grid Investment Grant (SGIG) and Canada's Smart Grid Program underline the region's focus on enhancing power grid infrastructure, propelling demand for advanced metering devices. The EMEA region presents a diverse market landscape for digital power meters. The European Union's drive for digitalization and sustainable energy has significantly spurred the adoption of innovative metering solutions. Requirements for energy saving and efficient resource management make EU countries avid adopters of innovative grid technologies. Customers prefer products that align with stringent regulatory standards and provide data security. With its growing infrastructure and smart city projects, the Middle East is becoming increasingly receptive to advanced metering infrastructure (AMI). In Africa, there is growing awareness and adoption driven by the need for electricity monitoring and theft reduction. Several African countries now leverage mobile technology integration for pre-paid digital power meter solutions. The digital power meter market in Asia Pacific is driven by massive infrastructure projects that demand highly efficient power management systems. Furthermore, countries in this region focus on energy conservation and technologically sophisticated infrastructure that contributes significantly to market demand, with customer preferences skewed towards high-precision and durable power meters.
FPNV Positioning Matrix
The FPNV Positioning Matrix is pivotal in evaluating the Digital Power Meters Market. It offers a comprehensive assessment of vendors, examining key metrics related to Business Strategy and Product Satisfaction. This in-depth analysis empowers users to make well-informed decisions aligned with their requirements. Based on the evaluation, the vendors are then categorized into four distinct quadrants representing varying levels of success: Forefront (F), Pathfinder (P), Niche (N), or Vital (V).
Market Share Analysis
The Market Share Analysis is a comprehensive tool that provides an insightful and in-depth examination of the current state of vendors in the Digital Power Meters Market. By meticulously comparing and analyzing vendor contributions in terms of overall revenue, customer base, and other key metrics, we can offer companies a greater understanding of their performance and the challenges they face when competing for market share. Additionally, this analysis provides valuable insights into the competitive nature of the sector, including factors such as accumulation, fragmentation dominance, and amalgamation traits observed over the base year period studied. With this expanded level of detail, vendors can make more informed decisions and devise effective strategies to gain a competitive edge in the market.
Key Company Profiles
The report delves into recent significant developments in the Digital Power Meters Market, highlighting leading vendors and their innovative profiles. These include ABB Ltd., Advanced Electronics Company, Carrel Electrade Limited, Circutor SA, EASTRON ELECTRONIC CO., LTD., Eaton Corporation PLC, EKM Metering Inc., Elster Group GmbH by Honeywell International Inc., General Electric company, Holley Technology Ltd., HPL Electric and Power Limited, Iskraemeco Group, Itron, Inc., Jiangsu Linyang Energy Co., Ltd., Kamstrup A/S, Landis+Gyr AG, Murata Manufacturing Co., Ltd., Ningbo Sanxing Electric Co. Ltd., Osaki Electric Co. Ltd., Schneider Electric SE, Sensus by Xylem Inc., Siemens AG, Simpson Electric Company, Inc., TE Connectivity Ltd., and Wasion International Co., Ltd..
Market Segmentation & Coverage
This research report categorizes the Digital Power Meters Market to forecast the revenues and analyze trends in each of the following sub-markets:
- Phase
- Single Phase
- Three Phase
- Application
- Commercial
- Industrial
- Residential
- Region
- Americas
- Argentina
- Brazil
- Canada
- Mexico
- United States
- California
- Florida
- Illinois
- New York
- Ohio
- Pennsylvania
- Texas
- Asia-Pacific
- Australia
- China
- India
- Indonesia
- Japan
- Malaysia
- Philippines
- Singapore
- South Korea
- Taiwan
- Thailand
- Vietnam
- Europe, Middle East & Africa
- Denmark
- Egypt
- Finland
- France
- Germany
- Israel
- Italy
- Netherlands
- Nigeria
- Norway
- Poland
- Qatar
- Russia
- Saudi Arabia
- South Africa
- Spain
- Sweden
- Switzerland
- Turkey
- United Arab Emirates
- United Kingdom
- Americas
The report offers valuable insights on the following aspects:
1. Market Penetration: It presents comprehensive information on the market provided by key players.
2. Market Development: It delves deep into lucrative emerging markets and analyzes the penetration across mature market segments.
3. Market Diversification: It provides detailed information on new product launches, untapped geographic regions, recent developments, and investments.
4. Competitive Assessment & Intelligence: It conducts an exhaustive assessment of market shares, strategies, products, certifications, regulatory approvals, patent landscape, and manufacturing capabilities of the leading players.
5. Product Development & Innovation: It offers intelligent insights on future technologies, R&D activities, and breakthrough product developments.
The report addresses key questions such as:
1. What is the market size and forecast of the Digital Power Meters Market?
2. Which products, segments, applications, and areas should one consider investing in over the forecast period in the Digital Power Meters Market?
3. What are the technology trends and regulatory frameworks in the Digital Power Meters Market?
4. What is the market share of the leading vendors in the Digital Power Meters Market?
5. Which modes and strategic moves are suitable for entering the Digital Power Meters Market?
Table of Contents
1. Preface
- 1.1. Objectives of the Study
- 1.2. Market Segmentation & Coverage
- 1.3. Years Considered for the Study
- 1.4. Currency & Pricing
- 1.5. Language
- 1.6. Limitations
- 1.7. Assumptions
- 1.8. Stakeholders
2. Research Methodology
- 2.1. Define: Research Objective
- 2.2. Determine: Research Design
- 2.3. Prepare: Research Instrument
- 2.4. Collect: Data Source
- 2.5. Analyze: Data Interpretation
- 2.6. Formulate: Data Verification
- 2.7. Publish: Research Report
- 2.8. Repeat: Report Update
3. Executive Summary
4. Market Overview
- 4.1. Introduction
- 4.2. Digital Power Meters Market, by Region
5. Market Insights
- 5.1. Market Dynamics
- 5.1.1. Drivers
- 5.1.1.1. Growing number of smart homes with increasing awareness about energy conservation
- 5.1.1.2. Government initiatives for energy management and smart grid technologies
- 5.1.1.3. Increasing need for remote monitoring and control of energy usage
- 5.1.2. Restraints
- 5.1.2.1. High initial investment in digital power meter infrastructure
- 5.1.3. Opportunities
- 5.1.3.1. Expanding capabilities of digital power meters due to innovations in IoT and data analytics
- 5.1.3.2. Development of sophisticated energy management software with research into advanced battery storage integration
- 5.1.4. Challenges
- 5.1.4.1. Concern regarding data security and complex functionality of digital meters
- 5.1.1. Drivers
- 5.2. Market Segmentation Analysis
- 5.2.1. Phase: Three-phase meters are essential in industrial settings due to their ability to handle high loads and maintain power quality
- 5.2.2. Application: Evolving usage of digital power meters in the commercial sector
- 5.3. Market Trend Analysis
- 5.4. Cumulative Impact of High Inflation
- 5.5. Porter's Five Forces Analysis
- 5.5.1. Threat of New Entrants
- 5.5.2. Threat of Substitutes
- 5.5.3. Bargaining Power of Customers
- 5.5.4. Bargaining Power of Suppliers
- 5.5.5. Industry Rivalry
- 5.6. Value Chain & Critical Path Analysis
- 5.7. Regulatory Framework
6. Digital Power Meters Market, by Phase
- 6.1. Introduction
- 6.2. Single Phase
- 6.3. Three Phase
7. Digital Power Meters Market, by Application
- 7.1. Introduction
- 7.2. Commercial
- 7.3. Industrial
- 7.4. Residential
8. Americas Digital Power Meters Market
- 8.1. Introduction
- 8.2. Argentina
- 8.3. Brazil
- 8.4. Canada
- 8.5. Mexico
- 8.6. United States
9. Asia-Pacific Digital Power Meters Market
- 9.1. Introduction
- 9.2. Australia
- 9.3. China
- 9.4. India
- 9.5. Indonesia
- 9.6. Japan
- 9.7. Malaysia
- 9.8. Philippines
- 9.9. Singapore
- 9.10. South Korea
- 9.11. Taiwan
- 9.12. Thailand
- 9.13. Vietnam
10. Europe, Middle East & Africa Digital Power Meters Market
- 10.1. Introduction
- 10.2. Denmark
- 10.3. Egypt
- 10.4. Finland
- 10.5. France
- 10.6. Germany
- 10.7. Israel
- 10.8. Italy
- 10.9. Netherlands
- 10.10. Nigeria
- 10.11. Norway
- 10.12. Poland
- 10.13. Qatar
- 10.14. Russia
- 10.15. Saudi Arabia
- 10.16. South Africa
- 10.17. Spain
- 10.18. Sweden
- 10.19. Switzerland
- 10.20. Turkey
- 10.21. United Arab Emirates
- 10.22. United Kingdom
11. Competitive Landscape
- 11.1. FPNV Positioning Matrix
- 11.2. Market Share Analysis, By Key Player
- 11.3. Competitive Scenario Analysis, By Key Player
- 11.3.1. Merger & Acquisition
- 11.3.1.1. Gridspertise Acquires Nordic Metering Provider Aidon
- 11.3.2. New Product Launch & Enhancement
- 11.3.2.1. ABB India Strengthens its Portfolio of Energy Efficiency Devices with a New Range of Smart Metering Solutions for Efficient Energy Management
- 11.3.3. Award, Recognition, & Expansion
- 11.3.3.1. Adani Energy forms JV with IHC-backed Firm to Expand Smart-Meter Business
- 11.3.1. Merger & Acquisition
12. Competitive Portfolio
- 12.1. Key Company Profiles
- 12.1.1. ABB Ltd.
- 12.1.2. Advanced Electronics Company
- 12.1.3. Carrel Electrade Limited
- 12.1.4. Circutor SA
- 12.1.5. EASTRON ELECTRONIC CO., LTD.
- 12.1.6. Eaton Corporation PLC
- 12.1.7. EKM Metering Inc.
- 12.1.8. Elster Group GmbH by Honeywell International Inc.
- 12.1.9. General Electric company
- 12.1.10. Holley Technology Ltd.
- 12.1.11. HPL Electric and Power Limited
- 12.1.12. Iskraemeco Group
- 12.1.13. Itron, Inc.
- 12.1.14. Jiangsu Linyang Energy Co., Ltd.
- 12.1.15. Kamstrup A/S
- 12.1.16. Landis+Gyr AG
- 12.1.17. Murata Manufacturing Co., Ltd.
- 12.1.18. Ningbo Sanxing Electric Co. Ltd.
- 12.1.19. Osaki Electric Co. Ltd.
- 12.1.20. Schneider Electric SE
- 12.1.21. Sensus by Xylem Inc.
- 12.1.22. Siemens AG
- 12.1.23. Simpson Electric Company, Inc.
- 12.1.24. TE Connectivity Ltd.
- 12.1.25. Wasion International Co., Ltd.
- 12.2. Key Product Portfolio
13. Appendix
- 13.1. Discussion Guide
- 13.2. License & Pricing
LIST OF FIGURES
- FIGURE 1. DIGITAL POWER METERS MARKET RESEARCH PROCESS
- FIGURE 2. DIGITAL POWER METERS MARKET SIZE, 2023 VS 2030
- FIGURE 3. DIGITAL POWER METERS MARKET SIZE, 2018-2030 (USD MILLION)
- FIGURE 4. DIGITAL POWER METERS MARKET SIZE, BY REGION, 2023 VS 2030 (%)
- FIGURE 5. DIGITAL POWER METERS MARKET SIZE, BY REGION, 2023 VS 2024 VS 2030 (USD MILLION)
- FIGURE 6. DIGITAL POWER METERS MARKET DYNAMICS
- FIGURE 7. DIGITAL POWER METERS MARKET SIZE, BY PHASE, 2023 VS 2030 (%)
- FIGURE 8. DIGITAL POWER METERS MARKET SIZE, BY PHASE, 2023 VS 2024 VS 2030 (USD MILLION)
- FIGURE 9. DIGITAL POWER METERS MARKET SIZE, BY APPLICATION, 2023 VS 2030 (%)
- FIGURE 10. DIGITAL POWER METERS MARKET SIZE, BY APPLICATION, 2023 VS 2024 VS 2030 (USD MILLION)
- FIGURE 11. AMERICAS DIGITAL POWER METERS MARKET SIZE, BY COUNTRY, 2023 VS 2030 (%)
- FIGURE 12. AMERICAS DIGITAL POWER METERS MARKET SIZE, BY COUNTRY, 2023 VS 2024 VS 2030 (USD MILLION)
- FIGURE 13. UNITED STATES DIGITAL POWER METERS MARKET SIZE, BY STATE, 2023 VS 2030 (%)
- FIGURE 14. UNITED STATES DIGITAL POWER METERS MARKET SIZE, BY STATE, 2023 VS 2024 VS 2030 (USD MILLION)
- FIGURE 15. ASIA-PACIFIC DIGITAL POWER METERS MARKET SIZE, BY COUNTRY, 2023 VS 2030 (%)
- FIGURE 16. ASIA-PACIFIC DIGITAL POWER METERS MARKET SIZE, BY COUNTRY, 2023 VS 2024 VS 2030 (USD MILLION)
- FIGURE 17. EUROPE, MIDDLE EAST & AFRICA DIGITAL POWER METERS MARKET SIZE, BY COUNTRY, 2023 VS 2030 (%)
- FIGURE 18. EUROPE, MIDDLE EAST & AFRICA DIGITAL POWER METERS MARKET SIZE, BY COUNTRY, 2023 VS 2024 VS 2030 (USD MILLION)
- FIGURE 19. DIGITAL POWER METERS MARKET, FPNV POSITIONING MATRIX, 2023
- FIGURE 20. DIGITAL POWER METERS MARKET SHARE, BY KEY PLAYER, 2023
LIST OF TABLES
- TABLE 1. DIGITAL POWER METERS MARKET SEGMENTATION & COVERAGE
- TABLE 2. UNITED STATES DOLLAR EXCHANGE RATE, 2018-2023
- TABLE 3. DIGITAL POWER METERS MARKET SIZE, 2018-2030 (USD MILLION)
- TABLE 4. GLOBAL DIGITAL POWER METERS MARKET SIZE, BY REGION, 2018-2030 (USD MILLION)
- TABLE 5. DIGITAL POWER METERS MARKET SIZE, BY PHASE, 2018-2030 (USD MILLION)
- TABLE 6. DIGITAL POWER METERS MARKET SIZE, BY SINGLE PHASE, BY REGION, 2018-2030 (USD MILLION)
- TABLE 7. DIGITAL POWER METERS MARKET SIZE, BY THREE PHASE, BY REGION, 2018-2030 (USD MILLION)
- TABLE 8. DIGITAL POWER METERS MARKET SIZE, BY APPLICATION, 2018-2030 (USD MILLION)
- TABLE 9. DIGITAL POWER METERS MARKET SIZE, BY COMMERCIAL, BY REGION, 2018-2030 (USD MILLION)
- TABLE 10. DIGITAL POWER METERS MARKET SIZE, BY INDUSTRIAL, BY REGION, 2018-2030 (USD MILLION)
- TABLE 11. DIGITAL POWER METERS MARKET SIZE, BY RESIDENTIAL, BY REGION, 2018-2030 (USD MILLION)
- TABLE 12. AMERICAS DIGITAL POWER METERS MARKET SIZE, BY PHASE, 2018-2030 (USD MILLION)
- TABLE 13. AMERICAS DIGITAL POWER METERS MARKET SIZE, BY APPLICATION, 2018-2030 (USD MILLION)
- TABLE 14. AMERICAS DIGITAL POWER METERS MARKET SIZE, BY COUNTRY, 2018-2030 (USD MILLION)
- TABLE 15. ARGENTINA DIGITAL POWER METERS MARKET SIZE, BY PHASE, 2018-2030 (USD MILLION)
- TABLE 16. ARGENTINA DIGITAL POWER METERS MARKET SIZE, BY APPLICATION, 2018-2030 (USD MILLION)
- TABLE 17. BRAZIL DIGITAL POWER METERS MARKET SIZE, BY PHASE, 2018-2030 (USD MILLION)
- TABLE 18. BRAZIL DIGITAL POWER METERS MARKET SIZE, BY APPLICATION, 2018-2030 (USD MILLION)
- TABLE 19. CANADA DIGITAL POWER METERS MARKET SIZE, BY PHASE, 2018-2030 (USD MILLION)
- TABLE 20. CANADA DIGITAL POWER METERS MARKET SIZE, BY APPLICATION, 2018-2030 (USD MILLION)
- TABLE 21. MEXICO DIGITAL POWER METERS MARKET SIZE, BY PHASE, 2018-2030 (USD MILLION)
- TABLE 22. MEXICO DIGITAL POWER METERS MARKET SIZE, BY APPLICATION, 2018-2030 (USD MILLION)
- TABLE 23. UNITED STATES DIGITAL POWER METERS MARKET SIZE, BY PHASE, 2018-2030 (USD MILLION)
- TABLE 24. UNITED STATES DIGITAL POWER METERS MARKET SIZE, BY APPLICATION, 2018-2030 (USD MILLION)
- TABLE 25. UNITED STATES DIGITAL POWER METERS MARKET SIZE, BY STATE, 2018-2030 (USD MILLION)
- TABLE 26. ASIA-PACIFIC DIGITAL POWER METERS MARKET SIZE, BY PHASE, 2018-2030 (USD MILLION)
- TABLE 27. ASIA-PACIFIC DIGITAL POWER METERS MARKET SIZE, BY APPLICATION, 2018-2030 (USD MILLION)
- TABLE 28. ASIA-PACIFIC DIGITAL POWER METERS MARKET SIZE, BY COUNTRY, 2018-2030 (USD MILLION)
- TABLE 29. AUSTRALIA DIGITAL POWER METERS MARKET SIZE, BY PHASE, 2018-2030 (USD MILLION)
- TABLE 30. AUSTRALIA DIGITAL POWER METERS MARKET SIZE, BY APPLICATION, 2018-2030 (USD MILLION)
- TABLE 31. CHINA DIGITAL POWER METERS MARKET SIZE, BY PHASE, 2018-2030 (USD MILLION)
- TABLE 32. CHINA DIGITAL POWER METERS MARKET SIZE, BY APPLICATION, 2018-2030 (USD MILLION)
- TABLE 33. INDIA DIGITAL POWER METERS MARKET SIZE, BY PHASE, 2018-2030 (USD MILLION)
- TABLE 34. INDIA DIGITAL POWER METERS MARKET SIZE, BY APPLICATION, 2018-2030 (USD MILLION)
- TABLE 35. INDONESIA DIGITAL POWER METERS MARKET SIZE, BY PHASE, 2018-2030 (USD MILLION)
- TABLE 36. INDONESIA DIGITAL POWER METERS MARKET SIZE, BY APPLICATION, 2018-2030 (USD MILLION)
- TABLE 37. JAPAN DIGITAL POWER METERS MARKET SIZE, BY PHASE, 2018-2030 (USD MILLION)
- TABLE 38. JAPAN DIGITAL POWER METERS MARKET SIZE, BY APPLICATION, 2018-2030 (USD MILLION)
- TABLE 39. MALAYSIA DIGITAL POWER METERS MARKET SIZE, BY PHASE, 2018-2030 (USD MILLION)
- TABLE 40. MALAYSIA DIGITAL POWER METERS MARKET SIZE, BY APPLICATION, 2018-2030 (USD MILLION)
- TABLE 41. PHILIPPINES DIGITAL POWER METERS MARKET SIZE, BY PHASE, 2018-2030 (USD MILLION)
- TABLE 42. PHILIPPINES DIGITAL POWER METERS MARKET SIZE, BY APPLICATION, 2018-2030 (USD MILLION)
- TABLE 43. SINGAPORE DIGITAL POWER METERS MARKET SIZE, BY PHASE, 2018-2030 (USD MILLION)
- TABLE 44. SINGAPORE DIGITAL POWER METERS MARKET SIZE, BY APPLICATION, 2018-2030 (USD MILLION)
- TABLE 45. SOUTH KOREA DIGITAL POWER METERS MARKET SIZE, BY PHASE, 2018-2030 (USD MILLION)
- TABLE 46. SOUTH KOREA DIGITAL POWER METERS MARKET SIZE, BY APPLICATION, 2018-2030 (USD MILLION)
- TABLE 47. TAIWAN DIGITAL POWER METERS MARKET SIZE, BY PHASE, 2018-2030 (USD MILLION)
- TABLE 48. TAIWAN DIGITAL POWER METERS MARKET SIZE, BY APPLICATION, 2018-2030 (USD MILLION)
- TABLE 49. THAILAND DIGITAL POWER METERS MARKET SIZE, BY PHASE, 2018-2030 (USD MILLION)
- TABLE 50. THAILAND DIGITAL POWER METERS MARKET SIZE, BY APPLICATION, 2018-2030 (USD MILLION)
- TABLE 51. VIETNAM DIGITAL POWER METERS MARKET SIZE, BY PHASE, 2018-2030 (USD MILLION)
- TABLE 52. VIETNAM DIGITAL POWER METERS MARKET SIZE, BY APPLICATION, 2018-2030 (USD MILLION)
- TABLE 53. EUROPE, MIDDLE EAST & AFRICA DIGITAL POWER METERS MARKET SIZE, BY PHASE, 2018-2030 (USD MILLION)
- TABLE 54. EUROPE, MIDDLE EAST & AFRICA DIGITAL POWER METERS MARKET SIZE, BY APPLICATION, 2018-2030 (USD MILLION)
- TABLE 55. EUROPE, MIDDLE EAST & AFRICA DIGITAL POWER METERS MARKET SIZE, BY COUNTRY, 2018-2030 (USD MILLION)
- TABLE 56. DENMARK DIGITAL POWER METERS MARKET SIZE, BY PHASE, 2018-2030 (USD MILLION)
- TABLE 57. DENMARK DIGITAL POWER METERS MARKET SIZE, BY APPLICATION, 2018-2030 (USD MILLION)
- TABLE 58. EGYPT DIGITAL POWER METERS MARKET SIZE, BY PHASE, 2018-2030 (USD MILLION)
- TABLE 59. EGYPT DIGITAL POWER METERS MARKET SIZE, BY APPLICATION, 2018-2030 (USD MILLION)
- TABLE 60. FINLAND DIGITAL POWER METERS MARKET SIZE, BY PHASE, 2018-2030 (USD MILLION)
- TABLE 61. FINLAND DIGITAL POWER METERS MARKET SIZE, BY APPLICATION, 2018-2030 (USD MILLION)
- TABLE 62. FRANCE DIGITAL POWER METERS MARKET SIZE, BY PHASE, 2018-2030 (USD MILLION)
- TABLE 63. FRANCE DIGITAL POWER METERS MARKET SIZE, BY APPLICATION, 2018-2030 (USD MILLION)
- TABLE 64. GERMANY DIGITAL POWER METERS MARKET SIZE, BY PHASE, 2018-2030 (USD MILLION)
- TABLE 65. GERMANY DIGITAL POWER METERS MARKET SIZE, BY APPLICATION, 2018-2030 (USD MILLION)
- TABLE 66. ISRAEL DIGITAL POWER METERS MARKET SIZE, BY PHASE, 2018-2030 (USD MILLION)
- TABLE 67. ISRAEL DIGITAL POWER METERS MARKET SIZE, BY APPLICATION, 2018-2030 (USD MILLION)
- TABLE 68. ITALY DIGITAL POWER METERS MARKET SIZE, BY PHASE, 2018-2030 (USD MILLION)
- TABLE 69. ITALY DIGITAL POWER METERS MARKET SIZE, BY APPLICATION, 2018-2030 (USD MILLION)
- TABLE 70. NETHERLANDS DIGITAL POWER METERS MARKET SIZE, BY PHASE, 2018-2030 (USD MILLION)
- TABLE 71. NETHERLANDS DIGITAL POWER METERS MARKET SIZE, BY APPLICATION, 2018-2030 (USD MILLION)
- TABLE 72. NIGERIA DIGITAL POWER METERS MARKET SIZE, BY PHASE, 2018-2030 (USD MILLION)
- TABLE 73. NIGERIA DIGITAL POWER METERS MARKET SIZE, BY APPLICATION, 2018-2030 (USD MILLION)
- TABLE 74. NORWAY DIGITAL POWER METERS MARKET SIZE, BY PHASE, 2018-2030 (USD MILLION)
- TABLE 75. NORWAY DIGITAL POWER METERS MARKET SIZE, BY APPLICATION, 2018-2030 (USD MILLION)
- TABLE 76. POLAND DIGITAL POWER METERS MARKET SIZE, BY PHASE, 2018-2030 (USD MILLION)
- TABLE 77. POLAND DIGITAL POWER METERS MARKET SIZE, BY APPLICATION, 2018-2030 (USD MILLION)
- TABLE 78. QATAR DIGITAL POWER METERS MARKET SIZE, BY PHASE, 2018-2030 (USD MILLION)
- TABLE 79. QATAR DIGITAL POWER METERS MARKET SIZE, BY APPLICATION, 2018-2030 (USD MILLION)
- TABLE 80. RUSSIA DIGITAL POWER METERS MARKET SIZE, BY PHASE, 2018-2030 (USD MILLION)
- TABLE 81. RUSSIA DIGITAL POWER METERS MARKET SIZE, BY APPLICATION, 2018-2030 (USD MILLION)
- TABLE 82. SAUDI ARABIA DIGITAL POWER METERS MARKET SIZE, BY PHASE, 2018-2030 (USD MILLION)
- TABLE 83. SAUDI ARABIA DIGITAL POWER METERS MARKET SIZE, BY APPLICATION, 2018-2030 (USD MILLION)
- TABLE 84. SOUTH AFRICA DIGITAL POWER METERS MARKET SIZE, BY PHASE, 2018-2030 (USD MILLION)
- TABLE 85. SOUTH AFRICA DIGITAL POWER METERS MARKET SIZE, BY APPLICATION, 2018-2030 (USD MILLION)
- TABLE 86. SPAIN DIGITAL POWER METERS MARKET SIZE, BY PHASE, 2018-2030 (USD MILLION)
- TABLE 87. SPAIN DIGITAL POWER METERS MARKET SIZE, BY APPLICATION, 2018-2030 (USD MILLION)
- TABLE 88. SWEDEN DIGITAL POWER METERS MARKET SIZE, BY PHASE, 2018-2030 (USD MILLION)
- TABLE 89. SWEDEN DIGITAL POWER METERS MARKET SIZE, BY APPLICATION, 2018-2030 (USD MILLION)
- TABLE 90. SWITZERLAND DIGITAL POWER METERS MARKET SIZE, BY PHASE, 2018-2030 (USD MILLION)
- TABLE 91. SWITZERLAND DIGITAL POWER METERS MARKET SIZE, BY APPLICATION, 2018-2030 (USD MILLION)
- TABLE 92. TURKEY DIGITAL POWER METERS MARKET SIZE, BY PHASE, 2018-2030 (USD MILLION)
- TABLE 93. TURKEY DIGITAL POWER METERS MARKET SIZE, BY APPLICATION, 2018-2030 (USD MILLION)
- TABLE 94. UNITED ARAB EMIRATES DIGITAL POWER METERS MARKET SIZE, BY PHASE, 2018-2030 (USD MILLION)
- TABLE 95. UNITED ARAB EMIRATES DIGITAL POWER METERS MARKET SIZE, BY APPLICATION, 2018-2030 (USD MILLION)
- TABLE 96. UNITED KINGDOM DIGITAL POWER METERS MARKET SIZE, BY PHASE, 2018-2030 (USD MILLION)
- TABLE 97. UNITED KINGDOM DIGITAL POWER METERS MARKET SIZE, BY APPLICATION, 2018-2030 (USD MILLION)
- TABLE 98. DIGITAL POWER METERS MARKET, FPNV POSITIONING MATRIX, 2023
- TABLE 99. DIGITAL POWER METERS MARKET SHARE, BY KEY PLAYER, 2023
- TABLE 100. DIGITAL POWER METERS MARKET LICENSE & PRICING

