
PUBLISHER: Juniper Research Ltd | PRODUCT CODE: 1802910

PUBLISHER: Juniper Research Ltd | PRODUCT CODE: 1802910
eCommerce Payments Market: 2025-2030
'eCommerce Market to Surpass $13 Trillion by 2030 Globally, with Stripe, Visa, and PayPal Leading the Charge'
| KEY STATISTICS | |
|---|---|
| Total transaction value in 2025: | $8.3tn |
| Total transaction value in 2030: | $13tn |
| 2025 to 2030 market growth: | 57% |
| Forecast period: | 2025-2030 |
Overview
Juniper Research's "eCommerce Payments" research suite provides a comprehensive and insightful analysis of this market; enabling stakeholders, from eCommerce payment platform providers to merchants and payment service providers, to understand future growth, key trends, and the competitive environment.
The research suite includes several different options that can be purchased separately. The Market Trends & Strategies element includes an insightful analysis of the key areas of transformation and innovation within eCommerce payments, including new payment types and eCommerce models. Additionally, it features Juniper Research's Country Readiness Index, which provides a country-level analysis of the current and future opportunities for eCommerce payments in 61 different geographies.
The Data & Forecasting element includes access to data mapping the adoption and future growth of the eCommerce payments market over the next five years; split by digital goods versus physical goods transactions, and by eight key payment methods.
Additionally, the Competitor Leaderboard document features an extensive analysis of the 20 market leaders in the eCommerce payments space, positioning them based on capability and capacity, as well as on their product offering itself; offering a robust analysis of each vendor.
The coverage can also be purchased as a full research suite containing the Market Trends & Strategies, Data & Forecasting, and Competitor Leaderboard, and at a substantial discount.
Collectively, these documents provide a critical tool for understanding this important market. They allow eCommerce payment platform providers and payments companies to shape their future strategy; capitalising on future growth opportunities. The research suite's extensive coverage makes it a valuable tool for navigating this high-growth market.
All report content is delivered in the English language.
Key Features
- Key Takeaways & Strategic Recommendations: In-depth analysis of key development opportunities, key findings, and key strategic recommendations for eCommerce payment platforms, merchants, payment service providers, and banks.
- Market Outlook: Insights into key trends and market expansion challenges within the eCommerce Payments market; identifying consumer trends in popular payment methods, addressing the challenges eCommerce markets face regarding transaction fees, the changing trends in types of payment, how payment processors can facilitate interoperability, and the challenges and opportunities faced by online payment processors. Furthermore, the report includes analysis of new trends, such as agentic commerce. The research also features a Country Readiness Index on the current development and segment growth of the eCommerce Payments market across 61 key countries, as well as providing a future outlook.
- Benchmark Industry Forecasts: Extensive forecasts for the total value and number of eCommerce transactions, across both digital goods and physical goods channels, further split by payment type (A2A payments, BNPL, cash, credit card, debit card, digital wallet, Direct Carrier Billing, and other).
- Juniper Research Competitor Leaderboard: Key player capability and capacity assessment for 20 eCommerce payment platforms, via the Juniper Research Competitor Leaderboard.
SAMPLE VIEW
Market Data & Forecasting Report
The numbers tell you what's happening, but our written report details why, alongside the methodologies.
SAMPLE VIEW
Market Trends & Strategies Report
A comprehensive analysis of the current market landscape, alongside strategic recommendations.
Market Data & Forecasting Report
The market-leading research suite for the eCommerce payments market includes access to the full set of forecast data of 152 tables and over 54,000 datapoints.
Metrics in the research suite include:
- Total Transaction Volume and Value of the eCommerce Market
- Total Transaction Volume and Value for Physical and Digital Goods Channels
- Goods Purchased Online and via Mobile
- Total Volume and Value for eCommerce Transactions
- Purchased via Different Payment Methods, Including:
- Account-to-Account (A2A) payments
- Buy Now, Pay Later (BNPL)
- Cash Agents & Equivalents
- Credit Card
- Debit Card
- Digital Wallet
- Direct Carrier Billing
- Other
Juniper Research Interactive Forecast Excel contains the following functionality:
- Statistics Analysis: Users benefit from the ability to search for specific metrics; displayed for all regions and countries across the data period. Graphs are easily modified and can be exported to the clipboard.
- Country Data Tool: This tool enables users to look at metrics for all regions and countries in the forecast period. Users can refine the metrics displayed via a search bar.
- Country Comparison Tool: Users can select and compare countries. The ability to export graphs is included in this tool.
- What-if Analysis: Here, users can compare forecast metrics against their own assumptions, via 5 interactive scenarios.
Market Trends & Strategies Report
This report examines the "eCommerce payments" market landscape in detail; assessing market trends and factors shaping the evolution of this transforming market. It delivers comprehensive analysis of the strategic opportunities in the eCommerce payments landscape; assessing ways in which the market is changing based on different payment methods, and what this means for overall market growth. The report also examines key challenges and opportunities, as well as providing an evaluation of key country-level opportunities for eCommerce payments growth via a Country Readiness Index. Combined, the report provides an insightful resource for key stakeholders.
Competitor Leaderboard Report
The Competitor Leaderboard report provides coverage of 20 leading eCommerce payment platforms, positioning them as established leaders, leading challengers, or disruptors and challengers based on capacity and capability assessments.
The 20 vendors included are:
|
|
The Competitor Leaderboard gives a comprehensive guide to the competitive landscape within eCommerce payments; providing an important resource for stakeholders.
Table of Contents
Market Trends & Strategies
1. Key Takeaways & Strategic Recommendations
- 1.1. Key Takeaways
- 1.2. Strategic Recommendations
2. Market Landscape
- 2.1. Introduction & Definitions
- 2.2. History of eCommerce and eCommerce Payments
- 2.2.1. The Beginning of eCommerce
- 2.2.2. The Impact of the COVID-19 Pandemic
- 2.2.3. Recent Developments and Looking Ahead
- 2.3. Key Players in the eCommerce Payments Market
- 2.3.1. Understanding the Payments Stack: Gateways, Acquirers, Processors, and PSPs
- Figure 2.1: eCommerce Payments Process
- Figure 2.2: Payment Services Provided by PSPs
- i. Payment Gateways: Connecting Customers to the Payments Ecosystem
- ii. How Payment Gateways Work
- iii. External Gateways vs Embedded Checkouts
- 2.3.2. Acquirers and PayFacs: Infrastructure, Enablement, and the Shift Embedded Models
- i. What Acquirers Do, and Do Not Do
- ii. What is a PayFac?
- iii. The Evolution: PayFac-as-a-Service
- 2.3.3. Payments Orchestration Platforms: From Connector to Strategic Control Layer
- 2.3.1. Understanding the Payments Stack: Gateways, Acquirers, Processors, and PSPs
- 2.4. eCommerce Verticals
- 2.4.1. B2B eCommerce: The Hidden Role of Payments in Platform Transformation
- i. Consumerised Buying and Frictionless Checkout
- ii. Rep-free, Self-service Embedded Finance Journeys
- iii. Unified B2B/B2C Channels Enabled by Modular Payment Orchestration
- iv. Workflow Automation, Smart Settlement and Reconciliation
- v. Personalisation at Scale Powered by Adaptive Credit and Payment Models
- vi. Virtual Cards as a Strategic B2B Payment Rail
- 2.4.2. Customer-to-Customer (CC) Recommerce: Emerging Platform Trends Underpinned by Payments
- i. Platform-driven Identity and Reputation Systems
- ii. Gamification and Recirculation Incentives
- iii. Retailer-led Resale Channels
- iv. Onboarding the Informal Seller
- 2.4.3. Social Commerce: Emerging Platform Trends Underpinned by Payments
- i. Creator-led Commerce at Scale
- ii. Embedded Trust and Escrow Mechanics
- iii. Localised Compliance Meets Global Monetisation
- iv. Democratising Commerce Through Instant Onboarding
- 2.4.1. B2B eCommerce: The Hidden Role of Payments in Platform Transformation
- 2.5. Key Trends & Drivers
- 2.5.1. Local Acquiring As a Strategic Lever in Global Payments
- 2.5.2. Recurring Payments in the Subscription Economy: Reliability at Scale, Enabled by Infrastructure
- Figure 2.3: Subscription Economy Transaction Value, 2020-2030 ($m), Global
- 2.5.3. Regulatory Changes
- i. Europe's Regulatory Push: PSD3, Real-time, Competitive, and Sovereign Payments
- ii. US: Digital Wallet Oversight and Open Banking Uncertainty
- iii. China: Strengthening Oversight and Consumer Protection
- 2.5.4. Growth Opportunities in eCommerce Payments in 2025
- i. Real-time Payments Move to the Forefront
- ii. AI-driven Optimisation at Checkout
- iii. Local Payment Methods as the Global Default
- iv. Embedded Finance in Platforms and Marketplaces
- v. Extending Fraud Protection to SMEs
- 2.5.5. Challenges for eCommerce Payments in 2025
- i. Fragmentation of Payment Methods and Localisation Complexity
- ii. Rising Fraud and Operational Risk
- iii. Checkout Friction and Abandonment
- iv. Cross-border Settlement and Compliance Barriers
- v. Interoperability and Return Payments: Hidden Friction in the Payment Lifecycle
3. Segment Analysis
- 3.1. Payment Methods Landscape
- 3.1.1. Overview
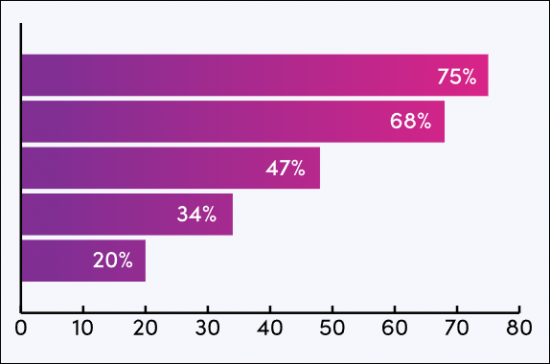
- Figure 3.1: Market Share of Payment Methods by Number of Remote Physical Goods Transactions (%), Globally, 2022, 2025 and 2030
- 3.1.2. Account-to-Account (A2A) Payments
- Figure 3.2: The Process of Making A2A Payments
- 3.1.3. Card Payments
- i. Credit Cards
- ii. Debit Cards
- iii. Prepaid Cards
- iv. Outlook for Card Payments in eCommerce
- 3.1.4. Digital Wallets
- Figure 3.3: Digital Wallet Funding Types
- i. Card-linked Wallets
- ii. Non-card-linked Wallets
- iii. Looking Ahead
- 3.1.5. Direct Carrier Billing (DCB)
- 3.1.6. Buy Now, Pay Later (BNPL)
- 3.1.7. Cash-based eCommerce Payments
- 3.1.8. Digital Assets and Token-based Payments: Cryptocurrency, Stablecoins & CBDCs
- i. Cryptocurrencies: Still Niche, but Useful in Select Verticals
- ii. Stablecoins: Gaining Momentum in Cross-border Commerce
- iii. Central Bank Digital Currencies (CBDCs): Still Experimental, but Promising
- iv. Outlook: Digital Assets in eCommerce Pragmatic, Not Ideological
- 3.1.1. Overview
- 3.2. eCommerce Market Segmentation
- 3.2.1. Large Multinational eCommerce Players
- 3.2.2. National eCommerce Brands
- 3.2.3. Small eCommerce Businesses
- 3.2.4. Vertical-specific eCommerce Payments
- i. Outlook: Payments As a Strategic Growth Lever
4. Country Readiness Index
- 4.1. Introduction to the Country Readiness Index
- Figure 4.1: Juniper Research Country Readiness Index Scoring Criteria: eCommerce Payments
- Figure 4.2: Juniper Research Country Readiness Index: eCommerce Payments
- Figure 4.3: Juniper Research Country Readiness Index: eCommerce Payments Market Segments
- 4.2. Index Analysis
- 4.2.1. Focus Markets: Driving the Global eCommerce Payments Landscape
Competitor Leaderboard
1. Key Takeaways & Strategic Recommendations
- 1.1. Key Takeaways
- 1.2. Strategic Recommendations
2. Market Landscape
- 2.1. Introduction & Definitions
- 2.2. History of eCommerce and eCommerce Payments
- 2.2.1. The Beginning of eCommerce
- 2.2.2. The Impact of the COVID-19 Pandemic
- 2.2.3. Recent Developments and Looking Ahead
- 2.3. Key Players in the eCommerce Payments Market
- 2.3.1. Understanding the Payments Stack: Gateways, Acquirers, Processors, and PSPs
- Figure 2.1: eCommerce Payments Process
- Figure 2.2: Payment Services Provided by PSPs
- i. Payment Gateways: Connecting Customers to the Payments Ecosystem
- ii. How Payment Gateways Work
- iii. External Gateways vs Embedded Checkouts
- 2.3.2. Acquirers and PayFacs: Infrastructure, Enablement, and the Shift to Embedded Models
- i. What Acquirers Do, and Do Not Do
- ii. What is a PayFac?
- iii. The Evolution: PayFac-as-a-Service
- 2.3.3. Payments Orchestration Platforms: From Connector to Strategic Control Layer
- 2.3.1. Understanding the Payments Stack: Gateways, Acquirers, Processors, and PSPs
- 2.4. eCommerce Verticals
- 2.4.1. B2B eCommerce: The Hidden Role of Payments in Platform Transformation
- i. Consumerised Buying and Frictionless Checkout
- ii. Rep-free, Self-service Embedded Finance Journeys
- iii. Unified B2B/B2C Channels Enabled by Modular Payment Orchestration
- iv. Workflow Automation, Smart Settlement and Reconciliation
- v. Personalisation at Scale Powered by Adaptive Credit and Payment Models
- vi. Virtual Cards as a Strategic B2B Payment Rail
- 2.4.2. Customer-to-Customer (CC) Recommerce: Emerging Platform Trends Underpinned by Payments
- i. Platform-driven Identity and Reputation Systems
- ii. Gamification and Recirculation Incentives
- iii. Retailer-led Resale Channels
- iv. Onboarding the Informal Seller
- 2.4.3. Social Commerce: Emerging Platform Trends Underpinned by Payments
- i. Creator-led Commerce at Scale
- ii. Embedded Trust and Escrow Mechanics
- iii. Localised Compliance Meets Global Monetisation
- iv. Democratising Commerce Through Instant Onboarding
- 2.4.1. B2B eCommerce: The Hidden Role of Payments in Platform Transformation
- 2.5. Key Trends & Drivers
- 2.5.1. Local Acquiring As a Strategic Lever in Global Payments
- 2.5.2. Recurring Payments in the Subscription Economy: Reliability at Scale, Enabled by Infrastructure
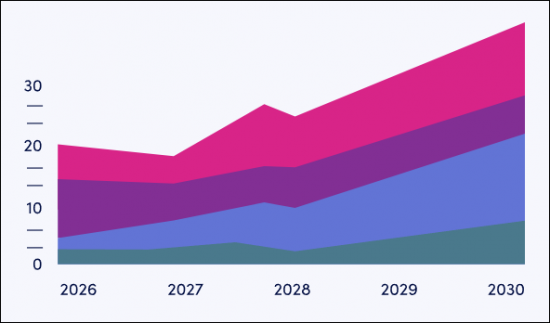
- Figure 2.3: Subscription Economy Transaction Value, 2020-2030 ($m), Global
- 2.5.3. Regulatory Changes
- i. Europe's Regulatory Push: PSD3, Real-time, Competitive, and Sovereign Payments
- ii. US: Digital Wallet Oversight and Open Banking Uncertainty
- iii. China: Strengthening Oversight and Consumer Protection
- 2.5.4. Growth Opportunities in eCommerce Payments in 2025
- i. Real-time Payments Move to the Forefront
- ii. AI-driven Optimisation at Checkout
- iii. Local Payment Methods as the Global Default
- iv. Embedded Finance in Platforms and Marketplaces
- v. Extending Fraud Protection to SMEs
- 2.5.5. Challenges for eCommerce Payments in 2025
- i. Fragmentation of Payment Methods and Localisation Complexity
- ii. Rising Fraud and Operational Risk
- iii. Checkout Friction and Abandonment
- iv. Cross-border Settlement and Compliance Barriers
- v. Interoperability and Return Payments: Hidden Friction in the Payment Lifecycle
3. Segment Analysis
- 3.1. Payment Methods Landscape
- 3.1.1. Overview
- Figure 3.1: Market Share of Payment Methods by Number of Remote Physical Goods Transactions (%), Globally, 2022, 2025 and 2030
- 3.1.2. Account-to-Account (A2A) Payments
- Figure 3.2: The Process of Making A2A Payments
- 3.1.3. Card Payments
- i. Credit Cards
- ii. Debit Cards
- iii. Prepaid Cards
- iv. Outlook for Card Payments in eCommerce
- 3.1.4. Digital Wallets
- Figure 3.3: Digital Wallet Funding Types
- i. Card-linked Wallets
- ii. Non-card-linked Wallets
- iii. Looking Ahead
- 3.1.5. Direct Carrier Billing (DCB)
- 3.1.6. Buy Now, Pay Later (BNPL)
- 3.1.7. Cash-based eCommerce Payments
- 3.1.8. Digital Assets and Token-based Payments: Cryptocurrency, Stablecoins & CBDCs
- i. Cryptocurrencies: Still Niche, but Useful in Select Verticals
- ii. Stablecoins: Gaining Momentum in Cross-border Commerce
- iii. Central Bank Digital Currencies (CBDCs): Still Experimental, but Promising
- iv. Outlook: Digital Assets in eCommerce Pragmatic, Not Ideological
- 3.1.1. Overview
- 3.2. eCommerce Market Segmentation
- 3.2.1. Large Multinational eCommerce Players
- 3.2.2. National eCommerce Brands
- 3.2.3. Small eCommerce Businesses
- 3.2.4. Vertical-specific eCommerce Payments
- i. Outlook: Payments As a Strategic Growth Lever
4. Country Readiness Index
- 4.1. Introduction to the Country Readiness Index
- Figure 4.1: Juniper Research Country Readiness Index Scoring Criteria: eCommerce Payments
- Figure 4.2: Juniper Research Country Readiness Index: eCommerce Payments
- Figure 4.3: Juniper Research Country Readiness Index: eCommerce Payments Market Segments
- 4.2. Index Analysis
- 4.2.1. Focus Markets: Driving the Global eCommerce Payments Landscape
Data & Forecasting
1. Market Overview Forecast
- 1.1. Introduction
- 1.2. Definitions
- 1.3. Methodology & Assumptions
- Figure 1.1: Forecast Methodology - Physical Goods
- Figure 1.2: Forecast Methodology - Digital Goods
- Figure 1.3: Forecast Methodology - Payment Type
2. Market Forecast Summary
- 2.1.1. Volume of eCommerce Transactions, Split by Region
- Figure & Table 2.1: Total eCommerce Transactions ($m), Split by 8 Key Regions, 2025-2030
- 2.1.2. Total eCommerce Transactions Value
- Figure & Table 2.2: Total eCommerce Transactions Value ($m), Split by 8 Key Regions, 2025-2030
- 2.1.3. Total eCommerce Transactions Value, by Payment Method
- Figure & Table 2.3: Total eCommerce Transactions Value ($m), Split by Payment Method, 2025-2030
- 2.1.4. Total mCommerce Transactions Value
- Figure & Table 2.4: Total mCommerce Transactions Value ($m), All Mobile Devices, Split by 8 Key Regions, 2025-2030
- 2.1.5. Total Gateway Revenue for eCommerce Transactions
- Figure & Table 2.5: Total eCommerce Gateway Revenue per annum ($m), Split by 8 Key Regions, 2025-2030
3. Market Forecast: Remote Payments for Physical Goods
- 3.1.1. Unique Purchasers of Remote Physical Goods
- Figure & Table 3.1: Unique Purchasers of Remote Physical Goods ($m), Split by Key Regions, 2025-2030
- 3.1.2. Total Transaction Volume for Remote Physical Goods
- Figure & Table 3.2: Total Transaction Volume for Remote Physical Goods per annum (m), Split by 8 Key Regions, 2025-2030
- 3.1.3. Total Transaction Value for Remote Physical Goods
- Figure & Table 3.3: Total Transaction Value for Remote Physical Goods ($m), Split by 8 Key Regions, 2025-2030
- 3.1.4. Gateway Revenue per annum ($m) from Online Physical Goods Sales
- Figure & Table 3.4: Gateway Revenue per annum ($m) from Online Physical Goods Sales, Split by 8 Key Regions, 2025-2030
- 3.1.5. Number of Remote Physical Goods Transactions, Split by Method
- Figure & Table 3.5: Number of Remote Physical Goods Transactions, Split by Market Share of Payment Methods (%), 2025-2030
- 3.1.6. Total Value of Remote Physical Goods Transactions, by Payment Type
- Figure & Table 3.6: Total Value of Remote Physical Goods Transactions ($m), Split by Payment Type, 2025-2030
4. Market Forecast: Remote Payments for Digital Goods
- 4.1.1. Unique Purchasers of Remote Digital Goods
- Figure & Table 4.1: Unique Purchasers of Remote Digital Payments (m), Split by 8 Key Regions, 2025-2030
- 4.1.2. Total Transaction Volume for Remote Digital Goods Sales
- Figure & Table 4.2: Total Transaction Volume for Remote Digital Goods (m), Split by 8 Key Regions, 2025-2030
- 4.1.3. Total Transaction Value for Remote Digital Goods Sales
- Figure & Table 4.3: Total Transaction Value for Remote Digital Goods Sales ($m), Split by 8 Key Regions, 2025-2030
- 4.1.4. Number of Remote Digital Good Transactions, by Payment Method
- Figure & Table 4.4: Number of Remote Digital Goods Transactions, Split by Market Share of Payment Method (%), 2025-2030
- 4.1.5. Gateway Revenue for Remote Digital Goods Sales
- Figure & Table 4.5: Gateway Revenue for Remote Digital Goods per annum ($m), Split by 8 Key Regions, 2025-2030

