
PUBLISHER: Juniper Research Ltd | PRODUCT CODE: 1733999

PUBLISHER: Juniper Research Ltd | PRODUCT CODE: 1733999
Cellular IoT Market: 2025-2030
'Cellular IoT: Latest GSMA eSIM Standard Critical to 6.5 billion Connections Globally by 2030'
| KEY STATISTICS | |
|---|---|
| Total number of cellular IoT connections in 2025: | 4.1bn |
| Total number of cellular IoT connections in 2030: | 6.5bn |
| Total cellular IoT connectivity revenue in 2030: | $31bn |
| Forecast period: | 2025-2030 |
Overview
Our "Cellular IoT" research suite provides operators, mobile virtual network operators (MVNOs), and connectivity service providers with extensive analysis and actionable insights into the evolving cellular IoT market. It contains data that enables stakeholders in the market to make informed decisions on their business strategies in the cellular IoT market; covering the development of key disruptive services in the cellular IoT market such as telecommunications Application Programming Interfaces (APIs), satellite or non-terrestrial networks (NTNs), quantum security, eSIMs and iSIMs, and private networks, as well as AI services in cellular IoT such as natural language interfaces, AI inferencing, and AI data analytics.
By reading this report, the audience will benefit from analysis and recommendations on business strategies for the monetisation of cellular IoT; looking at key network technologies such as 5G and Low-Power Wide-Area (LPWA), in addition to how operators and connectivity service providers can begin to expand their business models and offerings to position themselves as technology providers in the market. It also explores the development of business models such as connectivity-as-a-service, and how operators and connectivity service providers can benefit most from these models.
The report includes a Country Readiness Index, providing insight and analysis into which cellular IoT markets will experience the greatest growth over the next five years; allowing stakeholders to effectively understand the current and future status of more than 60 different cellular IoT markets.
The market forecast includes several different options that can be purchased separately, including access to data mapping and a forecast document, a strategy and trends document detailing critical trends in the market, and strategic recommendations for monetising and innovating services in the cellular IoT market.,
The research suite includes a Competitor Leaderboard, which can be purchased separately; containing analysis and market sizing for 15 leading cellular IoT vendors, who each provide platforms for managing cellular IoT connectivity.
Collectively, the suite provides a critical tool for understanding the cellular IoT market. Allowing operators, MVNOs, connectivity service providers, and other stakeholders in the market to optimise their future business strategies and product or service development; providing them with a competitive advantage over their rivals.
All report content is delivered in the English language.
Key Features
- Market Dynamics: Insight into key trends and opportunities in the cellular IoT market, such as the development of NTN connectivity, new AI services, and eSIMs. It also includes strategic analysis of how initiatives such as telecommunications APIs and the push for greater security within cellular IoT can be capitalised on by stakeholders in the market.
- Key Takeaways & Strategic Recommendations: In-depth analysis of key development opportunities and findings within the cellular IoT market, accompanied by strategic recommendations for operators, and other stakeholders in the market, seeking to increase their average revenue per connection or diversify their business models.
- Benchmark Industry Forecast: The suite provides five-year forecasts for the global cellular IoT market; providing data for the number of cellular IoT connections, connectivity revenue from cellular IoT, data generated by cellular IoT connections, number of cellular IoT modules shipped, total expenditure on cellular IoT modules, and total cellular IoT market value.
- Juniper Research Competitor Leaderboard: Key player capability and capacity assessment for 15 key vendors in the cellular IoT market, with market sizing and detailed analysis of each vendor's offering.
SAMPLE VIEW
Market Data & Forecasting Report
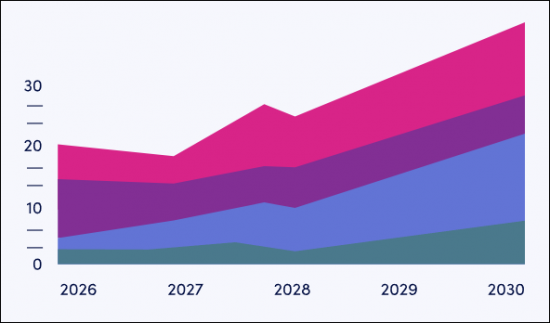
The numbers tell you what's happening, but our written report details why, alongside the methodologies.
SAMPLE VIEW
Market Trends & Strategies Report
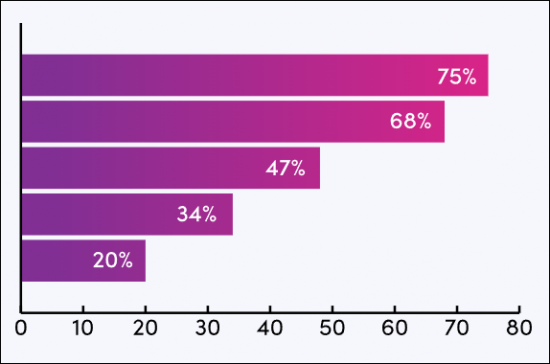
A comprehensive analysis of the current market landscape, alongside strategic recommendations.
Market Data & Forecasting Report
The market-leading research for the "Cellular IoT" market includes access to the full set of forecast data; comprising more than 106,000 datapoints and 170 tables.
Metrics in the research suite include:
- Number of Cellular IoT Connections
- Connectivity Revenue from Cellular IoT
- Data Generated by Cellular IoT
- Number of Cellular IoT Modules Shipped
- Expenditure on Cellular IoT Modules
- Total Cellular IoT Market Value
Splits are provided for each of these metrics for 2G and 3G, 4G, 5G, and LPWA, with LPWA split into Narrowband Internet of Things (NB-IoT), and Long Term Evolution for Machines (LTE-M), and 5G split into Other 5G and 5G RedCap.
Juniper Research's Interactive Forecast Excel contains the following functionality:
- Statistics Analysis: Users benefit from the ability to search for specific metrics, displayed for all regions and countries across the data period. Graphs are easily modified and can be exported to the clipboard.
- Country Data Tool: This tool enables users to look at metrics for all regions and countries in the forecast period. Users can refine the metrics displayed via a search bar.
- Country Comparison Tool: Users can select and compare specific countries. The ability to export graphs is included in this tool.
- What-if Analysis: Here, users can compare forecast metrics against their own assumptions, via three interactive scenarios.
Market Trends & Strategies Report
This report thoroughly examines the global "Cellular IoT" market; assessing market trends, technological developments, and monetisable opportunities which are shaping the market presently and in the future. Alongside this analysis, the document provides a comprehensive evaluation of business strategies in the cellular IoT market; exploring how operators, MVNOs, and connectivity service providers can introduce new monetisation models and technologies into the cellular IoT market.
Competitor Leaderboard Report
The Competitor Leaderboard included in this report provides detailed evaluation and market positioning for 15 cellular IoT vendors. These companies are positioned as established leaders, leading challengers, or disruptors and challengers, based on a capacity, capability, and product assessment. This includes analysis of their key advantages in the market, future development plans, and key partnerships.
The cellular IoT Competitor Leaderboard includes the following key vendors:
|
|
|
Table of Contents
Market Trends & Strategies
1. Key Takeaways & Strategic Recommendations
- 1.1. Key Takeaways
- 1.2. Key Strategic Recommendations
2. Market Landscape
- 2.1. Introduction
- Figure 2.1: Total Number of Cellular IoT Connections, Split by China and Rest of the World (m), 2025-2030
- 2.2. Disruptive Services in Cellular IoT
- 2.2.1. Telecommunications APIs
- Figure 2.2: Total Operator Revenue from Telecommunications API calls ($m), Split by 8 Key Regions, 2024-2029
- 2.2.2. NTNs and Satellite IoT
- Figure 2.3: Total Satellite Revenue from NTNs (m), Split by 8 Key Regions, 2025-2030
- 2.2.3. Private Networks
- Table 2.4: Total Expenditure on Private Cellular Networks ($m), Split by Market Vertical, 2025-2030
- 2.2.4. AI Services for Cellular IoT
- i. Natural Language Interfaces for CMPs
- ii. AI Data Analytics
- iii. AI Inferencing
- iv. AI-based Multi RAT Selection
- 2.2.5. eSIMs and iSIMs
- Figure 2.5: Total Number of eSIMs and iSIMs in Cellular IoT Connections (m), 2023-2028
- i.SGP.32
- Figure 2.6: SGP.32 Architecture
- ii. SGP.41/42
- Figure 2.7: SGP41/42 Architecture Diagram
- 2.2.6. Quantum Security for Cellular IoT
- 2.2.1. Telecommunications APIs
3. Future Strategies for Cellular IoT Business Models and Monetisation
- 3.1. Cellular IoT Business Models and Monetisation
- 3.1.1. Revenue Not Connections and Technology Not Connectivity
- 3.1.2. LPWA Services, Business Models, and Monetisation
- Table 3.1: NB-IoT and LTE-M
- Table 3.2: Total Number of LPWA Connections (m), Split by 8 Key Regions, 2025-2030
- Figure 3.3: Total Number of LPWA Connections (m), Split by NB-IoT and LTE-M, 2025-2030
- 3.1.3. 5G Business Models and Monetisation
- Table 3.4: Total Number of 5G IoT Connections (m), Split by 8 Key Regions, 2025-2030
- i. Differentiated Connectivity and Network Slicing
- Figure 3.5: Types of Network Slice
- 3.2. Connectivity-as-a-Service
4. Country Readiness Index
- 4.1. Introduction to The Country Readiness Index
- Figure 4.1: Juniper Research Cellular IoT Market Country Readiness Index: Regional Definitions
- Table 4.2: Juniper Research Cellular IoT Market Country Readiness Index: Scoring Criteria
- Figure 4.3: Juniper Research Cellular IoT Market Country Readiness Index
- 4.2. Focus Markets
- i. 5G Infrastructure
- Figure 4.4: Total Cellular IoT Connectivity Revenue ($m), Split by Network Technology, 2025-2030
- ii. eSIM and iSIM Adoption
- 4.2.2. China
- Figure 4.5: Total Number of Cellular IoT Connections in China (m), Split by Network Technology, 2025-2030
- 4.2.3. The US
- Figure 4.6: Total Revenue from Cellular IoT Connections in the US ($m), 2025-2030
- Figure 4.7: Total Number of LTE-M and NB-IoT Connections in the US (m), 2025-2030
- i. 5G Infrastructure
- 4.3. Growth Markets
- Figure 4.8: Cellular IoT Market High-growth Countries
- 4.3.1. Brazil
- Figure 4.9: Total Revenue from Cellular IoT Connectivity in Brazil ($m), Split by Network Technology, 2025-2030
- 4.3.2. India
- Figure 4.10: Total Number of Cellular IoT Connections in India (m), Split by Network Technology, 2025-2030
- 4.4. Saturated Markets
- 4.5. Developing Markets
- Table 4.11: Juniper Research's Cellular IoT Market Country Readiness Index Heatmap: North America
- Table 4.12: Juniper Research's Cellular IoT Market Country Readiness Index Heatmap: Latin America
- Table 4.13: Juniper Research's Cellular IoT Market Country Readiness Index Heatmap: West Europe
- Table 4.14: Juniper Research's Cellular IoT Market Country Readiness Index Heatmap: Central & East Europe
- Table 4.15: Juniper Research's Cellular IoT Market Country Readiness Index Heatmap: Far East & China
- Table 4.16: Juniper Research's Cellular IoT Market Country Readiness Index Heatmap: Indian Subcontinent
- Table 4.17: Juniper Research's Cellular IoT Market Country Readiness Index Heatmap: Rest of Asia Pacific
- Table 4.18: Juniper Research's Cellular IoT Market Country Readiness Index Heatmap: Africa & Middle East
Competitor Leaderboard
1. Competitor Leaderboard
- 1.1. Why Read This Report
- Figure 1.1: Juniper Research's Cellular IoT Market Competitor Leaderboard: Vendors and Product Portfolios (1 of 2)
- Figure 1.1: Juniper Research's Cellular IoT Market Competitor Leaderboard: Vendors and Product Portfolios (2 of 2)
- Figure 1.2: Juniper Research's Cellular IoT Market Competitor Leaderboard: 15 Vendors
- Table 1.3: Juniper Research's Cellular IoT Market Competitor Leaderboard: 15 Vendors
- Table 1.4: Juniper Research's Cellular IoT Market Competitor Leaderboard Heatmap: 15 Vendors
2. Vendor Profiles
- 2.1 Vendor Profiles
- 2.1.1. AT&T
- i. Corporate Information
- Table 2.1: AT&T's Financial Information ($m), 2023-2024
- ii. Geographical Spread
- iii. Key Clients & Strategic Partnerships
- iv. High-level View of Offerings
- Figure 2.2: AT&T Control Center Features
- v. Juniper Research's View: Key Strengths & Strategic Development Opportunities
- i. Corporate Information
- 2.1.2. China Mobile
- i. Corporate Information
- Figure 2.3: China Mobile's Key Financial Metrics, 2023-2024
- ii. Geographical Spread
- iii. Key Clients & Strategic Partnerships
- iv. High-level View of Offerings
- v. Juniper Research's View: Key Strengths & Strategic Development Opportunities
- i. Corporate Information
- 2.1.3. Cisco
- i. Corporate Information
- ii. Geographical Spread
- iii. Key Clients & Strategic Partnerships
- iv. High-level View of Offerings
- Figure 2.4: Cisco Service Provider Partners
- v. Juniper Research's View: Key Strengths & Strategic Development Opportunities
- 2.1.4. Deutsche Telekom
- i. Corporate Information
- Table 2.5: Deutsche Telekom's Key Financial Metrics ($ billion), 2023-2024
- ii. Geographical Spread
- iii. Key Clients & Strategic Partnerships
- iv. High-level View of Offerings
- Figure 2.6: Deutsche Telekom IoT Connectivity Coverage
- Figure 2.7: Deutsche Telekom Platform Integrations
- v. Juniper Research's View: Key Strengths & Strategic Development Opportunities
- i. Corporate Information
- 2.1.5. emnify
- i. Corporate Information
- ii. Geographical Spread
- ii.Key Clients & Strategic Partnerships
- iv. High-level View of Offerings
- Figure 2.8: emnify's 5G Coverage
- v. Juniper Research's View: Key Strengths & Strategic Development Opportunities
- 2.1.6. Eseye
- i. Corporate Information
- ii. Geographical Spread
- iii. Key Clients & Strategic Partnerships
- iv. High-level View of Offerings
- Figure 2.9: SIM Switching Eseye
- Figure 2.10: Eseye's AnyNet Federation and Direct Operator Interconnects
- v. Juniper Research's View: Key Strengths & Strategic Development Opportunities
- 2.1.7. Huawei
- i. Corporate Information
- ii. Geographical Spread
- iii. Key Clients & Strategic Partnerships
- iv. High-level View of Offerings
- Figure 2.11: Huawei's IoT Connection Management Platform
- Figure 2.12: Huawei's IoT Device Management
- v. Juniper Research's View: Key Strengths & Strategic Development Opportunities
- 2.1.8. KORE Wireless
- i. Corporate Information
- ii. Geographical Spread
- iii. Key Clients & Strategic Partnerships
- iv. High-level View of Offerings
- Figure 2.13: KORE One Platform
- v. Juniper Research's View: Key Strengths & Strategic Development Opportunities
- 2.1.9. Orange Business
- i. Corporate Information
- ii. Geographical Spread
- Figure 2.14: Orange's Operations Map
- iii. Key Clients & Strategic Partnerships
- iv. High-level View of Offerings
- v. Juniper Research's View: Key Strengths & Strategic Development Opportunities
- 2.1.10. Tata Communications
- i. Corporate Information
- ii. Geographical Spread
- iii. Key Clients & Strategic Partnerships
- iv. High-level View of Offerings
- v. Juniper Research's View: Key Strengths & Strategic Development Opportunities
- 2.1.11. Telefonica Tech
- i. Corporate Information
- ii. Geographical Spread
- iii. Key Clients & Strategic Partnerships
- iv. High-level View of Offerings
- v. Juniper Research's View: Key Strengths & Strategic Development Opportunities
- 2.1.12. Telit Cinterion
- i. Corporate Information
- ii. Geographical Spread
- iii. Key Clients & Strategic Partnerships
- Figure 2.15: Telit Cinterion NExT(TM) eSIM Provisioning Portal
- iv. Juniper Research's View: Key Strengths & Strategic Development Opportunities
- 2.1.13. Verizon Business
- i. Corporate Information
- Table 2.16: Verizon's Key Financial Metrics, 2023-2024
- ii. Geographical Spread
- iii. Key Clients & Strategic Partnerships
- iv. High-level View of Offerings
- v. Juniper Research's View: Key Strengths & Strategic Development Opportunities
- i. Corporate Information
- 2.1.14. Vodafone Business
- i. Corporate Information
- ii. Geographical Spread
- iii. Key Clients & Strategic Partnerships
- iv. High-level View of Offerings
- Figure 2.17: Vodafone Business's LPWA Services Availability
- v. Juniper Research's View: Key Strengths & Strategic Development Opportunities
- 2.1.15. Wireless Logic
- i. Corporate Information
- ii. Geographical Spread
- iii. Key Clients & Strategic Partnerships
- iv. High-level View of Offerings
- v. Juniper Research's View: Key Strengths & Strategic Development Opportunities
- 2.1.1. AT&T
- 2.2. Juniper Research Leaderboard Assessment Methodology
- 2.3. Limitations & Interpretations
- Table 2.18: Juniper Research's Cellular IoT Market Competitor Leaderboard: 15 Vendors
- 2.4. Related Research
Data & Forecasting
1. Introduction and Methodology
- 1.1. Introduction
- Figure 1.1: Total Number of Cellular IoT Connections (m), Split by Network Technology, 2025-2030
- 1.2. Forecast Methodology
- Figure 1.2: Juniper Research Cellular IoT Market: Methodology Model
2. Market Summary and Future Market Outlook
- 2.1. Total Number of Cellular IoT Connections
- Figure & Table 2.1: Total Number of Cellular IoT Connections (m), Split by 8 Key Regions, 2025-2030
- 2.2. Total Connectivity Revenue from Cellular IoT
- Figure & Table 2.2: Total Connectivity Revenue from Cellular IoT ($m), Split by Key Regions, 2025-2030
- 2.3. Total Data Generated by Cellular IoT
- Figure & Table 2.3: Total Data Generated by Cellular IoT (PB), Split by 8 Key Regions, 2025-2030
- 2.4. Total Cellular IoT Modules Shipped
- Figure & Table 2.4: Total Cellular IoT Modules Shipped (m), Split by 8 Key Regions, 2025-2030
- 2.5. Total Expenditure on Cellular IoT Modules
- Figure & Table 2.5: Total Expenditure on Cellular IoT Modules ($m), Split by 8 Key Regions, 2025-2030
3. 4G IoT
- 3.1. Total Number of 4G IoT Connections
- Figure & Table 3.1: Total Number of 4G IoT Connections (m), Split by 8 Key Regions, 2025-2030
- 3.2. Total Connectivity Revenue from 4G IoT
- Figure & Table 3.2: Total Connectivity Revenue from 4G IoT ($m), Split by 8 Key Regions, 2025-2030
- Table 3.3: Proportion of Cellular IoT Connections that Are 2G & 3G, and 4G (%), 2023-2030
- 3.3. Total Data Generated by 4G IoT
- Figure & Table 3.4: Total Data Generated by 4G IoT (PB), Split by 8 Key Regions, 2025-2030
- 3.4. Total Number of 4G IoT Modules Shipped
- Figure & Table 3.5: Total Number of 4G IoT Modules Shipped (m), Split by 8 Key Regions, 2025-2030
- 3.5. Total Expenditure on 4G IoT Modules
- Figure & Table 3.6: Total Expenditure on 4G IoT Modules ($m), Split by 8 Key Regions, 2025-2030
- Table 3.7: Average Cost of a 4G IoT Module ($), Split by 8 Key Regions, 2025-2030
4. 5G IoT
- 4.1. Total Number of 5G IoT Connections
- Figure & Table 4.1: Total Number of 5G IOT connections (m) Split by 8 Key Regions, 2025-2030
- Table 4.2: Total Number of 5G IoT Connections (m), Split by 5G RedCap and Other 5G, 2025-2030
- 4.2. Total Connectivity Revenue from 5G IoT
- Figure & Table 4.3: Total Connectivity Revenue from 5G IoT ($m), Split by 8 Key Regions, 2025-2030
- Table 4.4: Total Connectivity Revenue from 5G IoT ($m), Split by 5G RedCap and Other 5G, 2025-2030
- 4.3. Total Data Generated by 5G IoT
- Figure & Table 4.5: Total Data Generated by 5G IoT (PB), Split by 8 Key Regions, 2025-2030
- Table 4.6: Total Data Generated by 5G IoT (PB), Split by 5G RedCap and Other 5G, 2025-2030
- 4.4. Total Number of 5G IoT Modules Shipped
- Figure & Table 4.7: Total Number of 5G IoT Modules Shipped (m), Split by 8 Key Regions, 2025-2030
- Table 4.8: Total Number of 5G IoT Modules Shipped (m), Split by RedCap and Other 5G, 2025-2030
- 4.5. Total Expenditure on 5G IoT Modules
- Figure & Table 4.9: Total Expenditure on 5G IoT Modules ($m), Split by 8 Key Regions, 2025-2030
- Table 4.10: Total Expenditure on 5G IoT Modules ($m), Split by RedCap and Other 5G, 2025-2030
5. LPWA
- 5.1. Total Number of LPWA Connections
- Figure & Table 5.1: Total Number of LPWA Connections (m), Split by 8 Key Regions, 2025-2030
- Figure 5.2: Total Number of LPWA Connections (m), Split by NB-IoT and LTE-M, 2025-2030
- 5.2. Total Connectivity Revenue from LPWA Connections
- Figure & Table 5.3: Total Connectivity Revenue from LPWA Connections ($m), Split by 8 Key Regions, 2025-2030
- Figure 5.4: Total Connectivity Revenue from LPWA Connections ($m), Split by NB-IoT and LTE-M, 2025-2030
- 5.3. Total Data Generated by LPWA Connections
- Figure & Table 5.5: Total Data Generated by LPWA Connections (PB), Split by 8 Key Regions, 2025-2030
- Table 5.6: Total Data Generated by LPWA Connections (PB), Split by NB-IoT and LTE-M, 2025-2030
- 5.4. Total Number of LPWA Modules Shipped
- Figure & Table 5.7: Total Number of LPWA Modules Shipped (m), Split by 8 Key Regions 2025-2030
- Table 5.8: Total Number of LPWA Modules Shipped (m), Split by NB-IoT and LTE-M, 2025-2030
- 5.5. Total Expenditure on LPWA Modules
- Figure & Table 5.9: Total Expenditure on LPWA Modules ($m), Split by 8 Key Regions, 2025-2030
- Table 5.10: Total Expenditure on LPWA Modules ($m), Split by NB-IoT and LTE-

