
PUBLISHER: Juniper Research Ltd | PRODUCT CODE: 1816817

PUBLISHER: Juniper Research Ltd | PRODUCT CODE: 1816817
Anti-Money Laundering Systems Market: 2025-2030
'AML Systems Market to Surpass $75 Billion by 2030 Globally, With LexisNexis Risk Solutions, Oracle, and Experian Leading the Defence'
| KEY STATISTICS | |
|---|---|
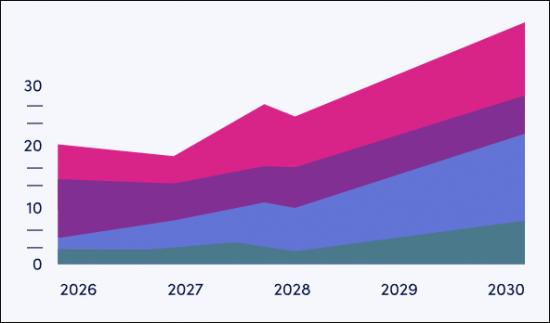
| Total spend on AML systems in 2025: | $33.9bn |
| Total spend on AML systems by 2030: | $75.2bn |
| 2025 to 2030 market growth: | 121% |
| Forecast period: | 2025-2030 |
Overview
Our "Anti-money Laundering (AML) Systems" research suite provides a detailed and insightful analysis of this evolving market; enabling stakeholders from financial institutions, law enforcement agencies, regulatory bodies and technology vendors to understand future growth, key trends, and the competitive environment.
The suite includes several different options that can be purchased separately, including access to data mapping adoption and future growth of the AML systems market. The research is an insightful study uncovering the latest trends and opportunities within the market and providing extensive analysis of the 18 market leaders in the fight against money laundering and terrorist financing. The coverage can also be purchased as a Full Research Suite, containing all of these elements, and including a substantial discount.
Collectively, these documents provide a critical tool for understanding this rapidly emerging market; enabling banks and technology vendors to shape their future strategy. Its unparalleled coverage makes this research suite an incredibly useful resource for charting the future of such an uncertain and rapidly growing market.
All report content is delivered in the English language.
Key Features
- Market Dynamics: Insights into key trends and market expansion challenges within the AML systems market. The research includes a Country Readiness Index, providing analysis on where the best opportunities lie for AML system adoption across 60 plus countries. It also includes analysis of current developments across 10 different segments of the AML systems market and an assessment of AML regulations across key regions. The report addresses challenges posed by increasingly complex financial crimes, the potential benefits of increasing regulatory involvement, and an assessment of the many next-generation technological approaches to detect money laundering and suspicious activity.
- Key Takeaways & Strategic Recommendations: In-depth analysis of key development opportunities and findings within the AML systems market, accompanied by key strategic recommendations for stakeholders.
- Benchmark Industry Forecasts: Global AML adoption assessed across 10 key industries, including five financial services and five non-financial industry segments. It also provides forecasts for total AML system spend, split by these 10 industry verticals.
- Juniper Research Competitor Leaderboard: Key player capability and capacity assessment for 18 AML system vendors, via the Juniper Research Competitor Leaderboard.
SAMPLE VIEW
Market Data & Forecasting Report
The numbers tell you what's happening, but our written report details why, alongside the methodologies.
SAMPLE VIEW
Market Trends & Strategies Report
A comprehensive analysis of the current market landscape, alongside strategic recommendations.
Market Data & Forecasting Report
The market-leading research suite for the "AML Systems" market includes access to the full set of forecast data of 86 tables and over 39,200 datapoints.
Metrics in the research suite include:
- Total Number of Companies Using Third-party AML Systems
- Total Spend on AML Systems
These metrics are provided for the following key market verticals:
Financial Industries
- Banking
- Fintech
- Insurance
- Investment
- Lending
Non-financial Industries
- Gaming & Gambling
- Public Sector
- Non-profit
- Real Estate
- Legal
Juniper Research's Interactive Forecast Excel contains the following functionality:
- Statistics Analysis: Users benefit from the ability to search for specific metrics, displayed for all regions and countries across the data period. Graphs are easily modified and can be exported to the clipboard.
- Country Data Tool: This tool lets users look at metrics for all regions and countries in the forecast period. Users can refine the metrics displayed via a search bar.
- Country Comparison Tool: Users can select and compare each of the countries. The ability to export graphs is included in this tool.
- What-if Analysis: Here, users can compare forecast metrics against their own assumptions, via five interactive scenarios
Market Trends & Strategies Report
This report examines the "AML Systems" market landscape in detail; assessing market trends and factors shaping the evolution of this rapidly growing market. The report delivers comprehensive analysis of the strategic opportunities for AML system providers; addressing key verticals' developing challenges in online financial crimes and illicit activities, and revision of anti-money laundering laws across key regions.
It offers an assessment of the next generation of technological approaches for detecting suspicious transactions and how stakeholders should navigate these. It also includes evaluation of key country-level opportunities for AML system growth, via the Country Readiness Index.
Competitor Leaderboard Report
The Competitor Leaderboard report provides a detailed evaluation and market positioning for 18 leading vendors in the "AML Systems" space. The vendors are positioned as established leaders, leading challengers, or disruptors and challengers, based on capacity and capability assessments.
Juniper Research's "Competitor Leaderboard for AML systems" includes the following key players:
|
|
|
This document is centred around the Juniper Research Competitor Leaderboard; a vendor positioning tool that provides an at-a-glance view of the competitive landscape in a market, backed by a robust methodology.
Table of Contents
Market Trends & Strategies
1. Key Takeaways & Strategic Recommendations
- 1.1. Key Takeaways
- 1.2. Strategic Recommendations
2. Market Landscape
- 2.1. Introduction
- 2.1.1. The History of Anti-Money Laundering
- 2.1.2. The Current Landscape
- i. AML
- Figure 2.1: Global Spend on Third-party AML Systems ($m), Split by 8 Key Regions, 2025-2030
- Figure 2.2: Anti-Money Laundering Systems Market Landscape
- Figure 2.3: Factors Determining a Customer's Potential Risk Level
- ii. KYC
- Figure 2.4: AML Umbrella
- iii. KYB
- Figure 2.5: Know Your Business Requirements
- i. AML
- 2.1.3. Transaction Screening
- 2.1.4. The Current Regulatory Framework
- Figure 2.6: Dynamic AML Regulations Across Juniper Research's 8 Key Regions
- i. National Strategy for Combatting Illicit Financing and the Responsible Financial Innovation Act (US)
- ii. Responsible Financial Innovation Act (US)
- iii. Responsible Development of Digital Assets Executive Order (US)
- iv. Corporate Transparency Act (US)
- v. US Treasury's National Strategy for Combatting Terrorist and Other Illicit Financing - (US)
- vi. Anti-Money Laundering Act 2020 (US)
- vii. 6th Anti-Money Laundering Directive (EU)
- Figure 2.7: 6AMLD 22 Predicate Offences
- viii. 5th Anti-Money Laundering Directive (EU)
- ix. Markets in Crypto Assets (EU)
- x. Transfer of Funds Regulation (EU)
- xi. EU Anti-Money Laundering Authority (AMLA)
- xii. AML Regulations (EU) 2024/1624
- xiii. Law No. 6415 (Turkey)
- xiv. Three-year Action Plan (China)
- xv. The Prevention of Money Laundering 2002 (India)
- xvi. MAS Notice 626 (Singapore)
- xvii. Guidance Rules for Digital Assets (UAE)
- 2.2. Drivers
- 2.2.1. Rising Levels of Online Crime and Money Muling
- Figure 2.8: Organised Crime Groups and Mule Networks Cycle
- 2.2.2. Regulatory Expansion and Harmonisation
- 2.2.3. Technological Integration
- 2.2.4. Costs to Businesses
- Figure 2.9: Major AML Fines in the 21st Century - Banks & Other FIs
- 2.2.1. Rising Levels of Online Crime and Money Muling
- 2.3. Challenges with Adopting AML Systems
- 2.3.1. Rigid Processes
- Figure 2.10: Financial Institutions' Challenges
- 2.3.2. High Expectations of Regulators and Customers
- 2.3.3. Lack of In-house Expertise and Increasing Costs
- 2.3.1. Rigid Processes
3. Applying Criminal Behaviour to AML Technology
- 3.1. Money Laundering Definitions and Controls
- Figure 3.1: Anti-Money Laundering Controls
- 3.1.1. Money Laundering and Terrorist Funding Typologies
- Figure 3.2: Illicit Industries' Median Market Value ($m)
- Figure 3.3: Common Money Laundering and Terrorist Financing Typologies
- i. Smurfing
- ii. Money Muling
- iii. Shell Corporations
- iv. Trade-based Money Laundering
- v. Diversion of funds from NGOs
- vi. Cash-intensive Businesses
- vii. Round-tipping
- viii. Abuse of Insurance
- ix. Understanding Money Laundering Typologies
- 3.1.2. Money Laundering in the Digital Age
- Figure 3.4: Emerging Digital Money Laundering Trends
- i. Cryptocurrencies
- ii. Online Gaming and Gambling
- iii. Proxy Servers and Anonymising Software
- iv. Romance Fraud
- v. Job Scamming
- vi. Dark Web and Encryption
- vii. Deepfake & AI-powered Financial Scams
- viii. Evolving Digital Techniques
- 3.2. Technological Infrastructure
- 3.2.1. Artificial Intelligence and Analytics
- i. Generative AI
- Figure 3.5: Generative AI AML Capabilities
- ii. Behavioural Analytics
- iii. Natural Language Processing
- iv. Extract, Transform, Load
- v. Predictive Analytics
- i. Generative AI
- 3.2.2. DLT and Blockchain
- Figure 3.6: Blockchain Use Cases for AML & KYC
- 3.2.3. Biometrics
- Figure 3.7: Smartphone Biometrics
- 3.2.4. Cloud Computing
- 3.2.1. Artificial Intelligence and Analytics
- 3.3. Assessment of AI
- Figure 3.8: Americans' Attitudes Towards AI Use
- Figure 3.9: Bias in AI
- 3.3.1. Conclusions
4. Segment Analysis: Industry Applications for AML Systems
- 4.1. Industry Applications for AML Systems
- Figure 4.1: AML Systems' 10 High-potential Industry Segments
- 4.1.1. Banking
- i. Opportunities
- ii. Challenges
- 4.1.2. Fintech
- i. Opportunities
- ii. Challenges
- 4.1.3. Gaming & Gambling
- i. Opportunities
- ii. Challenges
- 4.1.4. Insurance
- i. Opportunities
- ii. Challenges
- 4.1.5. Investment
- i. Opportunities
- ii. Challenges
- 4.1.6. Lending
- i. Opportunities
- ii. Challenges
- 4.1.7. Public Sector
- i. Opportunities
- ii. Challenges
- 4.1.8. Non-profit
- i. Opportunities
- ii. Challenges
- 4.1.9. Real Estate
- i. Opportunities
- ii. Challenges
- 4.1.10. Legal
- i. Opportunities
- ii. Challenges
5. Country Readiness Index
- 5.1. Introduction
- Figure 5.1: Juniper Research Country Readiness Index Regional Definitions
- Table 5.2: Juniper Research Country Readiness Index Scoring Criteria: AML Systems
- Figure 5.3: Juniper Research Country Readiness Index: AML Systems
- Table 5.4: AML Systems Country Readiness Index: Market Segments
- 5.2. Focus Markets
- 5.2.1. Transition From Legacy systems to New Modern AML Systems
- 5.2.2. AML Systems as Part of Broader Goals
- 5.3. Growth Markets
- 5.3.1. Country-level Assessment: The UK
- 5.4. Saturated Markets
- 5.5. Developing Markets
- 5.5.1. Country-level Assessment: US
- Table 5.5: Juniper Research Country Readiness Index Heatmap: North America
- Table 5.6: Juniper Research Country Readiness Index Heatmap: Latin America
- Table 5.7: Juniper Research Country Readiness Index Heatmap: West Europe
- Table 5.8: Juniper Research Country Readiness Index Heatmap: Far East & China
- Table 5.9: Juniper Research Country Readiness Index Heatmap: Far East & China
- Table 5.10: Juniper Research Country Readiness Index Heatmap: Indian Subcontinent
- Table 5.11: Juniper Research Country Readiness Index Heatmap: Rest of Asia Pacific
- Figure 5.12: Juniper Research Country Readiness Index Heatmap: Africa & Middle East
- 5.5.1. Country-level Assessment: US
Competitor Leaderboard
1. AML Systems - Competitor Leaderboard
- 1.1.1. Why Read This Report
- Key AML Systems Market Takeaways
- Stakeholders Embrace Generative AI to Drive Innovation
- Vendors Should Foster Collaboration With Data Providers
- Table 1.1: Juniper Research Competitor Leaderboard AML System Vendors Included & Product Portfolio
- Figure 1.2: Juniper Research Competitor Leaderboard for AML System Vendors
- Table 1.3: Juniper Research Competitor Leaderboard Vendors and Positioning
- Table 1.4: Juniper Research Competitor Leaderboard Heatmap for AML System Vendors (1 of 2)
- Table 1.4: Juniper Research Competitor Leaderboard Heatmap for AML System Vendors (2 of 2)
- 1.2. AML Systems Vendor Profiles
- 1.2.1. ComplyAdvantage
- i. Corporate
- Table 1.5: ComplyAdvantage's Investment Rounds ($m), 2016-2021
- ii. Geographical Spread
- iii. Key Clients & Strategic Partnerships
- iv. High-level View of Offerings
- v. Juniper Research's View: Key Strengths & Strategic Development Opportunities
- i. Corporate
- 1.2.2. Experian
- i. Corporate
- Table 1.6: Experian's Financial Snapshot ($m), 2022-2025
- ii. Geographical Spread
- iii. Key Clients & Strategic Partnerships
- iv. High-level View of Offerings
- v. Juniper Research's View: Key Strengths & Strategic Development Opportunities
- i. Corporate
- 1.2.3. Featurespace
- i. Corporate
- Table 1.7: Featurespace's Investment Rounds (USD $m), 2012-2020
- ii. Geographical Spread
- iii. Key Clients & Strategic Partnerships
- iv. High-level View of Offerings
- v. Juniper Research's View: Key Strengths & Strategic Development Opportunities
- i. Corporate
- 1.2.4. Feedzai
- i. Corporate
- Table 1.8: Feedzai's Investment Rounds ($m), 2011-2021
- ii. Geographical Spread
- iii. Key Clients & Strategic Partnerships
- iv. High-level View of Offerings
- v. Juniper Research's View: Key Strengths & Strategic Development Opportunities
- i. Corporate
- 1.2.5. Fiserv
- i. Corporate
- Table 1.9: Fiserv's Financial Snapshot ($m), 2022-2024
- ii. Geographical Spread
- iii. Key Clients & Strategic Partnerships
- iv. High-level View of Offerings
- v. Juniper Research's View: Key Strengths & Strategic Development Opportunities
- i. Corporate
- 1.2.6. HAWK AI
- i. Corporate
- Table 1.10: HAWK AI's Investment Rounds ($m) 2021-2025
- ii. Geographical Spread
- iii. Key Clients & Strategic Partnerships
- iv. High-level View of Offerings
- v. Juniper Research's View: Key Strengths & Strategic Development Opportunities
- i. Corporate
- 1.2.7. LexisNexis-R Risk Solutions
- i. Corporate
- Table 1.11: RELX's Financial Snapshot ($m), 2021-2024
- Table 1.12: Risk's Financial Snapshot ($m), 2022-2024
- ii. Geographical Spread
- iii. Key Clients & Strategic Partnerships
- iv. High-level View of Offerings
- v. Juniper Research's View: Key Strengths & Strategic Development Opportunities
- i. Corporate
- 1.2.8. Lucinity
- i. Corporate
- Table 1.13: Lucinity's Investment Rounds ($m), 2019-2022
- ii. Geographical Spread
- iii. Key Clients & Strategic Partnerships
- iv. High-level View of Offerings
- v. Juniper Research's View: Key Strengths & Strategic Development Opportunities
- i. Corporate
- 1.2.9. Napier AI
- i. Corporate
- Table 1.14: Napier's Investment Rounds ($m), 2023-2025
- ii. Geographical Spread
- iii. Key Clients & Strategic Partnerships
- iv. High-level View of Offerings
- Figure 1.15: Lifecycle of Napier AI's Continuum Platform
- v. Juniper Research's View: Key Strengths & Strategic Development Opportunities
- i. Corporate
- 1.2.10. NICE Actimize
- i. Corporate
- Table 1.16: NICE's Financial Performance ($m), 2022-2024
- ii. Geographical Spread
- iii. Key Clients & Strategic Partnerships
- iv. High-level View of Offerings
- Figure 1.17: NICE Actimize X-Sight Entity Risk Platform
- v. Juniper Research's View: Key Strengths & Strategic Development Opportunities
- i. Corporate
- 1.2.11. Oracle Financial Services
- i. Corporate
- Table 1.18: Oracle's Financial Snapshot Fiscal Year Ending May 31 ($m), 2022-2025
- Table 1.19: Oracle's Acquisition History from 2021 to Present
- ii. Geographical Spread
- iii. Key Clients & Strategic Partnerships
- iv. High-level View of Offerings
- v. Juniper Research's View: Key Strengths & Strategic Development Opportunities
- i. Corporate
- 1.2.12. Quantifind
- i. Corporate
- Table 1.20: Quantifind's Investment Rounds ($m), 2011-2025
- ii. Geographical Spread
- iii. Key Clients & Strategic Partnerships
- iv. High-level View of Offerings
- Figure 1.21: Quantifind Solution Ecosystem
- v. Juniper Research's View: Key Strengths & Strategic Development Opportunities
- i. Corporate
- 1.2.13. Salv
- i. Corporate
- Table 1.22: Salv's Investment Rounds ($m) 2019-2023
- ii. Geographical Spread
- iii. Key Clients & Strategic Partnerships
- iv. High-level View of Offerings
- Figure 1.23: Salv's Core Infrastructure
- v. Juniper Research's View: Key Strengths & Strategic Development Opportunities
- i. Corporate
- 1.2.14. SAS Institute
- i. Corporate
- Table 1.24: SAS Institute's Acquisition History From 2011-Present
- ii. Geographical Spread
- iii. Key Clients & Strategic Partnerships
- iv. High-level View of Offerings
- v. Juniper Research's View: Key Strengths & Strategic Development Opportunities
- i. Corporate
- 1.2.15. Silent Eight
- i. Corporate
- Table 1.25: Silent Eight's Investment Rounds ($m), 2014-2022
- ii. Geographical Spread
- iii. Key Clients & Strategic Partnerships
- iv. High-level View of Offerings
- v. Juniper Research's View: Key Strengths & Strategic Development Opportunities
- i. Corporate
- 1.2.16. SymphonyAI Sensa
- i. Corporate
- Table 1.26: Sensa's Investment Rounds, 2012-2015
- ii. Geographical Spread
- iii. Key Clients & Strategic Partnerships
- iv. High-level View of Offerings
- Figure 1.27: Sensa Copilot Suspicious Activity Workflow
- v. Juniper Research's View: Key Strengths & Strategic Development Opportunities
- i. Corporate
- 1.2.17. SEON
- i. Corporate
- Table 1.28: SEON's Investment Rounds, 2018-2022
- ii. Geographical Spread
- iii. Key Clients & Strategic Partnerships
- iv. High-level View of Offerings
- v. Juniper Research's View: Key Strengths & Strategic Development Opportunities
- i. Corporate
- 1.2.18. Unit21
- i. Corporate
- Table 1.29: UNIT21's Investment Rounds, 2012-2015
- ii. Geographical Spread
- iii. Key Clients & Strategic Partnerships
- iv. High-level View of Offerings
- v. Juniper Research's View: Key Strengths & Strategic Development Opportunities
- i. Corporate
- 1.2.1. ComplyAdvantage
- 1.3. Juniper Research Competitor Leaderboard Assessment Methodology
- 1.4. Limitations & Interpretation
- Table 1.30: Juniper Research Competitor Leaderboard Scoring Criteria: AML Systems
- 1.5. Related Research
- 1.6. Endnotes
Data & Forecasting
1. Market Forecast
- 1.1. Introduction
- 1.1.1. Methodology & Assumptions
- Figure 1.1: AML Systems Forecast Methodology for Financial Businesses (Banks, Fintechs, Insurance, Investment, and Lending)
- Figure 1.2: AML Systems Forecast Methodology for Professional and Other Businesses (Gaming & Gambling, Public Sector, Non-profit, Real Estate, and Legal)
- 1.1.1. Methodology & Assumptions
2. Global AML Systems Forecast
- 2.1. Number of Businesses Using Third-party AML Systems
- Figure & Table 2.1: The Total Number of Businesses Using Third-party AML Systems per annum, Split by 8 Key Regions, 2025-2030
- 2.1.1. Total Spend on Third-party AML Systems
- Figure & Table 2.2: Total Spend on Third-party AML Systems per annum ($m) Split by 8 Key Regions, 2025-2030
3. AML Systems Forecast for Financial Businesses
- 3.1. Total Number of Financial Businesses using third party AML systems
- Figure & Table 3.1: Total Number of Financial Businesses Using Third-party AML Systems, Split by 8 Key Regions, 2025-2030
- Table 3.2: Total Number of Financial Businesses Using Third-party AML Systems per annum, Split by Industry, 2025-2030
- 3.1.1. Total Spend on Third-party AML Systems by Financial Businesses
- Figure & Table 3.3: Total Spend on Third-party AML Systems by Financial Businesses per annum ($m), Split by 8 Key Regions, 2025-2030
- Table 3.4: Total Spend on Third-party AML Systems by Financial Businesses per annum ($m), Split by Industry, 2025-2030
- 3.1.2. Total Number of Banks Using Third-party AML Systems
- Figure & Table 3.5: The Total Number of Banks Using Third-party AML Systems per annum, Split by 8 Key Regions, 2025-2030
- 3.1.3. Total Spend on Third-party AML Systems in the Banking Industry
- Figure & Table 3.6: Total Spend on Third-party AML Systems in the Banking Industry per annum ($m), Split by 8 Key Regions, 2025-2030
- 3.1.4. Total Number of Fintechs Using Third-party AML Systems
- Figure & Table 3.7: The Total Number of Fintechs Using Third-party AML Systems per annum, Split by 8 Key Regions, 2025-2030
- 3.1.5. Total Spend on Third-party AML Systems in the Fintech Industry
- Figure & Table 3.8: Total Spend on Third-party AML Systems in the Fintech Industry per annum ($m), Split by 8 Key Regions, 2025-2030
- 3.1.6. Total Number of Insurance Companies Using Third-party AML Systems
- Figure & Table 3.9: The Total Number of Insurance Companies Using Third-party AML Systems per annum, Split by 8 Key Regions, 2025-2030
- 3.1.7. Total Spend on Third-party AML Systems in the Insurance Industry
- Figure & Table 3.10: Total Spend on Third-party AML Systems in the Insurance Industry per annum, Split by 8 Key Regions, 2025-2030
- 3.1.8. Total Number of Investment Companies Using Third-party AML Systems
- Figure & Table 3.11: The Total Number of Investment Companies Using Thirdparty AML Systems per annum, Split by 8 Key Regions, 2025-20230
- 3.1.9. Total Spend on Third-party AML Systems in the Investment Industry
- Figure & Table 3.12: Total Spend on Third-party AML Systems in the Investment Industry per annum, Split by 8 Key Regions, 2025-2030
- 3.1.10. Total Number of Lending Companies Using Third-party AML Systems
- Figure & Table 3.13: The Total Number of Lending Companies Using Third-party AML Systems per annum, Split by 8 Key Regions, 2025-2030
- 3.1.11. Total Spend on Third-party AML Systems in the Lending Industry
- Figure & Table 3.14: Total Spend on Third-party AML Systems in the Lending Industry per annum ($m), Split by 8 Key Regions, 2025-2030
4. AML Systems Forecast for Professional Services and Other Businesses
- 4.1. Total Number of Professional and Other Businesses Using Third-party AML systems
- Figure & Table 4.1: Total Number of Professional and Other Businesses Using Third-party AML Systems, Split by 8 Key Regions, 2025-2030
- Figure 4.2: Total Number of Professional and Other Businesses Using Thirdparty AML Systems, Split by Segment, 2025-2030
- 4.1.1. Total Spend on Third-party AML Systems by Professional and Other Businesses
- Figure & Table 4.3: Total Spend on Third-party AML Systems by Professional and Other Businesses ($m), Split by 8 Key Regions, 2025-2030
- Figure 4.4: Total Spend on Third-party AML Systems by Professional and Other Businesses ($m), Split by Segment, 2025-2030
- 4.1.2. Total Number of Gaming & Gambling Companies Using Third-party AML Systems
- Figure & Table 4.5: The Total Number of Gaming & Gambling Companies Using Third-party AML Systems per annum, Split by 8 Key Regions, 2025-2030
- 4.1.3. Total Spend on Third-party AML Systems in the Gaming & Gambling Industry
- Figure & Table 4.6: Total Spend on Third-party AML Systems in the Gaming & Gambling Industry per annum ($m), Split by 8 Key Regions, 2025-2030
- 4.1.4. Total Number of Public Sector Companies Using Third-party AML Systems
- Figure 4.7: The Total Number of Public Sector Companies Using Third-party AML Systems per annum, Split by 8 Key Regions, 2025-2030
- 4.1.5. Total Spend on Third-party AML Systems in the Public Sector
- Figure & Table 4.8: Total Spend on Third-party AML Systems in the Public Sector per annum ($m), Split by 8 Key Regions, 2025-2030
- 4.1.6. Total Number of Non-profit Companies Using Third-party AML Systems
- Figure & Table 4.9: The Total Number of Non-profit Companies Using Thirdparty AML Systems per annum, Split by 8 Key Regions, 2025-2030
- 4.1.7. Total Spend on Third-party AML Systems in the Non-profit Sector
- Figure & Table 4.10: Total Spend on Third-party AML Systems in the Non-profit Sector per annum ($m), Split by 8 Key Regions, 2025-2030
- 4.1.8. Total Number of Real Estate Agencies Using Third-party AML Systems
- Figure & Table 4.11: The Total Number of Real Estate Agencies Using Third-party AML Systems per annum, Split by 8 Key Regions, 2025-2030
- 4.1.9. Total Spend on Third-party AML Systems in the Real Estate Sector
- Figure & Table 4.12: Total Spend on Third-party AML Systems in the Real Estate Sector per annum ($m), Split by 8 Key Regions, 2025-2030
- 4.1.10. Total Number of Law Firms Using Third-party AML Systems
- Figure & Table 4.13: The Total Number of Law Firms Using Third-party AML Systems per annum, Split by 8 Key Regions, 2025-2030
- 4.1.11. Total Spend on Third-party AML Systems in the Legal Sector
- Figure & Table 4.14: Total Spend on Third-party AML Systems in the Legal Sector per annum ($m), Split by 8 Key Regions, 2025-2030

