
PUBLISHER: Juniper Research Ltd | PRODUCT CODE: 1808070

PUBLISHER: Juniper Research Ltd | PRODUCT CODE: 1808070
Smart Grid Market: 2025-2030
'Smart Grids to Support 43% of Global Electricity Supply by 2030, Driven by Virtual Power Plants'
| KEY STATISTICS | |
|---|---|
| Global smart grid coverage in 2025: | 24.2% |
| Global smart grid coverage by 2030: | 42.7% |
| Smart meter shipments globally by 2030: | 2.6bn |
| Forecast period: | 2025-2030 |
Overview
Our cutting-edge "Smart Grid" research suite provides a comprehensive view of a market at the forefront of the global energy transition. It examines the major disruptions transforming the sector, from the integration of distributed energy resources and the rise of virtual power plants to the growing role of AI-driven intelligence and the mounting need for robust cyber security and compliance. It also highlights how emerging markets are driving the next wave of smart metering growth; leapfrogging legacy infrastructure to accelerate grid modernisation.
The suite combines detailed analysis of trends and challenges with clear recommendations and opportunity appraisals throughout; ensuring vendors can translate industry shifts into actionable strategies. It is supported by robust datasets covering grid deployment, associated revenue, energy cost savings, and avoided emissions; giving stakeholders the insights they need to quantify smart grids' market potential and socioeconomic impact.
Alongside this, the Competitor Leaderboard offers an independent evaluation of 15 leading smart grid vendors; highlighting the capabilities that set market leaders apart and the strategies challengers must adopt to compete.
Available as individual components, or as a complete package at a discounted rate, our smart grid research suite equips stakeholders with the intelligence required to succeed in a market that is being reshaped by decentralisation, prosumer participation, and intelligent grid management.
All report content is delivered in the English language.
Key Features
- Country Readiness Index: Benchmarks for 60+ markets worldwide; assessing smart grids' maturity and investment potential. This enables vendors and utilities to identify markets primed for immediate opportunity versus long-term development. By mapping deployment levels against regulatory environments, policy support, and infrastructure readiness, this Index offers a clear roadmap for prioritising market entry and investment strategies.
- Market Trends & Opportunities: In-depth appraisal of the technological, regulatory, and commercial forces reshaping the smart grid. It explores the impact of distributed energy resources, virtual power plants, and AI-driven intelligence, alongside evolving consumer and prosumer behaviour. These insights are tied directly to strategic recommendations; helping vendors and utilities turn trends into opportunities while mitigating risks and adoption barriers.
- Comprehensive Industry Forecasts: 5-year market sizing and forecasts covering deployment, revenue, energy cost savings, and emissions reductions. Includes detailed splits by smart meter connectivity technologies (4G, 5G, LTE-M, NB-IoT), and associated revenue; giving vendors clear insight into shifting demand, future roll-outs, and how to align product roadmaps with market opportunity.
- Juniper Research Competitor Leaderboard: Independent evaluation of 15 leading smart grid vendors; assessing their strengths, innovations, and overall market impact to identify the sector's leaders and challengers.
SAMPLE VIEW
Market Data & Forecasting Report
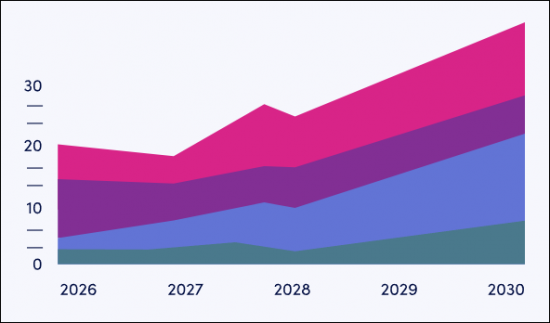
The numbers tell you what's happening, but our written report details why, alongside the methodologies.
SAMPLE VIEW
Market Trends & Strategies Report
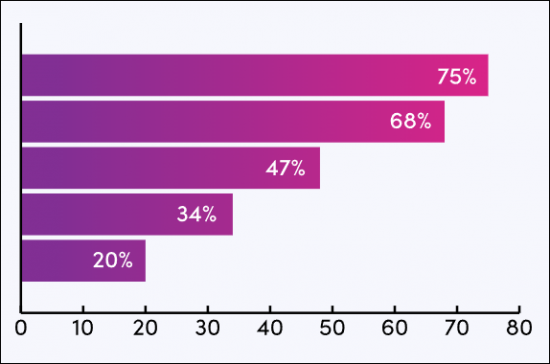
A comprehensive analysis of the current market landscape, alongside strategic recommendations.
Market Data & Forecasting Report
The market-leading research suite for the "Smart Grid" market includes access to the full set of market forecast data of 49 tables and more than 21,500 datapoints.
Metrics in the research suite include:
- Smart Grid:
- Smart Grid Completion (%)
- Smart Grid Software Revenue ($m)
- Smart Grid Energy Savings (TWh)
- Smart Grid Energy Cost Savings ($m)
- Smart Grid Emissions Savings (MMT CO2e)
- Smart Grid Emissions Cost Savings ($m)
- Smart Metering:
- Smart Meters in Service (m)
- Smart Meter Shipments (m)
- Cellular Smart Meters (m)
- Smart Meter Data Usage (PB)
- Smart Meter SIMs (%) and Connectivity Revenue ($m), both split by:
- 2G
- 3G
- 4G
- 5G
- LTE-M
- NB-IoT
- Smart Meter Hardware Revenue ($m)
Juniper Research's Interactive Forecast Excel contains the following functionality:
- Statistics Analysis: Users benefit from the ability to search for specific metrics; displayed for all regions and countries across the data period. Graphs are easily modified and can be exported to the clipboard.
- Country Data Tool: This tool lets users look at metrics for all key regions and countries in the forecast period. Users can refine the metrics displayed via a search bar.
- Country Comparison Tool: Users can select and compare different countries. The ability to export graphs is included in this tool.
- What-if Analysis: Here, users can compare forecast metrics against their own assumptions, via five interactive scenarios.
Market Trends & Strategies Report
This report provides an in-depth assessment of the "Smart Grid" landscape; analysing the technological, regulatory and commercial forces that will shape the sector over the next five years. It examines the impact of distributed energy resources, virtual power plants, AI-driven grid intelligence, and cyber security, alongside evolving consumer and prosumer behaviour; highlighting how these trends will drive change across the market.
The study ties emerging challenges directly to strategic recommendations; ensuring vendors and utilities can translate disruption into actionable opportunities. It identifies the partnerships, business models, and technology pathways that will prove most effective, while also providing guidance on how stakeholders can overcome regulatory and operational barriers.
Competitor Leaderboard Report
This "Smart Grid" market study includes a Competitor Leaderboard report; providing detailed evaluation and market positioning of 15 smart grid vendors. The vendors are positioned as established leaders, leading challengers, or disruptors and challengers, based on product and capability assessments.
Juniper Research's Competitor Leaderboard for Smart Grid includes the following key players:
|
|
|
This report is centred around the Juniper Research Competitor Leaderboard; a vendor positioning tool that provides an at-a-glance view of the competitive landscape in a market, backed by robust methodology.
Table of Contents
Market Trends & Strategies
1. Key Takeaways & Strategic Recommendations
- 1.1. Key Takeaways
- 1.2. Strategic Recommendations
2. Market Landscape
- 2.1. Introduction
- 2.2. Defining the Smart Grid
- 2.3. Overview
- 2.3.1. Global Adoption
- Figure 2.1: Regional Breakdown of Smart Meters in Service by 2030
- i. Markets to Watch
- 2.3.2. Financial Outlook
- Figure 2.2: Smart Grid Software Revenue ($m), Split by 8 Key Regions, 2025-2030
- 2.3.3. Impact on Consumers & Utilities
- Figure 2.3: Regional Breakdown of Smart Grid Emissions Cost Savings by 2030
- 2.3.4. Enabling Technologies
- Figure 2.4: Smart Meter SIMs (m), Split by Technology, 2025-2030
- 2.3.1. Global Adoption
3. Trends, Challenges & Opportunities
- 3.1. Introduction
- 3.2. Emerging Trends
- 3.2.1. AI-driven Grid Automation & Decision-making
- i. Overview
- ii. Growth in AI-related Smart Grid Patents
- iii. Data Management & Quality
- iv. Energy Consumption of AI Systems
- Figure 3.1: Projected Data Centre Electricity Consumption, 2020-2030 (TWh)
- 3.2.2. Advanced Metering Infrastructure
- i. Overview
- ii. Customer Engagement Features
- iii. Strain from Dynamic Tariffs & Real-time Settlement
- iv. Disparities in Roll-out & Digital Inclusion
- 3.2.3. Distributed Energy Resources
- i. Overview
- ii. Key DERs
- Figure 3.2: Total Energy Saved via Heat Pumps (MWh), Split by 8 Key Regions, 2025-2029
- iii. Advanced Control & Orchestration Platforms
- iv. Data Interoperability
- 3.2.4. Renewable Energy Sources
- i. Overview
- ii. Hybrid Renewable-plus Storage Systems
- Figure 3.3: Total Energy Generated by Renewable Sources (TWh), 2025-2029
- iii. Grid-forming Inverters
- iv. Forecasting & Predictability
- 3.2.5. Virtual Power Plants
- i. Overview
- ii. Sector Coupling
- iii. Cross-border VPPs
- iv. Economic Viability & Business Models
- 3.2.1. AI-driven Grid Automation & Decision-making
- 3.3. Key Challenges
- 3.3.1. Cyber Security
- i. Overview
- ii. Inconsistent Standards & Protocols
- iii. Zero Trust
- 3.3.2. Regulatory Complexity & Compliance
- i. Overview
- ii. Grid Fragmentation
- iii. Emerging Compliance Tools
- 3.3.3. Data Privacy & Consumer Trust
- i. Overview
- ii. Security Risks
- iii. Maintaining Privacy
- iv. Synthetic Data
- 3.3.1. Cyber Security
- 3.4. Stakeholder Opportunities
- 3.4.1. Utilities & Grid Operators
- i. Invest in Infrastructure & Intelligence
- ii. Champion Data Quality & Governance
- iii. Prioritise Interoperability & Open Standards
- 3.4.2. Technology Providers & Manufacturers
- i. Develop Low-energy, Scalable AI Tools
- ii. Offer Plug and Play Interoperability
- iii. Build Cyber Resilience Into Every Layer
- 3.4.3. Policymakers & Regulators
- i. Mandate Digital Inclusion
- ii. Simplify & Harmonise Regulatory Frameworks
- iii. Incentivise Open Standards and Secure Design
- 3.4.4. Investors & Project Developers
- i. Hybrid Systems & Flexible Assets
- ii. Focus on Enabling Infrastructure
- 3.4.1. Utilities & Grid Operators
4. Country Readiness Index
- 4.1. Introduction
- Figure 4.1: Juniper Research's 8 Key Regions
- Table 4.2: Juniper Research Smart Grid Country Readiness Index: Scoring Criteria
- Figure 4.3: Juniper Research Country Readiness Index - Smart Grid
- Figure 4.4: Juniper Research Competitive Web - Smart Grid Regional Opportunities
- 4.2. Focus Markets
- Figure 4.5: List of Focus Markets
- 4.2.1. Key Characteristics
- i. High Digital Maturity
- ii. Strong Regulatory Support
- iii. Large-scale Smart Meter Penetration
- iv. Advanced Power Infrastructure
- v. Commercial Viability
- 4.2.2. Markets to Watch
- i. Australia
- ii. China
- iii. Germany
- iv. Japan
- v. South Korea
- vi. UK
- vii. US
- 4.2.3. Strategic Recommendations for Stakeholders
- i. Optimise Existing Infrastructure with Advanced Grid Intelligence
- ii. Enable Cross-sector Integration through Open Standards
- iii. Monetise Flexibility Services & Demand Response
- iv. Advance Consumer-centric Innovations
- v. Strengthen Cyber Security Protocols
- 4.3. Growth Markets
- Figure 4.6: List of Growth Markets
- 4.3.1. Key Characteristics
- i. Rapid Increase in Smart Grid Investment
- ii. Improving Regulatory Landscape
- iii. Emerging Digital Infrastructure
- iv. High Potential for Cost Savings & Efficiency Gains
- v. Strong Long-term Market Outlook
- 4.3.2. Markets to Watch
- i. Malaysia
- ii. Thailand
- iii. Vietnam
- 4.3.3. Strategic Recommendations for Stakeholders
- i. Design Smart Grid Architectures with Future Scalability in Mind
- ii. Accelerate Urban Pilots That Demonstrate Quick Wins
- iii. Work Proactively with Governments to Shape Regulation
- iv. Localise Technology for Infrastructure Gaps & Grid Instability
- v. Develop Capacity-building Partnerships with Local Utilities
- vi. Quantify & Communicate Socioeconomic Impact
- 4.4. Saturated Markets
- Figure 4.7: List of Saturated Markets
- 4.4.1. Key Characteristics
- i. High Smart Meter & Grid Technology Penetration
- ii. Rigid Regulatory Frameworks
- iii. Limited Room for New Entrants
- iv. Focus Shift from Deployment to Performance Optimisation
- v. Growing Pressure Around Consumer Engagement
- 4.4.2. Markets to Watch
- i. Austria
- ii. Finland
- iii. Ireland
- 4.4.3. Strategic Recommendations for Stakeholders
- i. Focus on Grid Intelligence, Not Grid Expansion
- ii. Enable Deep Integration of Distributed Energy Resources
- iii. Offer Lifecycle Services & Platform Upgrades
- iv. Push for Regulatory Innovation
- v. Reframe Value Around Consumer-centric Services
- vi. Invest in Cyber Security Resilience
- 4.5. Developing Markets
- Figure 4.8: List of Developing Markets
- 4.5.1. Key Characteristics
- i. Low Smart Grid & Metering Penetration
- ii. Inconsistent or Undeveloped Policy Frameworks
- iii. Basic Connectivity & Power Infrastructure Constraints
- iv. Significant Electrification & Access Gaps
- v. Untapped Opportunity for Leapfrogging
- 4.5.2. Markets to Watch
- i. Argentina
- ii. Bangladesh
- iii. Egypt
- iv. Kenya
- v. Mexico
- vi. Nigeria
- vii. Pakistan
- viii. South Africa
- ix. Ukraine
- x. United Arab Emirates (UAE)
- 4.5.3. Strategic Recommendations for Stakeholders
- i. Integrate Smart Grid Planning with National Electrification Goals
- ii. Support Policy Development Through Technical Assistance
- iii. Prioritise Decentralised Solutions
- iv. Design for Resilience & Simplicity
- v. Enable Local Workforce Development
- vi. Leverage Development Finance & Blended Investment Models
- 4.6. Regional Heatmaps
- 4.6.1. North America
- 4.6.2. Latin America
- 4.6.3. West Europe
- 4.6.4. Central & East Europe
- 4.6.5. Far East & China
- 4.6.6. Indian Subcontinent
- 4.6.7. Rest of Asia Pacific
- 4.6.8. Africa & Middle East
Endnotes
Competitor Leaderboard
1. Smart Grid Competitor Leaderboard
- Why Read this Report?
- Vendor Takeaways & Strategic Recommendations
- Table 1.1: Juniper Research Competitor Leaderboard: Smart Grid Vendors
- Figure 1.2: Juniper Research Competitor Leaderboard: Smart Grid
- Figure 1.3: Juniper Research Competitor Leaderboard: Smart Grid Vendors & Positioning
- Table 1.4: Juniper Research Smart Grid Competitor Leaderboard Heatmap
2. Vendor Profiles
- 2.1. ABB
- i. Corporate Information
- Table 2.1: Financial Overview, ABB ($bn)
- ii. Geographical Spread
- iii. Key Clients & Strategic Partnerships
- iv. High-level View of Offerings
- Figure 2.2: ABB Microgrid Community
- v. Juniper Research's View: Key Strengths & Strategic Development Opportunities
- i. Corporate Information
- 2.2. Cisco Systems
- i. Corporate Information
- Table 2.3: Financial Overview, Cisco Systems ($bn)
- ii. Geographical Spread
- iii. Key Clients & Strategic Partnerships
- iv. High-level View of Offerings
- Figure 2.4: Cisco Secure SD-WAN Architecture for DERs
- v. Juniper Research's View: Key Strengths & Strategic Development Opportunities
- i. Corporate Information
- 2.3. Eaton
- i. Corporate Information
- Table 2.5: Financial Overview, Eaton ($bn)
- ii. Geographical Spread
- iii. Key Clients & Strategic Partnerships
- iv. High-level View of Offerings
- Figure 2.6: Eaton xStorage Energy Storage Container
- v. Juniper Research's View: Key Strengths & Strategic Development Opportunities
- i. Corporate Information
- 2.4. Fujitsu
- i. Corporate Information
- Table 2.7: Financial Overview, Fujitsu ($bn)
- ii. Geographical Spread
- iii. Key Clients & Strategic Partnerships
- iv. High-level View of Offerings
- v. Juniper Research's View: Key Strengths & Strategic Development Opportunities
- i. Corporate Information
- 2.5. GE Vernova
- i. Corporate Information
- Table 2.8: Financial Overview, GE Vernova ($bn)
- ii. Geographical Spread
- iii. Key Clients & Strategic Partnerships
- iv. High-level View of Offerings
- Figure 2.9: GridOS DERMS System Architecture
- v. Juniper Research's View: Key Strengths & Strategic Development Opportunities
- i. Corporate Information
- 2.6. Hitachi Energy
- i. Corporate Information
- Table 2.10: Financial Overview, Hitachi ($bn)
- ii. Geographical Spread
- iii. Key Clients & Strategic Partnerships
- iv. High-level View of Offerings
- v. Juniper Research's View: Key Strengths & Strategic Development Opportunities
- i. Corporate Information
- 2.7. Honeywell
- i. Corporate Information
- Table 2.11: Financial Overview, Honeywell ($bn)
- ii. Geographical Spread
- iii. Key Clients & Strategic Partnerships
- iv. High-level View of Offerings
- v. Juniper Research's View: Key Strengths & Strategic Development Opportunities
- i. Corporate Information
- 2.8. IBM
- i. Corporate Information
- Table 2.12: Financial Overview, IBM ($bn)
- ii. Geographical Spread
- iii. Key Clients & Strategic Partnerships
- iv. High-level View of Offerings
- v. Juniper Research's View: Key Strengths & Strategic Development Opportunities
- i. Corporate Information
- 2.9. Itron
- i. Corporate Information
- Table 2.13: Financial Overview, Itron ($bn)
- ii. Geographical Spread
- iii. Key Clients & Strategic Partnerships
- iv. High-level View of Offerings
- v. Juniper Research's View: Key Strengths & Strategic Development Opportunities
- i. Corporate Information
- 2.10. Landis+Gyr
- i. Corporate Information
- Table 2.14: Financial Overview, Landis+Gyr ($bn)
- ii. Geographical Spread
- iii. Key Clients & Strategic Partnerships
- iv. High-level View of Offerings
- v. Juniper Research's View: Key Strengths & Strategic Development Opportunities
- i. Corporate Information
- 2.11. Oracle
- i. Corporate Information
- Table 2.15: Financial Overview, Oracle ($bn)
- ii. Geographical Spread
- iii. Key Clients & Strategic Partnerships
- iv. High-level View of Offerings
- v. Juniper Research's View: Key Strengths & Strategic Development Opportunities
- i. Corporate Information
- 2.12. Panasonic
- i. Corporate Information
- Table 2.16: Financial Overview, Panasonic ($bn)
- ii. Geographical Spread
- iii. Key Clients & Strategic Partnerships
- iv. High-level View of Offerings
- v. Juniper Research's View: Key Strengths & Strategic Development Opportunities
- i. Corporate Information
- 2.13. Schneider Electric
- i. Corporate Information
- Table 2.17: Financial Overview, Schneider Electric ($bn)
- ii. Geographical Spread
- iii. Key Clients & Strategic Partnerships
- iv. High-level View of Offerings
- Figure 2.18: Schneider Electric EcoStruxure Grid Overview
- v. Juniper Research's View: Key Strengths & Strategic Development Opportunities
- i. Corporate Information
- 2.14. Siemens
- i. Corporate Information
- Table 2.19: Financial Overview, Siemens Smart Infrastructure ($bn)
- ii. Geographical Spread
- iii. Key Clients & Strategic Partnerships
- iv. High-level View of Offerings
- v. Juniper Research's View: Key Strengths & Strategic Development Opportunities
- i. Corporate Information
- 2.15. Tantalus
- i. Corporate Information
- Table 2.20: Financial Overview, Tantalus ($m)
- ii. Geographical Spread
- iii. Key Clients & Strategic Partnerships
- iv. High-level View of Offerings
- Figure 2.21: Tantalus TruSense Gateway Composition
- v. Juniper Research's View: Key Strengths & Strategic Development Opportunities
- i. Corporate Information
3. Methodology
- 3.1. Competitor Leaderboard Assessment Methodology
- 3.2. Limitations & Interpretations
- Table 3.1: Juniper Research Smart Grid Competitor Leaderboard Criteria
- 3.3. Related Research
Endnotes
Data & Forecasting
1. Market Landscape
- 1.1. Introduction
- 1.2. Defining the Smart Grid
- 1.3. Overview
- 1.3.1. Global Adoption
- i. Markets to Watch
- 1.3.2. Financial Outlook
- 1.3.3. Impact on Consumers & Utilities
- 1.3.4. Enabling Technologies
- 1.3.1. Global Adoption
2. Smart Grid Market Forecasts
- 2.1. Introduction
- 2.2. Forecast Methodology & Assumptions
- Figure 2.1: Smart Grid Forecast Methodology
- 2.3. Smart Grid Completion
- Figure & Table 2.2: Global Smart Grid Completion, Year End (%), 2025-2030
- 2.4. Smart Grid Software Revenue
- Figure & Table 2.3: Smart Grid Software Revenue ($m), Split by 8 Key Regions, 2025-2030
- 2.5. Smart Grid Energy Savings
- Figure & Table 2.4: Smart Grid Energy Savings (TWh), Split by 8 Key Regions, 2025-2030
- 2.6. Smart Grid Energy Cost Savings
- Figure & Table 2.5: Smart Grid Energy Cost Savings ($m), Split by 8 Key Regions, 2025-2030
- 2.7. Smart Grid Emissions Savings
- Figure & Table 2.6: Smart Grid Emissions Savings (MMT CO2e), Split by 8 Key Regions, 2025-2030
- 2.8. Smart Grid Emissions Cost Savings
- Figure & Table 2.7: Smart Grid Emissions Cost Savings ($m), Split by 8 Key Regions, 2025-2030
3. Smart Meter Market Forecasts
- 3.1. Introduction
- 3.2. Forecast Methodology & Assumptions
- Figure 3.1: Smart Meter Forecast Methodology
- 3.3. Smart Meters in Service
- Figure & Table 3.2: Smart Meters in Service (m), Split by 8 Key Regions, 2025-2030
- 3.4. Smart Meter Shipments
- Figure & Table 3.3: Smart Meter Shipments (m), Split by 8 Key Regions, 2025-2030
- 3.5. Cellular Smart Meters
- Figure & Table 3.4: Cellular Smart Meters (m), Split by 8 Key Regions, 2025-2030
- 3.6. Smart Meter SIMs
- Figure & Table 3.5: Smart Meter SIMs (m), Split by Technology, 2025-2030
- 3.7. Smart Meter Data Usage
- Figure & Table 3.6: Smart Meter Data Usage (PB), Split by 8 Key Regions, 2025-2030
- 3.8. Smart Meter Revenue
- Figure & Table 3.7: Smart Meter Revenue ($m), Split by 8 Key Regions, 2025-2030
- Table 3.8: Smart Meter Revenue ($m), Split by Source, 2025-2030
- Table 3.9: Smart Meter Revenue (%), Split by Source, 2025-2030
- 3.9. Smart Meter Hardware Revenue
- Figure & Table 3.10: Smart Meter Hardware Revenue ($m), Split by 8 Key Regions, 2025-2030
- 3.10. Smart Meter Connectivity Revenue
- Figure & Table 3.11: Smart Meter Connectivity Revenue ($m), Split by 8 Key Regions, 2025-2030

