
PUBLISHER: MarketsandMarkets | PRODUCT CODE: 1780341

PUBLISHER: MarketsandMarkets | PRODUCT CODE: 1780341
Distribution Transformer Market by Mounting (Pad, Pole, Underground), Phase (Three and Single), Power Rating (Up to 0.5 MVA, 0.5-2.5 MVA, 2.5-10 MVA, above 10 MVA), Insulation (Oil-immersed, Dry), End User, and Region - Global Forecast to 2030
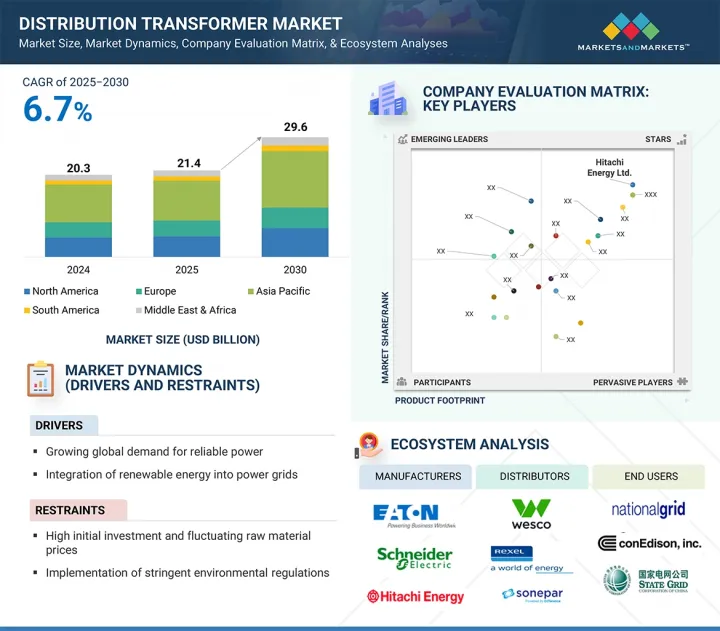
The global distribution transformer market is projected to grow from USD 21.4 billion by 2025 to USD 29.6 billion by 2030, at a CAGR of 6.7%.
| Scope of the Report | |
|---|---|
| Years Considered for the Study | 2021-2030 |
| Base Year | 2024 |
| Forecast Period | 2025-2030 |
| Units Considered | Value (USD million), Volume (Units) |
| Segments | Distribution transformer market by mounting, phase, insulation, power rating, end user, and region |
| Regions covered | North America, Europe, Asia Pacific, Middle East & Africa, and South America |
The market is expected to experience considerable growth over the forecast period as demand for credible, reliable, and efficient power delivery infrastructure increases. Due to increasing reliance on smart and connected transformer technologies, utilities and transmission system owners are better able to improve resilience, ensure uptime, and lower maintenance costs. The increasing use of digital monitoring, condition-based diagnostics, and predictive maintenance is changing the practice of asset management for utilities. This allows utilities to monitor transformer aging, prevent unexpected failures, and maintain legacy equipment at optimal performance levels. Electrification is on the rise across all sectors, especially in the residential, commercial, and industrial markets, with the emergence of renewables and electric vehicle (EV) charging infrastructure. The demand for advanced distribution transformers with self-diagnostics and thermal sensing with real-time load management capabilities is on the rise. Next-generation distribution transformer technologies, whether dry-type or oil-immersed, and with intelligent capabilities, enable utilities to manage dynamic load conditions while extending the life of the equipment under changing conditions. With a growing emphasis on grid modernization and sustainability, predictive maintenance becomes a key growth driver of the distribution transformer market, as it plays an important role in power quality, reliability, and lowering downtime.
Utilities to be fastest-growing end user segment during forecast period
The utilities sector is expected to be the fastest-growing end user in the global distribution transformer market throughout the forecast period, supported by increased investment aimed at modernizing power infrastructure and increasing grid capacity in both developed and developing economies. As national grids age and electricity demand increase due to urbanization, industrialization, and digitalization, utilities are shifting toward replacing older versions of distribution systems with modern, highly efficient transformers with lower energy losses and higher reliability. In addition, the influx of more renewable energy (solar and wind) into utility-scale power systems requires flexible as well as smart transformer technology to manage variable load profiles, provide bi-directional power flow, and balance the grid in real-time. Significant government-led electrification and rural expansion programs across Asia Pacific, the Middle East, and Africa are based on deployed utility-toned (as opposed to independently deployable) transformer solutions, where the utility will ensure uninterrupted access to power. Additionally, the regulatory push towards decarbonization and the adoption of predictive maintenance technologies are simultaneously driving utilities towards digitally enabled and environmentally sustainable transformer units. In conclusion, the utility sector serves as a significant growth engine for the overall distribution transformer market.
2.5-10 MVA segment to exhibit highest CAGR during forecast period
The 2.5-10 MVA power rating range is expected to register the highest CAGR in the global distribution transformer market over the forecast period, primarily due to its suitability for medium-scale industrial, commercial, and urban utility loads. As emerging economies see increased urbanization and industrial growth, particularly in sectors like manufacturing, healthcare, and data centers, the demand for mid-capacity transformers that can support larger loads without compromising efficiency or stability has surged considerably. This segment is crucial for high-rise commercial buildings, metro systems, substations, and small to medium-sized renewable energy systems, where greater power output and a smaller footprint are essential. Additionally, the rising electrification of semi-urban and peri-urban areas in emerging nations such as India, China, Indonesia, and parts of Africa is driving the installation of 2.5-10 MVA units due to their cost-effectiveness and operational flexibility. These units also offer an optimal balance between power transfer capability and infrastructure costs, making them a preferred choice for utilities and EPC contractors looking to enhance grid infrastructure while minimizing investment. Moreover, the increasing adoption of decentralized energy systems and the necessity to meet dynamic and localized energy demands further accelerate the growth of this segment.
Asia Pacific to be the fastest-growing market during forecast period
Asia Pacific is anticipated to emerge as the fastest-growing market for distribution transformers globally during the forecast period with its high-speed economic growth, large-scale urbanization, and aggressive electrification drive in emerging economies like China, India, Indonesia, Vietnam, and the Philippines. In order to meet the growing demand for power from residential, commercial, and industrial consumers, the region is seeing significant investments in the expansion of transmission and distribution networks. Government programs such as India's Deendayal Upadhyaya Gram Jyoti Yojana (DDUGJY), China's Belt and Road Initiative (BRI), and rural electrification schemes of the ASEAN nations are majorly propelling the installation of transformers. In addition, the surge in the use of renewable energy sources, such as solar and wind, is also generating a need for advanced, efficient distribution transformers with the ability to manage intermittent loads and be compatible with smart grid infrastructure. Growing use of electric vehicles (EVs), anticipated growth in metro rail networks, and digitalization of substation facilities are also driving the market in this region. Moreover, increasing indigenous manufacturing capacities, policy measures, and foreign direct investment (FDI) flows into energy infrastructure projects are also driving the market growth in Asia Pacific.
In-depth interviews have been conducted with chief executive officers (CEOs), directors, and other executives from various key organizations operating in the distribution transformer market.
By Company Type: Tier 1 - 30%, Tier 2 - 55%, and Tier 3 - 15%
By Designation: C-level Executives - 30%, Directors - 20%, and Others - 50%
By Region: Asia Pacific - 40%, North America - 30%, Europe - 20%, Middle East & Africa - 5%, and South America - 5%
Note: Other designations include engineers and sales & regional managers.
The tiers of the companies are defined based on their total revenue as of 2024: Tier 1: >USD 1 billion, Tier 2: USD 500 million-1 billion, and Tier 3: <USD 500 million.
A few major players with extensive geographical presence dominate the distribution transformer market. The leading players are Hitachi Energy Ltd. (Switzerland), Eaton (Ireland), Siemens Energy (Germany), Schneider Electric (France), and Toshiba Energy Systems & Solutions Corporation (Japan).
Research Coverage:
The report defines, describes, and forecasts the distribution transformer market mounting (Pad, Pole, Underground), phase (Three and Single), power rating (Up to 0.5 MVA, 0.5-2.5 MVA, 2.5-10 MVA, above 10 MVA), insulation (Oil-immersed, Dry), end user (Industrial, commercial & residential, utilities), and region. It also offers a detailed qualitative and quantitative analysis of the market. The report comprehensively reviews the major market drivers, restraints, opportunities, and challenges. It also covers various important aspects of the market. A comprehensive analysis of the key players in the distribution transformer market has been conducted. This analysis provides insights into their business overview, solutions and services, and key strategies. It also covers relevant contracts, partnerships, and agreements, along with new product launches, mergers, acquisitions, and other recent developments in the market. Additionally, the report includes a competitive analysis of emerging startups within the distribution transformer market ecosystem.
Reasons to Buy This Report:
This report is a strategic resource for industry leaders and new entrants, offering a comprehensive analysis of the market and its subsegments. It equips stakeholders with a thorough understanding of the competitive landscape, enabling them to refine their business positioning and devise effective go-to-market strategies. Additionally, the report elucidates the current market dynamics, highlighting critical drivers, constraints, challenges, and opportunities that inform strategic decision-making.
The report provides insights on the following points:
- Analysis of key drivers (Growing global demand for reliable power, Integration of renewable energy into power grids), restraints (High initial investment and fluctuating raw material prices, Implementation of stringent environmental regulations), opportunities (Rising annual smart grid investments to achieve global climate goals, High focus of utilities on achieving energy efficiency), and challenges (Disruptions in supply chain of grid technology) influencing the growth
- Product Development/Innovation: Competition in the transformation distribution industry is increasingly focused on technical innovation in insulation materials, energy efficiency, and digitization. Stakeholders are increasingly investing in solid dielectric insulation, advanced cooling technologies such as forced-air or hybrid systems, and IoT-driven condition monitoring solutions that enable predictive maintenance. Dry-type transformers are witnessing increased usage across commercial buildings and environmentally sensitive areas, whereas oil-immersed types are still the norm in utility-scale operations. Smart diagnostic integration, thermal monitoring, and self-healing capabilities into transformer cores and enclosures are assisting utilities in prolonging asset life along with enhanced grid stability.
- Market Development: Robust market growth is witnessed across developing regions such as Asia Pacific, Africa, and Latin America, driven by urban expansion, rural electrification, and infrastructure development. Large-scale government projects, such as India's Saubhagya Scheme, Africa's Power Africa initiative, and Southeast Asia's smart grid rollouts, are spurring demand for medium-voltage distribution transformers in both oil-immersed and dry-type categories. The expansion of solar microgrids and EV charging networks also demands compact pad-mounted and pole-mounted transformer solutions.
- Market Diversification: The application of distribution transformers is diversifying beyond conventional utilities into segments such as data centers, airports, commercial buildings, hospitals, renewable energy plants, and electric vehicle charging hubs. These end users require customized transformer solutions with reduced footprint, enhanced safety, and minimal operational noise. Manufacturers are responding by developing pre-assembled modular transformers with plug-and-play capabilities, fire-resistant casings, and intelligent fault diagnostics to meet the performance expectations of specialized sectors.
- Competitive Assessment: The competitive scenario of the distribution transformer market includes players such as Hitachi Energy Ltd. (Switzerland), Eaton (Ireland), Siemens Energy (Germany), Schneider Electric (France), and Toshiba Energy Systems & Solutions Corporation (Japan), all of which maintain a strong global footprint supported by diversified product portfolios and regional manufacturing hubs. These companies are actively engaging in strategic collaborations with EPC contractors and local utilities to enhance smart grid readiness, advance their dry-type transformer platforms, and localize production to meet the evolving demands of rapidly developing economies. By consistently investing in R&D for intelligent transformer technologies, eco-friendly insulation solutions, and energy-efficient designs, these industry leaders are positioning themselves to capitalize on emerging market opportunities and drive the modernization of the global power infrastructure.
TABLE OF CONTENTS
1 INTRODUCTION
- 1.1 STUDY OBJECTIVES
- 1.2 MARKET DEFINITION
- 1.2.1 INCLUSIONS AND EXCLUSIONS
- 1.3 STUDY SCOPE
- 1.3.1 MARKETS COVERED AND REGIONAL SCOPE
- 1.3.2 YEARS CONSIDERED
- 1.3.3 CURRENCY CONSIDERED
- 1.3.4 UNITS CONSIDERED
- 1.4 LIMITATIONS
- 1.5 STAKEHOLDERS
- 1.6 SUMMARY OF CHANGES
2 RESEARCH METHODOLOGY
- 2.1 RESEARCH DATA
- 2.2 MARKET BREAKDOWN AND DATA TRIANGULATION
- 2.2.1 SECONDARY DATA
- 2.2.1.1 Key data from secondary sources
- 2.2.1.2 List of major secondary sources
- 2.2.2 PRIMARY DATA
- 2.2.2.1 Breakdown of primaries
- 2.2.2.2 List of primary interview participants
- 2.2.1 SECONDARY DATA
- 2.3 MARKET SIZE ESTIMATION
- 2.3.1 BOTTOM-UP APPROACH
- 2.3.2 TOP-DOWN APPROACH
- 2.3.3 DEMAND-SIDE ANALYSIS
- 2.3.3.1 Regional analysis
- 2.3.3.2 Country-level analysis
- 2.3.3.3 Demand-side assumptions
- 2.3.3.4 Demand-side calculations
- 2.3.4 SUPPLY-SIDE ANALYSIS
- 2.3.4.1 Supply-side assumptions
- 2.3.4.2 Supply-side calculations
- 2.4 RESEARCH ASSUMPTIONS
- 2.5 RISK ASSESSMENT
- 2.6 RESEARCH LIMITATIONS
3 EXECUTIVE SUMMARY
4 PREMIUM INSIGHTS
- 4.1 ATTRACTIVE OPPORTUNITIES FOR PLAYERS IN DISTRIBUTION TRANSFORMER MARKET
- 4.2 DISTRIBUTION TRANSFORMER MARKET, BY REGION
- 4.3 DISTRIBUTION TRANSFORMER MARKET IN ASIA PACIFIC, BY MOUNTING AND COUNTRY
- 4.4 DISTRIBUTION TRANSFORMER MARKET, BY MOUNTING
- 4.5 DISTRIBUTION TRANSFORMER MARKET, BY PHASE
- 4.6 DISTRIBUTION TRANSFORMER MARKET, BY POWER RATING
- 4.7 DISTRIBUTION TRANSFORMER MARKET, BY INSULATION
- 4.8 DISTRIBUTION TRANSFORMER MARKET, BY END USER
5 MARKET OVERVIEW
- 5.1 INTRODUCTION
- 5.2 MARKET DYNAMICS
- 5.2.1 DRIVERS
- 5.2.1.1 Electrification of residential and transportation sectors
- 5.2.1.2 Aging global grid infrastructure
- 5.2.1.3 Integration of renewable energy into power grids
- 5.2.2 RESTRAINTS
- 5.2.2.1 High initial investment and fluctuating raw material prices
- 5.2.2.2 Implementation of stringent environmental regulations
- 5.2.3 OPPORTUNITIES
- 5.2.3.1 Shift toward intelligent and efficient power grid infrastructure
- 5.2.3.2 Emphasis on offering energy-efficient transformers
- 5.2.3.3 Growing demand of distribution transformers in developing economies
- 5.2.4 CHALLENGES
- 5.2.4.1 Disruptions in supply chain of grid technology
- 5.2.4.2 Cybersecurity threats
- 5.2.1 DRIVERS
- 5.3 TRENDS/DISRUPTIONS IMPACTING CUSTOMER BUSINESS
- 5.4 ECOSYSTEM ANALYSIS
- 5.5 INVESTMENT AND FUNDING SCENARIO
- 5.6 SUPPLY CHAIN ANALYSIS
- 5.6.1 RAW MATERIAL PROVIDERS/SUPPLIERS
- 5.6.2 COMPONENT MANUFACTURERS
- 5.6.3 DISTRIBUTION TRANSFORMER MANUFACTURERS/ASSEMBLERS
- 5.6.4 DISTRIBUTORS
- 5.6.5 END USERS
- 5.6.6 POST-SALES SERVICE PROVIDERS
- 5.7 TECHNOLOGY ANALYSIS
- 5.7.1 KEY TECHNOLOGIES
- 5.7.1.1 Smart digitized distribution transformers
- 5.7.1.2 Solid-state transformers (SSTs)
- 5.7.2 COMPLEMENTARY TECHNOLOGIES
- 5.7.2.1 Smart grids
- 5.7.2.2 Advanced metering infrastructure (AMI)
- 5.7.3 ADJACENT TECHNOLOGIES
- 5.7.3.1 Battery energy storage systems (BESS)
- 5.7.1 KEY TECHNOLOGIES
- 5.8 PRICING ANALYSIS
- 5.8.1 PRICING RANGE OF DISTRIBUTION TRANSFORMERS, BY POWER RATING
- 5.8.2 AVERAGE SELLING PRICE TREND OF DISTRIBUTION TRANSFORMERS, BY REGION
- 5.9 KEY CONFERENCES AND EVENTS, 2025-2026
- 5.10 TARIFFS AND REGULATORY LANDSCAPE
- 5.10.1 TARIFFS RELATED TO DISTRIBUTION TRANSFORMERS
- 5.10.2 REGULATORY BODIES, GOVERNMENT AGENCIES, AND OTHER ORGANIZATIONS
- 5.10.3 REGULATIONS
- 5.11 TRADE ANALYSIS
- 5.11.1 IMPORT SCENARIO (HS CODE 8504)
- 5.11.2 EXPORT SCENARIO (HS CODE 8504)
- 5.12 PATENT ANALYSIS
- 5.12.1 LIST OF PATENTS
- 5.13 PORTER'S FIVE FORCES ANALYSIS
- 5.13.1 THREAT OF SUBSTITUTES
- 5.13.2 BARGAINING POWER OF SUPPLIERS
- 5.13.3 BARGAINING POWER OF BUYERS
- 5.13.4 THREAT OF NEW ENTRANTS
- 5.13.5 INTENSITY OF COMPETITIVE RIVALRY
- 5.14 KEY STAKEHOLDERS AND BUYING CRITERIA
- 5.14.1 KEY STAKEHOLDERS IN BUYING PROCESS
- 5.14.2 BUYING CRITERIA
- 5.15 CASE STUDY ANALYSIS
- 5.15.1 HITACHI ENERGY INTRODUCES EASYDRY 550KV THAT ELIMINATES INGRESS AND OIL LEAK HAZARDS
- 5.15.2 HITACHI ENERGY ENABLES SMART TRANSFORMER MANAGEMENT WITH TXOERT HUB THAT BOOSTS RELIABILITY AND EFFICIENCY
- 5.15.3 HITACHI ENERGY PROTECTS TRANSFORMERS FROM INSULATION DAMAGE AND FAILURES USING TVP
- 5.16 IMPACT OF GEN AI/AI ON DISTRIBUTION TRANSFORMER MARKET
- 5.16.1 ADOPTION OF GEN AI/AI IN DISTRIBUTION TRANSFORMER MARKET
- 5.16.2 IMPACT OF GEN AI/AI ON DISTRIBUTION TRANSFORMER MARKET, BY REGION
- 5.17 IMPACT OF 2025 US TARIFF ON DISTRIBUTION TRANSFORMER MARKET
- 5.17.1 INTRODUCTION
- 5.17.2 KEY TARIFF RATES
- 5.17.3 IMPACT ON COUNTRY/REGION
- 5.17.3.1 US
- 5.17.3.2 Europe
- 5.17.3.3 Asia pacific
- 5.17.4 IMPACT ON END USERS
6 DISTRIBUTION TRANSFORMER MARKET, BY MOUNTING
- 6.1 INTRODUCTION
- 6.2 PAD
- 6.2.1 DEPLOYMENT AT HIGH-TRAFFIC PUBLIC AREAS TO REDUCE RISK OF ACCIDENTAL CONTACTS TO FUEL MARKET GROWTH
- 6.3 POLE
- 6.3.1 INTEGRATION WITH SMART GRID TECHNOLOGIES TO ENHANCE MONITORING AND CONTROL CAPABILITIES TO DRIVE MARKET
- 6.4 UNDERGROUND
- 6.4.1 IMPROVED RELIABILITY AND REDUCED DOWNTIME TO SUPPORT MARKET GROWTH
7 DISTRIBUTION TRANSFORMER MARKET, BY PHASE
- 7.1 INTRODUCTION
- 7.2 THREE
- 7.2.1 DEPLOYMENT IN WIND AND SOLAR FARMS TO DRIVE MARKET
- 7.3 SINGLE
- 7.3.1 ONGOING INNOVATIONS IN LOW-LOSS CORE MATERIALS AND THERMAL MANAGEMENT TO SUPPORT MARKET GROWTH
8 DISTRIBUTION TRANSFORMER MARKET, BY POWER RATING
- 8.1 INTRODUCTION
- 8.2 UP TO 0.5 MVA
- 8.2.1 DEPLOYMENT IN EMERGENCY RESPONSE SCENARIOS OR TEMPORARY GRID EXTENSIONS TO FOSTER MARKET GROWTH
- 8.3 0.5-2.5 MVA
- 8.3.1 EXPANDING ELECTRIC VEHICLE INFRASTRUCTURE TO OFFER LUCRATIVE GROWTH OPPORTUNITIES
- 8.4 2.5-10 MVA
- 8.4.1 ABILITY TO MAINTAIN VOLTAGE STABILITY UNDER FLUCTUATING LOADS TO BOOST DEMAND
- 8.5 ABOVE 10 MVA
- 8.5.1 INTEGRATION WITH ADVANCED COOLING SYSTEMS AND REAL-TIME DIAGNOSTICS TO BOOST DEMAND
9 DISTRIBUTION TRANSFORMER MARKET, BY INSULATION
- 9.1 INTRODUCTION
- 9.2 OIL-IMMERSED
- 9.2.1 GROWING INTEGRATION WITH DIGITAL MONITORING SYSTEMS TO BOOST DEMAND
- 9.3 DRY
- 9.3.1 ONGOING ADVANCEMENTS IN EPOXY RESIN INSULATION AND ADVANCED COOLING TECHNIQUES TO FUEL MARKET GROWTH
10 DISTRIBUTION TRANSFORMER MARKET, BY END USER
- 10.1 INTRODUCTION
- 10.2 UTILITIES
- 10.2.1 INCREASING EMPHASIS ON INCORPORATING SMART GRID TECHNOLOGIES INTO EXISTING INFRASTRUCTURE TO FOSTER MARKET GROWTH
- 10.3 INDUSTRIAL
- 10.3.1 ADOPTION OF GREEN TECHNOLOGIES AND ECO-FRIENDLY PRACTICES TO FUEL MARKET GROWTH
- 10.4 RESIDENTIAL & COMMERCIAL
- 10.4.1 ADVANCEMENTS IN SMART GRID TECHNOLOGY TO DRIVE MARKET
11 DISTRIBUTION TRANSFORMER MARKET, BY REGION
- 11.1 INTRODUCTION
- 11.2 NORTH AMERICA
- 11.2.1 US
- 11.2.1.1 Emphasis on developing clean energy future to fuel market growth
- 11.2.2 CANADA
- 11.2.2.1 Increasing proportion of renewables in electricity mix to fuel market growth
- 11.2.3 MEXICO
- 11.2.3.1 Focus on modernizing national power grid to boost demand
- 11.2.1 US
- 11.3 EUROPE
- 11.3.1 GERMANY
- 11.3.1.1 Rising focus on adopting renewable energy sources and grid upgrades to support market growth
- 11.3.2 UK
- 11.3.2.1 Regulatory initiatives to deploy digitally intelligent distribution infrastructure to drive market
- 11.3.3 ITALY
- 11.3.3.1 Increasing cross-border power flow to boost demand
- 11.3.4 FRANCE
- 11.3.4.1 Integration of renewable energy into grids to offer lucrative opportunities
- 11.3.5 REST OF EUROPE
- 11.3.1 GERMANY
- 11.4 ASIA PACIFIC
- 11.4.1 CHINA
- 11.4.1.1 Deployment of ultra-high-voltage transmission lines, smart substations, and advanced metering infrastructure to fuel market growth
- 11.4.2 INDIA
- 11.4.2.1 Widespread grid expansion and increased interconnectivity to drive market
- 11.4.3 JAPAN
- 11.4.3.1 Emphasis on grid modernization and EV infrastructure development to offer lucrative growth opportunities
- 11.4.4 SOUTH KOREA
- 11.4.4.1 Decentralization of energy mix to drive market
- 11.4.5 REST OF ASIA PACIFIC
- 11.4.1 CHINA
- 11.5 MIDDLE EAST & AFRICA
- 11.5.1 GCC
- 11.5.1.1 Saudi Arabia
- 11.5.1.1.1 Rising commercial activity and increasing industrialization to drive market
- 11.5.1.2 UAE
- 11.5.1.2.1 Rapid economic development to support market growth
- 11.5.1.3 Rest of GCC
- 11.5.1.1 Saudi Arabia
- 11.5.2 SOUTH AFRICA
- 11.5.2.1 Presence of aging infrastructure to boost demand
- 11.5.3 NIGERIA
- 11.5.3.1 Growing investments in grid infrastructure to drive market
- 11.5.4 REST OF MIDDLE EAST & AFRICA
- 11.5.1 GCC
- 11.6 SOUTH AMERICA
- 11.6.1 BRAZIL
- 11.6.1.1 Increasing demand for electricity in residential, commercial, and industrial sectors to drive market
- 11.6.2 ARGENTINA
- 11.6.2.1 Expanding urban population and industrial sectors to foster market growth
- 11.6.3 REST OF SOUTH AMERICA
- 11.6.1 BRAZIL
12 COMPETITIVE LANDSCAPE
- 12.1 OVERVIEW
- 12.2 KEY PLAYER STRATEGIES/RIGHT TO WIN, 2021-2025
- 12.3 MARKET SHARE ANALYSIS, 2024
- 12.4 REVENUE ANALYSIS, 2020-2024
- 12.5 COMPANY EVALUATION MATRIX: KEY PLAYERS, 2024
- 12.5.1 STARS
- 12.5.2 PERVASIVE PLAYERS
- 12.5.3 EMERGING LEADERS
- 12.5.4 PARTICIPANTS
- 12.5.5 COMPANY FOOTPRINT: KEY PLAYERS, 2024
- 12.5.5.1 Company footprint
- 12.5.5.2 Region footprint
- 12.5.5.3 Mounting footprint
- 12.5.5.4 Insulation footprint
- 12.5.5.5 Phase footprint
- 12.5.5.6 Power rating footprint
- 12.6 COMPANY EVALUATION MATRIX: STARTUPS/SMES, 2024
- 12.6.1 PROGRESSIVE COMPANIES
- 12.6.2 RESPONSIVE COMPANIES
- 12.6.3 DYNAMIC COMPANIES
- 12.6.4 STARTING BLOCKS
- 12.6.5 COMPETITIVE BENCHMARKING: STARTUPS/SMES, 2024
- 12.6.5.1 List of startups/SMEs
- 12.6.5.2 Competitive benchmarking of key startups/SMEs
- 12.7 COMPANY VALUATION AND FINANCIAL METRICS, 2024
- 12.8 BRAND/PRODUCT COMPARISON
- 12.9 COMPETITIVE SCENARIO
- 12.9.1 PRODUCT LAUNCHES
- 12.9.2 DEALS
- 12.9.3 OTHER DEVELOPMENTS
13 COMPANY PROFILES
- 13.1 KEY PLAYERS
- 13.1.1 HITACHI ENERGY LTD
- 13.1.1.1 Business overview
- 13.1.1.2 Products offered
- 13.1.1.3 Recent developments
- 13.1.1.3.1 Deals
- 13.1.1.3.2 Other developments
- 13.1.1.4 MnM view
- 13.1.1.4.1 Key strengths/Right to win
- 13.1.1.4.2 Strategic choices
- 13.1.1.4.3 Weaknesses/Competitive threats
- 13.1.2 EATON
- 13.1.2.1 Business overview
- 13.1.2.2 Products offered
- 13.1.2.3 Recent developments
- 13.1.2.3.1 Deals
- 13.1.2.3.2 Other developments
- 13.1.2.4 MnM view
- 13.1.2.4.1 Key strengths/Right to win
- 13.1.2.4.2 Strategic choices
- 13.1.2.4.3 Weaknesses/Competitive threats
- 13.1.3 SCHNEIDER ELECTRIC
- 13.1.3.1 Business overview
- 13.1.3.2 Products offered
- 13.1.3.3 Recent developments
- 13.1.3.3.1 Product launches
- 13.1.3.3.2 Deals
- 13.1.3.3.3 Expansions
- 13.1.3.3.4 Other developments
- 13.1.3.4 MnM view
- 13.1.3.4.1 Key strengths/Right to win
- 13.1.3.4.2 Strategic choices
- 13.1.3.4.3 Weaknesses/Competitive threats
- 13.1.4 SIEMENS ENERGY
- 13.1.4.1 Business overview
- 13.1.4.2 Products offered
- 13.1.4.3 Recent developments
- 13.1.4.3.1 Deals
- 13.1.4.3.2 Other developments
- 13.1.4.4 MnM view
- 13.1.4.4.1 Key strengths/Right to win
- 13.1.4.4.2 Strategic choices
- 13.1.4.4.3 Weaknesses/Competitive threats
- 13.1.5 TOSHIBA ENERGY SYSTEMS & SOLUTIONS CORPORATION
- 13.1.5.1 Business overview
- 13.1.5.2 Products offered
- 13.1.5.3 Recent developments
- 13.1.5.3.1 Deals
- 13.1.5.3.2 Other developments
- 13.1.5.4 MnM view
- 13.1.5.4.1 Key strengths/Right to win
- 13.1.5.4.2 Strategic choices
- 13.1.5.4.3 Weaknesses/Competitive threats
- 13.1.6 CG POWER & INDUSTRIAL SOLUTIONS LTD.
- 13.1.6.1 Business overview
- 13.1.6.2 Products offered
- 13.1.6.3 Recent developments
- 13.1.6.3.1 Developments
- 13.1.7 GE VERNOVA
- 13.1.7.1 Business overview
- 13.1.7.2 Products offered
- 13.1.7.2.1 Developments
- 13.1.8 ORMAZABAL
- 13.1.8.1 Business overview
- 13.1.8.2 Products offered
- 13.1.9 TRANSFORMERS AND RECTIFIERS INDIA LTD
- 13.1.9.1 Business overview
- 13.1.9.2 Products offered
- 13.1.9.3 Recent Developments
- 13.1.9.3.1 Developments
- 13.1.10 WILSON POWER SOLUTIONS LTD
- 13.1.10.1 Business overview
- 13.1.10.2 Products offered
- 13.1.10.3 Recent developments
- 13.1.10.3.1 Product launches
- 13.1.11 LEMI TRAFO TRANSFORMERS
- 13.1.11.1 Business overview
- 13.1.11.2 Products offered
- 13.1.12 HYOSUNG HEAVY INDUSTRIES
- 13.1.12.1 Business overview
- 13.1.12.2 Products offered
- 13.1.12.3 Recent developments
- 13.1.12.3.1 Developments
- 13.1.13 CELME
- 13.1.13.1 Business overview
- 13.1.13.2 Products offered
- 13.1.14 EMERSON ELECTRIC CO.
- 13.1.14.1 Business overview
- 13.1.14.2 Products offered
- 13.1.15 JST POWER EQUIPMENT
- 13.1.15.1 Business overview
- 13.1.15.2 Products offered
- 13.1.16 HAMMOND POWER SOLUTIONS
- 13.1.16.1 Business overview
- 13.1.16.2 Products offered
- 13.1.16.3 Recent developments
- 13.1.16.3.1 Product launches
- 13.1.16.3.2 Deals
- 13.1.17 VANTRAN INDUSTRIES, INC.
- 13.1.17.1 Business overview
- 13.1.17.2 Products offered
- 13.1.18 RAYCHEM RPG PRIVATE LIMITED
- 13.1.18.1 Business overview
- 13.1.18.2 Products offered
- 13.1.19 SERVOKON
- 13.1.19.1 Business overview
- 13.1.19.2 Products offered
- 13.1.19.3 Recent developments
- 13.1.19.3.1 Developments
- 13.1.20 EFACEC
- 13.1.20.1 Business overview
- 13.1.20.2 Products offered
- 13.1.20.3 Recent developments
- 13.1.20.3.1 Developments
- 13.1.21 KOTSONS GLOBAL
- 13.1.21.1 Business overview
- 13.1.21.2 Products offered
- 13.1.22 HD HYUNDAI ELECTRIC CO., LTD.
- 13.1.22.1 Business overview
- 13.1.22.2 Products offered
- 13.1.1 HITACHI ENERGY LTD
- 13.2 OTHER PLAYERS
- 13.2.1 VIJAY POWER
- 13.2.2 VOLTAMP TRANSFORMER
- 13.2.3 GTB
14 APPENDIX
- 14.1 INSIGHTS FROM INDUSTRY EXPERTS
- 14.2 DISCUSSION GUIDE
- 14.3 KNOWLEDGESTORE: MARKETSANDMARKETS' SUBSCRIPTION PORTAL
- 14.4 CUSTOMIZATION OPTIONS
- 14.5 RELATED REPORTS
- 14.6 AUTHOR DETAILS
List of Tables
- TABLE 1 BY MOUNTING
- TABLE 2 BY PHASE
- TABLE 3 BY POWER RATING
- TABLE 4 BY INSULATION
- TABLE 5 BY END USER
- TABLE 6 BY REGION
- TABLE 7 DISTRIBUTION TRANSFORMER MARKET SNAPSHOT
- TABLE 8 ROLES OF COMPANIES IN DISTRIBUTION TRANSFORMER ECOSYSTEM
- TABLE 9 PRICING RANGE OF DISTRIBUTION TRANSFORMERS, BY POWER RATING, 2024 (USD/UNIT)
- TABLE 10 DISTRIBUTION TRANSFORMER MARKET: KEY CONFERENCES AND EVENTS, 2025-2026
- TABLE 11 IMPORT TARIFF FOR HS CODE 8504-COMPLIANT PRODUCTS, 2024
- TABLE 12 NORTH AMERICA: LIST OF REGULATORY BODIES, GOVERNMENT AGENCIES, AND OTHER ORGANIZATIONS
- TABLE 13 EUROPE: LIST OF REGULATORY BODIES, GOVERNMENT AGENCIES, AND OTHER ORGANIZATIONS
- TABLE 14 ASIA PACIFIC: LIST OF REGULATORY BODIES, GOVERNMENT AGENCIES, AND OTHER ORGANIZATIONS
- TABLE 15 ROW: LIST OF REGULATORY BODIES, GOVERNMENT AGENCIES, AND OTHER ORGANIZATIONS
- TABLE 16 DISTRIBUTION TRANSFORMER MARKET: REGULATIONS
- TABLE 17 IMPORT DATA FOR HS CODE 8504-COMPLIANT PRODUCTS, BY COUNTRY, 2020-2024 (USD THOUSAND)
- TABLE 18 EXPORT DATA FOR HS CODE 8504-COMPLIANT PRODUCTS, BY COUNTRY, 2020-2024 (USD THOUSAND)
- TABLE 19 DISTRIBUTION TRANSFORMER MARKET: PATENT REGISTRATIONS, 2013-2025
- TABLE 20 DISTRIBUTION TRANSFORMER MARKET: PORTER'S FIVE FORCES ANALYSIS
- TABLE 21 INFLUENCE OF KEY STAKEHOLDERS IN BUYING PROCESS FOR TOP THREE END USERS (%)
- TABLE 22 KEY BUYING CRITERIA FOR TOP THREE END USERS
- TABLE 23 US-ADJUSTED RECIPROCAL TARIFF RATES
- TABLE 24 EXPECTED CHANGE IN PRICES AND LIKELY IMPACT ON END USE MARKET DUE TO TARIFF IMPACT
- TABLE 25 DISTRIBUTION TRANSFORMER MARKET, BY MOUNTING, 2020-2024 (USD MILLION)
- TABLE 26 DISTRIBUTION TRANSFORMER MARKET, BY MOUNTING, 2025-2030 (USD MILLION)
- TABLE 27 PAD: DISTRIBUTION TRANSFORMER MARKET, BY REGION, 2020-2024 (USD MILLION)
- TABLE 28 PAD: DISTRIBUTION TRANSFORMER MARKET, BY REGION, 2025-2030 (USD MILLION)
- TABLE 29 POLE: DISTRIBUTION TRANSFORMER MARKET, BY REGION, 2020-2024 (USD MILLION)
- TABLE 30 POLE: DISTRIBUTION TRANSFORMER MARKET, BY REGION, 2025-2030 (USD MILLION)
- TABLE 31 UNDERGROUND: DISTRIBUTION TRANSFORMER MARKET, BY REGION, 2020-2024 (USD MILLION)
- TABLE 32 UNDERGROUND: DISTRIBUTION TRANSFORMER MARKET, BY REGION, 2025-2030 (USD MILLION)
- TABLE 33 DISTRIBUTION TRANSFORMER MARKET, BY PHASE, 2020-2024 (USD MILLION)
- TABLE 34 DISTRIBUTION TRANSFORMER MARKET, BY PHASE, 2025-2030 (USD MILLION)
- TABLE 35 THREE: DISTRIBUTION TRANSFORMER MARKET, BY REGION, 2020-2024 (USD MILLION)
- TABLE 36 THREE: DISTRIBUTION TRANSFORMER MARKET, BY REGION, 2025-2030 (USD MILLION)
- TABLE 37 SINGLE: DISTRIBUTION TRANSFORMER MARKET, BY REGION, 2020-2024 (USD MILLION)
- TABLE 38 SINGLE: DISTRIBUTION TRANSFORMER MARKET, BY REGION, 2025-2030 (USD MILLION)
- TABLE 39 DISTRIBUTION TRANSFORMER MARKET, BY POWER RATING, 2020-2024 (USD MILLION)
- TABLE 40 DISTRIBUTION TRANSFORMER MARKET, BY POWER RATING, 2025-2030 (USD MILLION)
- TABLE 41 UP TO 0.5 MVA: DISTRIBUTION TRANSFORMER MARKET, BY REGION, 2020-2024 (USD MILLION)
- TABLE 42 UP TO 0.5 MVA: DISTRIBUTION TRANSFORMER MARKET, BY REGION, 2025-2030 (USD MILLION)
- TABLE 43 0.5-2.5 MVA: DISTRIBUTION TRANSFORMER MARKET, BY REGION, 2020-2024 (USD MILLION)
- TABLE 44 0.5-2.5 MVA: DISTRIBUTION TRANSFORMER MARKET, BY REGION, 2025-2030 (USD MILLION)
- TABLE 45 2.5-10 MVA: DISTRIBUTION TRANSFORMER MARKET, BY REGION, 2020-2024 (USD MILLION)
- TABLE 46 2.5-10 MVA: DISTRIBUTION TRANSFORMER MARKET, BY REGION, 2025-2030 (USD MILLION)
- TABLE 47 ABOVE 10 MVA: DISTRIBUTION TRANSFORMER MARKET, BY REGION, 2020-2024 (USD MILLION)
- TABLE 48 ABOVE 10 MVA: DISTRIBUTION TRANSFORMER MARKET, BY REGION, 2025-2030 (USD MILLION)
- TABLE 49 DISTRIBUTION TRANSFORMER MARKET, BY INSULATION, 2020-2024 (USD MILLION)
- TABLE 50 DISTRIBUTION TRANSFORMER MARKET, BY INSULATION, 2025-2030 (USD MILLION)
- TABLE 51 OIL-IMMERSED: DISTRIBUTION TRANSFORMER MARKET, BY REGION, 2020-2024 (USD MILLION)
- TABLE 52 OIL-IMMERSED: DISTRIBUTION TRANSFORMER MARKET, BY REGION, 2025-2030 (USD MILLION)
- TABLE 53 DRY: DISTRIBUTION TRANSFORMER MARKET, BY REGION, 2020-2024 (USD MILLION)
- TABLE 54 DRY: DISTRIBUTION TRANSFORMER MARKET, BY REGION, 2025-2030 (USD MILLION)
- TABLE 55 DISTRIBUTION TRANSFORMER MARKET, BY END USER, 2020-2024 (USD MILLION)
- TABLE 56 DISTRIBUTION TRANSFORMER MARKET, BY END USER, 2025-2030 (USD MILLION)
- TABLE 57 UTILITIES: DISTRIBUTION TRANSFORMER MARKET, BY REGION, 2020-2024 (USD MILLION)
- TABLE 58 UTILITIES: DISTRIBUTION TRANSFORMER MARKET, BY REGION, 2025-2030 (USD MILLION)
- TABLE 59 INDUSTRIAL: DISTRIBUTION TRANSFORMER MARKET, BY REGION, 2020-2024 (USD MILLION)
- TABLE 60 INDUSTRIAL: DISTRIBUTION TRANSFORMER MARKET, BY REGION, 2025-2030 (USD MILLION)
- TABLE 61 RESIDENTIAL & COMMERCIAL: DISTRIBUTION TRANSFORMER MARKET, BY REGION, 2020-2024 (USD MILLION)
- TABLE 62 RESIDENTIAL & COMMERCIAL: DISTRIBUTION TRANSFORMER MARKET, BY REGION, 2025-2030 (USD MILLION)
- TABLE 63 DISTRIBUTION TRANSFORMER MARKET, BY REGION, 2020-2024 (USD MILLION)
- TABLE 64 DISTRIBUTION TRANSFORMER MARKET, BY REGION, 2025-2030 (USD MILLION)
- TABLE 65 DISTRIBUTION TRANSFORMER MARKET, BY REGION, 2020-2024 (UNIT)
- TABLE 66 DISTRIBUTION TRANSFORMER MARKET, BY REGION, 2025-2030 (UNIT)
- TABLE 67 NORTH AMERICA: DISTRIBUTION TRANSFORMER MARKET, BY MOUNTING, 2020-2024 (USD MILLION)
- TABLE 68 NORTH AMERICA: DISTRIBUTION TRANSFORMER MARKET, BY MOUNTING, 2025-2030 (USD MILLION)
- TABLE 69 NORTH AMERICA: DISTRIBUTION TRANSFORMER MARKET, BY POWER RATING, 2020-2024 (USD MILLION)
- TABLE 70 NORTH AMERICA: DISTRIBUTION TRANSFORMER MARKET, BY POWER RATING, 2025-2030 (USD MILLION)
- TABLE 71 NORTH AMERICA: DISTRIBUTION TRANSFORMER MARKET, BY PHASE, 2020-2024 (USD MILLION)
- TABLE 72 NORTH AMERICA: DISTRIBUTION TRANSFORMER MARKET, BY PHASE, 2025-2030 (USD MILLION)
- TABLE 73 NORTH AMERICA: DISTRIBUTION TRANSFORMER MARKET, BY END USER, 2020-2024 (USD MILLION)
- TABLE 74 NORTH AMERICA: DISTRIBUTION TRANSFORMER MARKET, END USER, 2025-2030 (USD MILLION)
- TABLE 75 NORTH AMERICA: DISTRIBUTION TRANSFORMER MARKET, BY INSULATION, 2020-2024 (USD MILLION)
- TABLE 76 NORTH AMERICA: DISTRIBUTION TRANSFORMER MARKET, BY INSULATION, 2025-2030 (USD MILLION)
- TABLE 77 NORTH AMERICA: DISTRIBUTION TRANSFORMER MARKET, BY COUNTRY, 2020-2024 (USD MILLION)
- TABLE 78 NORTH AMERICA: DISTRIBUTION TRANSFORMER MARKET, BY COUNTRY, 2025-2030 (USD MILLION)
- TABLE 79 US: DISTRIBUTION TRANSFORMER MARKET, BY POWER RATING, 2020-2024 (USD MILLION)
- TABLE 80 US: DISTRIBUTION TRANSFORMER MARKET, BY POWER RATING, 2025-2030 (USD MILLION)
- TABLE 81 CANADA: DISTRIBUTION TRANSFORMER MARKET, BY POWER RATING, 2020-2024 (USD MILLION)
- TABLE 82 CANADA: DISTRIBUTION TRANSFORMER MARKET, BY POWER RATING, 2025-2030 (USD MILLION)
- TABLE 83 MEXICO: DISTRIBUTION TRANSFORMER MARKET, BY POWER RATING, 2020-2024 (USD MILLION)
- TABLE 84 MEXICO: DISTRIBUTION TRANSFORMER MARKET, BY POWER RATING, 2025-2030 (USD MILLION)
- TABLE 85 EUROPE: DISTRIBUTION TRANSFORMER MARKET, BY MOUNTING, 2020-2024 (USD MILLION)
- TABLE 86 EUROPE: DISTRIBUTION TRANSFORMER MARKET, BY MOUNTING, 2025-2030 (USD MILLION)
- TABLE 87 EUROPE: DISTRIBUTION TRANSFORMER MARKET, BY POWER RATING, 2020-2024 (USD MILLION)
- TABLE 88 EUROPE: DISTRIBUTION TRANSFORMER MARKET, BY POWER RATING, 2025-2030 (USD MILLION)
- TABLE 89 EUROPE: DISTRIBUTION TRANSFORMER MARKET, BY PHASE, 2020-2024 (USD MILLION)
- TABLE 90 EUROPE: DISTRIBUTION TRANSFORMER MARKET, BY PHASE, 2025-2030 (USD MILLION)
- TABLE 91 EUROPE: DISTRIBUTION TRANSFORMER MARKET, BY END USER, 2020-2024 (USD MILLION)
- TABLE 92 EUROPE: DISTRIBUTION TRANSFORMER MARKET, END USER, 2025-2030 (USD MILLION)
- TABLE 93 EUROPE: DISTRIBUTION TRANSFORMER MARKET, BY INSULATION, 2020-2024 (USD MILLION)
- TABLE 94 EUROPE: DISTRIBUTION TRANSFORMER MARKET, BY INSULATION, 2025-2030 (USD MILLION)
- TABLE 95 EUROPE: DISTRIBUTION TRANSFORMER MARKET, BY COUNTRY, 2020-2024 (USD MILLION)
- TABLE 96 EUROPE: DISTRIBUTION TRANSFORMER MARKET, BY COUNTRY, 2025-2030 (USD MILLION)
- TABLE 97 GERMANY: DISTRIBUTION TRANSFORMER MARKET, BY POWER RATING, 2020-2024 (USD MILLION)
- TABLE 98 GERMANY: DISTRIBUTION TRANSFORMER MARKET, BY POWER RATING, 2025-2030 (USD MILLION)
- TABLE 99 UK: DISTRIBUTION TRANSFORMER MARKET, BY POWER RATING, 2020-2024 (USD MILLION)
- TABLE 100 UK: DISTRIBUTION TRANSFORMER MARKET, BY POWER RATING, 2025-2030 (USD MILLION)
- TABLE 101 ITALY: DISTRIBUTION TRANSFORMER MARKET, BY POWER RATING, 2020-2024 (USD MILLION)
- TABLE 102 ITALY: DISTRIBUTION TRANSFORMER MARKET, BY POWER RATING, 2025-2030 (USD MILLION)
- TABLE 103 FRANCE: DISTRIBUTION TRANSFORMER MARKET, BY POWER RATING, 2020-2024 (USD MILLION)
- TABLE 104 FRANCE: DISTRIBUTION TRANSFORMER MARKET, BY POWER RATING, 2025-2030 (USD MILLION)
- TABLE 105 REST OF EUROPE: DISTRIBUTION TRANSFORMER MARKET, BY POWER RATING, 2020-2024 (USD MILLION)
- TABLE 106 REST OF EUROPE: DISTRIBUTION TRANSFORMER MARKET, BY POWER RATING, 2025-2030 (USD MILLION)
- TABLE 107 ASIA PACIFIC: DISTRIBUTION TRANSFORMER MARKET, BY MOUNTING, 2020-2024 (USD MILLION)
- TABLE 108 ASIA PACIFIC: DISTRIBUTION TRANSFORMER MARKET, BY MOUNTING, 2025-2030 (USD MILLION)
- TABLE 109 ASIA PACIFIC: DISTRIBUTION TRANSFORMER MARKET, BY POWER RATING, 2020-2024 (USD MILLION)
- TABLE 110 ASIA PACIFIC: DISTRIBUTION TRANSFORMER MARKET, BY POWER RATING, 2025-2030 (USD MILLION)
- TABLE 111 ASIA PACIFIC: DISTRIBUTION TRANSFORMER MARKET, BY PHASE, 2020-2024 (USD MILLION)
- TABLE 112 ASIA PACIFIC: DISTRIBUTION TRANSFORMER MARKET, BY PHASE, 2025-2030 (USD MILLION)
- TABLE 113 ASIA PACIFIC: DISTRIBUTION TRANSFORMER MARKET, BY END USER, 2020-2024 (USD MILLION)
- TABLE 114 ASIA PACIFIC: DISTRIBUTION TRANSFORMER MARKET, END USER, 2025-2030 (USD MILLION)
- TABLE 115 ASIA PACIFIC: DISTRIBUTION TRANSFORMER MARKET, BY INSULATION, 2020-2024 (USD MILLION)
- TABLE 116 ASIA PACIFIC: DISTRIBUTION TRANSFORMER MARKET, BY INSULATION, 2025-2030 (USD MILLION)
- TABLE 117 ASIA PACIFIC: DISTRIBUTION TRANSFORMER MARKET, BY COUNTRY, 2020-2024 (USD MILLION)
- TABLE 118 ASIA PACIFIC: DISTRIBUTION TRANSFORMER MARKET, BY COUNTRY, 2025-2030 (USD MILLION)
- TABLE 119 CHINA: DISTRIBUTION TRANSFORMER MARKET, BY POWER RATING, 2020-2024 (USD MILLION)
- TABLE 120 CHINA: DISTRIBUTION TRANSFORMER MARKET, BY POWER RATING, 2025-2030 (USD MILLION)
- TABLE 121 INDIA: DISTRIBUTION TRANSFORMER MARKET, BY POWER RATING, 2020-2024 (USD MILLION)
- TABLE 122 INDIA: DISTRIBUTION TRANSFORMER MARKET, BY POWER RATING, 2025-2030 (USD MILLION)
- TABLE 123 JAPAN: DISTRIBUTION TRANSFORMER MARKET, BY POWER RATING, 2020-2024 (USD MILLION)
- TABLE 124 JAPAN: DISTRIBUTION TRANSFORMER MARKET, BY POWER RATING, 2025-2030 (USD MILLION)
- TABLE 125 SOUTH KOREA: DISTRIBUTION TRANSFORMER MARKET, BY POWER RATING, 2020-2024 (USD MILLION)
- TABLE 126 SOUTH KOREA: DISTRIBUTION TRANSFORMER MARKET, BY POWER RATING, 2025-2030 (USD MILLION)
- TABLE 127 REST OF ASIA PACIFIC: DISTRIBUTION TRANSFORMER MARKET, BY POWER RATING, 2020-2024 (USD MILLION)
- TABLE 128 REST OF ASIA PACIFIC: DISTRIBUTION TRANSFORMER MARKET, BY POWER RATING, 2025-2030 (USD MILLION)
- TABLE 129 MIDDLE EAST & AFRICA: DISTRIBUTION TRANSFORMER MARKET, BY MOUNTING, 2020-2024 (USD MILLION)
- TABLE 130 MIDDLE EAST & AFRICA: DISTRIBUTION TRANSFORMER MARKET, BY MOUNTING, 2025-2030 (USD MILLION)
- TABLE 131 MIDDLE EAST & AFRICA: DISTRIBUTION TRANSFORMER MARKET, BY POWER RATING, 2020-2024 (USD MILLION)
- TABLE 132 MIDDLE EAST & AFRICA: DISTRIBUTION TRANSFORMER MARKET, BY POWER RATING, 2025-2030 (USD MILLION)
- TABLE 133 MIDDLE EAST & AFRICA: DISTRIBUTION TRANSFORMER MARKET, BY PHASE, 2020-2024 (USD MILLION)
- TABLE 134 MIDDLE EAST & AFRICA: DISTRIBUTION TRANSFORMER MARKET, BY PHASE, 2025-2030 (USD MILLION)
- TABLE 135 MIDDLE EAST & AFRICA: DISTRIBUTION TRANSFORMER MARKET, BY END USER, 2020-2024 (USD MILLION)
- TABLE 136 MIDDLE EAST & AFRICA: DISTRIBUTION TRANSFORMER MARKET, END USER, 2025-2030 (USD MILLION)
- TABLE 137 MIDDLE EAST & AFRICA: DISTRIBUTION TRANSFORMER MARKET, BY INSULATION, 2020-2024 (USD MILLION)
- TABLE 138 MIDDLE EAST & AFRICA: DISTRIBUTION TRANSFORMER MARKET, BY INSULATION, 2025-2030 (USD MILLION)
- TABLE 139 GCC: DISTRIBUTION TRANSFORMER MARKET, BY COUNTRY, 2020-2024 (USD MILLION)
- TABLE 140 GCC: DISTRIBUTION TRANSFORMER MARKET, BY COUNTRY, 2025-2030 (USD MILLION)
- TABLE 141 MIDDLE EAST & AFRICA: DISTRIBUTION TRANSFORMER MARKET, BY COUNTRY, 2020-2024 (USD MILLION)
- TABLE 142 MIDDLE EAST & AFRICA: DISTRIBUTION TRANSFORMER MARKET, BY COUNTRY, 2025-2030 (USD MILLION)
- TABLE 143 GCC: DISTRIBUTION TRANSFORMER MARKET, BY POWER RATING, 2020-2024 (USD MILLION)
- TABLE 144 GCC: DISTRIBUTION TRANSFORMER MARKET, BY POWER RATING, 2025-2030 (USD MILLION)
- TABLE 145 SAUDI ARABIA: DISTRIBUTION TRANSFORMER MARKET, BY POWER RATING, 2020-2024 (USD MILLION)
- TABLE 146 SAUDI ARABIA: DISTRIBUTION TRANSFORMER MARKET, BY POWER RATING, 2025-2030 (USD MILLION)
- TABLE 147 UAE: DISTRIBUTION TRANSFORMER MARKET, BY POWER RATING, 2020-2024 (USD MILLION)
- TABLE 148 UAE: DISTRIBUTION TRANSFORMER MARKET, BY POWER RATING, 2025-2030 (USD MILLION)
- TABLE 149 REST OF GCC: DISTRIBUTION TRANSFORMER MARKET, BY POWER RATING, 2020-2024 (USD MILLION)
- TABLE 150 REST OF GCC: DISTRIBUTION TRANSFORMER MARKET, BY POWER RATING, 2025-2030 (USD MILLION)
- TABLE 151 SOUTH AFRICA: DISTRIBUTION TRANSFORMER MARKET, BY POWER RATING, 2020-2024 (USD MILLION)
- TABLE 152 SOUTH AFRICA: DISTRIBUTION TRANSFORMER MARKET, BY POWER RATING, 2025-2030 (USD MILLION)
- TABLE 153 NIGERIA: DISTRIBUTION TRANSFORMER MARKET, BY POWER RATING, 2020-2024 (USD MILLION)
- TABLE 154 NIGERIA: DISTRIBUTION TRANSFORMER MARKET, BY POWER RATING, 2025-2030 (USD MILLION)
- TABLE 155 REST OF MIDDLE EAST & AFRICA: DISTRIBUTION TRANSFORMER MARKET, BY POWER RATING, 2020-2024 (USD MILLION)
- TABLE 156 REST OF MIDDLE EAST & AFRICA: DISTRIBUTION TRANSFORMER MARKET, BY POWER RATING, 2025-2030 (USD MILLION)
- TABLE 157 SOUTH AMERICA: DISTRIBUTION TRANSFORMER MARKET, BY MOUNTING, 2020-2024 (USD MILLION)
- TABLE 158 SOUTH AMERICA: DISTRIBUTION TRANSFORMER MARKET, BY MOUNTING, 2025-2030 (USD MILLION)
- TABLE 159 SOUTH AMERICA: DISTRIBUTION TRANSFORMER MARKET, BY POWER RATING, 2020-2024 (USD MILLION)
- TABLE 160 SOUTH AMERICA: DISTRIBUTION TRANSFORMER MARKET, BY POWER RATING, 2025-2030 (USD MILLION)
- TABLE 161 SOUTH AMERICA: DISTRIBUTION TRANSFORMER MARKET, BY PHASE, 2020-2024 (USD MILLION)
- TABLE 162 SOUTH AMERICA: DISTRIBUTION TRANSFORMER MARKET, BY PHASE, 2025-2030 (USD MILLION)
- TABLE 163 SOUTH AMERICA: DISTRIBUTION TRANSFORMER MARKET, BY END USER, 2020-2024 (USD MILLION)
- TABLE 164 SOUTH AMERICA: DISTRIBUTION TRANSFORMER MARKET, END USER, 2025-2030 (USD MILLION)
- TABLE 165 SOUTH AMERICA: DISTRIBUTION TRANSFORMER MARKET, BY INSULATION, 2020-2024 (USD MILLION)
- TABLE 166 SOUTH AMERICA: DISTRIBUTION TRANSFORMER MARKET, BY INSULATION, 2025-2030 (USD MILLION)
- TABLE 167 SOUTH AMERICA: DISTRIBUTION TRANSFORMER MARKET, BY COUNTRY, 2020-2024 (USD MILLION)
- TABLE 168 SOUTH AMERICA: DISTRIBUTION TRANSFORMER MARKET, BY COUNTRY, 2025-2030 (USD MILLION)
- TABLE 169 BRAZIL: DISTRIBUTION TRANSFORMER MARKET, BY POWER RATING, 2020-2024 (USD MILLION)
- TABLE 170 BRAZIL: DISTRIBUTION TRANSFORMER MARKET, BY POWER RATING, 2025-2030 (USD MILLION)
- TABLE 171 ARGENTINA: DISTRIBUTION TRANSFORMER MARKET, BY POWER RATING, 2020-2024 (USD MILLION)
- TABLE 172 ARGENTINA: DISTRIBUTION TRANSFORMER MARKET, BY POWER RATING, 2025-2030 (USD MILLION)
- TABLE 173 REST OF SOUTH AMERICA: DISTRIBUTION TRANSFORMER MARKET, BY POWER RATING, 2020-2024 (USD MILLION)
- TABLE 174 REST OF SOUTH AMERICA: DISTRIBUTION TRANSFORMER MARKET, BY POWER RATING, 2025-2030 (USD MILLION)
- TABLE 175 DISTRIBUTION TRANSFORMER MARKET: OVERVIEW OF KEY STRATEGIES ADOPTED BY KEY PLAYERS, JANUARY 2021-JUNE 2024
- TABLE 176 DISTRIBUTION TRANSFORMER MARKET: DEGREE OF COMPETITION, 2024
- TABLE 177 DISTRIBUTION TRANSFORMER MARKET: REGION FOOTPRINT
- TABLE 178 DISTRIBUTION TRANSFORMER MARKET: MOUNTING FOOTPRINT
- TABLE 179 DISTRIBUTION TRANSFORMER MARKET: INSULATION FOOTPRINT
- TABLE 180 DISTRIBUTION TRANSFORMER MARKET: PHASE FOOTPRINT
- TABLE 181 DISTRIBUTION TRANSFORMER MARKET: POWER RATING FOOTPRINT
- TABLE 182 DISTRIBUTION TRANSFORMER MARKET: LIST OF KEY STARTUPS/SMES
- TABLE 183 DISTRIBUTION TRANSFORMER MARKET: COMPETITIVE BENCHMARKING OF STARTUPS/SMES
- TABLE 184 DISTRIBUTION TRANSFORMER MARKET: PRODUCT LAUNCHES, JANUARY 2021-JUNE 2025
- TABLE 185 DISTRIBUTION TRANSFORMER MARKET: DEALS, JANUARY 2021-JUNE 2025
- TABLE 186 DISTRIBUTION TRANSFORMER MARKET: OTHER DEVELOPMENTS, JANUARY 2021-JUNE 2025
- TABLE 187 HITACHI ENERGY LTD: COMPANY OVERVIEW
- TABLE 188 HITACHI ENERGY LTD: PRODUCTS OFFERED
- TABLE 189 HITACHI ENERGY LTD: DEALS
- TABLE 190 HITACHI ENERGY: OTHER DEVELOPMENTS
- TABLE 191 EATON: COMPANY OVERVIEW
- TABLE 192 EATON: PRODUCTS OFFERED
- TABLE 193 EATON: DEALS
- TABLE 194 EATON: OTHER DEVELOPMENTS
- TABLE 195 SCHNEIDER ELECTRIC: COMPANY OVERVIEW
- TABLE 196 SCHNEIDER ELECTRIC: PRODUCTS OFFERED
- TABLE 197 SCHNEIDER ELECTRIC: PRODUCT LAUNCHES
- TABLE 198 SCHNEIDER ELECTRIC: DEALS
- TABLE 199 SCHNEIDER ELECTRIC: EXPANSIONS
- TABLE 200 SCHNEIDER ELECTRIC: OTHER DEVELOPMENTS
- TABLE 201 SIEMENS ENERGY: COMPANY OVERVIEW
- TABLE 202 SIEMENS ENERGY: PRODUCTS OFFERED
- TABLE 203 SIEMENS ENERGY: DEALS
- TABLE 204 SIEMENS ENERGY: OTHER DEVELOPMENTS
- TABLE 205 TOSHIBA ENERGY SYSTEMS & SOLUTIONS CORPORATION: COMPANY OVERVIEW
- TABLE 206 TOSHIBA ENERGY SYSTEMS & SOLUTIONS CORPORATION: PRODUCTS OFFERED
- TABLE 207 TOSHIBA ENERGY SYSTEMS & SOLUTIONS CORPORATION: DEALS
- TABLE 208 TOSHIBA ENERGY SYSTEMS & SOLUTIONS CORPORATION: OTHER DEVELOPMENTS
- TABLE 209 CG POWER & INDUSTRIAL SOLUTIONS LTD.: COMPANY OVERVIEW
- TABLE 210 CG POWER & INDUSTRIAL SOLUTIONS LTD.: PRODUCTS OFFERED
- TABLE 211 CG POWER & INDUSTRIAL SOLUTIONS LTD.: DEVELOPMENTS
- TABLE 212 GE VERNOVA: COMPANY OVERVIEW
- TABLE 213 GE VERNOVA: PRODUCTS OFFERED
- TABLE 214 GE VERNOVA: DEVELOPMENTS
- TABLE 215 ORMAZABAL: COMPANY OVERVIEW
- TABLE 216 ORMAZABAL: PRODUCTS OFFERED
- TABLE 217 TRANSFORMERS AND RECTIFIERS INDIA LTD.: COMPANY OVERVIEW
- TABLE 218 TRANSFORMERS AND RECTIFIERS INDIA LTD: PRODUCTS OFFERED
- TABLE 219 TRANSFORMERS AND RECTIFIERS INDIA LTD: DEVELOPMENTS
- TABLE 220 WILSON POWER SOLUTIONS LTD: COMPANY OVERVIEW
- TABLE 221 WILSON POWER SOLUTIONS LTD: PRODUCTS OFFERED
- TABLE 222 WILSON POWER SOLUTIONS LTD: PRODUCT LAUNCHES
- TABLE 223 LEMI TRAFO TRANSFORMERS: COMPANY OVERVIEW
- TABLE 224 LEMI TRAFO TRANSFORMERS: PRODUCTS OFFERED
- TABLE 225 HYOSUNG HEAVY INDUSTRIES: COMPANY OVERVIEW
- TABLE 226 HYOSUNG HEAVY INDUSTRIES: PRODUCTS OFFERED
- TABLE 227 HYOSUNG HEAVY INDUSTRIES: DEVELOPMENTS
- TABLE 228 CELME: COMPANY OVERVIEW
- TABLE 229 CELME: PRODUCTS OFFERED
- TABLE 230 EMERSON ELECTRIC CO.: COMPANY OVERVIEW
- TABLE 231 EMERSON ELECTRIC CO.: PRODUCTS OFFERED
- TABLE 232 JST POWER EQUIPMENT: COMPANY OVERVIEW
- TABLE 233 JST POWER EQUIPMENT: PRODUCTS OFFERED
- TABLE 234 HAMMOND POWER SOLUTIONS: COMPANY OVERVIEW
- TABLE 235 HAMMOND POWER SOLUTIONS: PRODUCTS OFFERED
- TABLE 236 HAMMOND POWER SOLUTIONS: PRODUCT LAUNCHES
- TABLE 237 HAMMOND POWER SOLUTIONS: DEALS
- TABLE 238 VANTRAN INDUSTRIES, INC.: COMPANY OVERVIEW
- TABLE 239 VANTRAN INDUSTRIES, INC.: PRODUCTS OFFERED
- TABLE 240 RAYCHEM RPG PRIVATE LIMITED: COMPANY OVERVIEW
- TABLE 241 RAYCHEM RPG PRIVATE LIMITED: PRODUCTS OFFERED
- TABLE 242 SERVOKON: COMPANY OVERVIEW
- TABLE 243 SERVOKON: PRODUCTS OFFERED
- TABLE 244 SERVOKON: DEVELOPMENTS
- TABLE 245 EFACEC: COMPANY OVERVIEW
- TABLE 246 EFACEC: PRODUCTS OFFERED
- TABLE 247 EFACEC: DEVELOPMENTS
- TABLE 248 KOTSONS GLOBAL: COMPANY OVERVIEW
- TABLE 249 KOTSONS GLOBAL: PRODUCTS OFFERED
- TABLE 250 HD HYUNDAI ELECTRIC CO., LTD.: COMPANY OVERVIEW
- TABLE 251 HD HYUNDAI ELECTRIC CO., LTD.: PRODUCTS OFFERED
List of Figures
- FIGURE 1 DISTRIBUTION TRANSFORMER MARKET: RESEARCH DESIGN
- FIGURE 2 DATA TRIANGULATION
- FIGURE 3 BREAKDOWN OF PRIMARIES
- FIGURE 4 MAIN METRICS CONSIDERED TO ANALYZE AND ASSESS DEMAND FOR DISTRIBUTION TRANSFORMERS
- FIGURE 5 MARKET SIZE ESTIMATION METHODOLOGY: BOTTOM-UP APPROACH
- FIGURE 6 MARKET SIZE ESTIMATION METHODOLOGY: TOP-DOWN APPROACH
- FIGURE 7 KEY STEPS CONSIDERED TO ASSESS THE SUPPLY OF DISTRIBUTION TRANSFORMERS
- FIGURE 8 DISTRIBUTION TRANSFORMER MARKET: SUPPLY-SIDE ANALYSIS
- FIGURE 9 ASIA PACIFIC TO DOMINATE DISTRIBUTION TRANSFORMER MARKET IN 2025
- FIGURE 10 PAD SEGMENT TO ACCOUNT FOR LARGEST MARKET SHARE IN 2025
- FIGURE 11 THREE-PHASE SEGMENT SECURE LARGER MARKET SHARE IN 2030
- FIGURE 12 0.5-2.5 MVA SEGMENT TO LEAD DISTRIBUTION TRANSFORMER MARKET IN 2025
- FIGURE 13 OIL-IMMERSED SEGMENT TO GARNER LARGER MARKET SHARE IN 2025
- FIGURE 14 POWER UTILITIES SEGMENT TO LEAD DISTRIBUTION TRANSFORMER MARKET IN 2025
- FIGURE 15 DEVELOPMENT OF SMART GRIDS AND INTEGRATION OF RENEWABLE ENERGY SOURCES INTO POWER GRIDS TO OFFER LUCRATIVE GROWTH OPPORTUNITIES
- FIGURE 16 ASIA PACIFIC DISTRIBUTION TRANSFORMER MARKET TO EXHIBIT HIGHEST CAGR DURING FORECAST PERIOD
- FIGURE 17 PAD SEGMENT AND CHINA HELD LARGEST SHARES OF ASIA PACIFIC DISTRIBUTION TRANSFORMER MARKET IN 2024
- FIGURE 18 PAD SEGMENT TO ACCOUNT FOR LARGEST MARKET SHARE IN 2030
- FIGURE 19 THREE-PHASE SEGMENT TO DOMINATE DISTRIBUTION TRANSFORMER MARKET IN 2030
- FIGURE 20 0.5-2.5 MVA SEGMENT TO HOLD LARGEST MARKET SHARE IN 2030
- FIGURE 21 OIL-IMMERSED SEGMENT TO DOMINATE MARKET IN 2030
- FIGURE 22 POWER UTILITIES SEGMENT TO LEAD DISTRIBUTION TRANSFORMER MARKET IN 2030
- FIGURE 23 DISTRIBUTION TRANSFORMER MARKET: DRIVERS, RESTRAINTS, OPPORTUNITIES, AND CHALLENGES
- FIGURE 24 INVESTMENT IN POWER GRIDS AND STORAGE, BY REGION, 2017-2024
- FIGURE 25 GLOBAL INVESTMENT IN CLEAN ENERGY, 2017-2024
- FIGURE 26 GLOBAL CO2 EMISSIONS FROM ELECTRICITY GENERATION, 2014-2026 (METRIC TON)
- FIGURE 27 AVERAGE ANNUAL INVESTMENT SPENDING ON ELECTRICITY GRIDS IN NET ZERO SCENARIO, 2015-2030
- FIGURE 28 GLOBAL DATA ON END-USE INVESTMENT, 2024 (USD BILLION)
- FIGURE 29 TRENDS/DISRUPTIONS IMPACTING CUSTOMER BUSINESS
- FIGURE 30 DISTRIBUTION TRANSFORMER ECOSYSTEM ANALYSIS
- FIGURE 31 DISTRIBUTION TRANSFORMER MARKET: INVESTMENT AND FUNDING SCENARIO, 2024
- FIGURE 32 DISTRIBUTION TRANSFORMER MARKET: SUPPLY CHAIN ANALYSIS
- FIGURE 33 AVERAGE SELLING PRICE TREND OF DISTRIBUTION TRANSFORMERS, BY REGION, 2020-2024
- FIGURE 34 IMPORT DATA FOR HS CODE 8504-COMPLIANT PRODUCTS FOR TOP FIVE COUNTRIES, 2020-2024 (USD THOUSAND)
- FIGURE 35 EXPORT DATA FOR HS CODE 8504-COMPLIANT PRODUCTS, 2020-2024 (USD THOUSAND)
- FIGURE 36 INNOVATIONS AND PATENT REGISTRATIONS RELATED TO DISTRIBUTION TRANSFORMERS, 2015-2025
- FIGURE 37 DISTRIBUTION TRANSFORMER MARKET: PORTER'S FIVE FORCES ANALYSIS
- FIGURE 38 INFLUENCE OF KEY STAKEHOLDERS IN BUYING PROCESS FOR TOP THREE END USERS
- FIGURE 39 KEY BUYING CRITERIA FOR TOP THREE END USERS
- FIGURE 40 IMPACT OF GEN AI/AI ON DISTRIBUTION TRANSFORMER MARKET, BY REGION
- FIGURE 41 DISTRIBUTION TRANSFORMER MARKET, BY MOUNTING, 2024
- FIGURE 42 DISTRIBUTION TRANSFORMER MARKET, BY PHASE, 2024
- FIGURE 43 DISTRIBUTION TRANSFORMER MARKET, BY POWER RATING, 2024
- FIGURE 44 DISTRIBUTION TRANSFORMER MARKET, BY INSULATION, 2024
- FIGURE 45 DISTRIBUTION TRANSFORMER MARKET, BY END USER, 2024
- FIGURE 46 DISTRIBUTION TRANSFORMER MARKET, BY REGION, 2024
- FIGURE 47 ASIA PACIFIC TO REGISTER HIGHEST CAGR DURING FORECAST PERIOD
- FIGURE 48 NORTH AMERICA: DISTRIBUTION TRANSFORMER MARKET SNAPSHOT
- FIGURE 49 EUROPE: DISTRIBUTION TRANSFORMER MARKET SNAPSHOT
- FIGURE 50 ASIA PACIFIC: DISTRIBUTION TRANSFORMER MARKET SNAPSHOT
- FIGURE 51 DISTRIBUTION TRANSFORMER MARKET SHARE ANALYSIS, 2024
- FIGURE 52 DISTRIBUTION TRANSFORMER MARKET: REVENUE ANALYSIS OF TOP FIVE PLAYERS, 2020-2024 (USD BILLION)
- FIGURE 53 DISTRIBUTION TRANSFORMER MARKET: COMPANY EVALUATION MATRIX (KEY PLAYERS), 2024
- FIGURE 54 DISTRIBUTION TRANSFORMER MARKET: COMPANY FOOTPRINT
- FIGURE 55 DISTRIBUTION TRANSFORMER MARKET: COMPANY EVALUATION MATRIX (STARTUPS/SMES), 2024
- FIGURE 56 DISTRIBUTION TRANSFORMER MARKET: EV/EBITDA, 2024
- FIGURE 57 DISTRIBUTION TRANSFORMER MARKET: COMPANY VALUATION, 2024
- FIGURE 58 DISTRIBUTION TRANSFORMER MARKET: BRAND/PRODUCT
- FIGURE 59 HITACHI ENERGY LTD: COMPANY SNAPSHOT
- FIGURE 60 EATON: COMPANY SNAPSHOT
- FIGURE 61 SCHNEIDER ELECTRIC: COMPANY SNAPSHOT
- FIGURE 62 SIEMENS ENERGY: COMPANY SNAPSHOT
- FIGURE 63 TOSHIBA ENERGY SYSTEMS & SOLUTIONS CORPORATION: COMPANY SNAPSHOT
- FIGURE 64 CG POWER & INDUSTRIAL SOLUTIONS LTD.: COMPANY SNAPSHOT
- FIGURE 65 GE VERNOVA: COMPANY SNAPSHOT
- FIGURE 66 TRANSFORMERS AND RECTIFIERS INDIA LTD: COMPANY SNAPSHOT
- FIGURE 67 HYOSUNG HEAVY INDUSTRIES: COMPANY SNAPSHOT
- FIGURE 68 HAMMOND POWER SOLUTIONS: COMPANY SNAPSHOT
- FIGURE 69 HD HYUNDAI ELECTRIC CO., LTD.: COMPANY SNAPSHOT

