
PUBLISHER: MarketsandMarkets | PRODUCT CODE: 1786132

PUBLISHER: MarketsandMarkets | PRODUCT CODE: 1786132
Photovoltaics (PV) Films Market by Raw material (EVA, PVB, POE), Application (Ground-mounted PV, Building-integrated PV) - Forecast to 2034
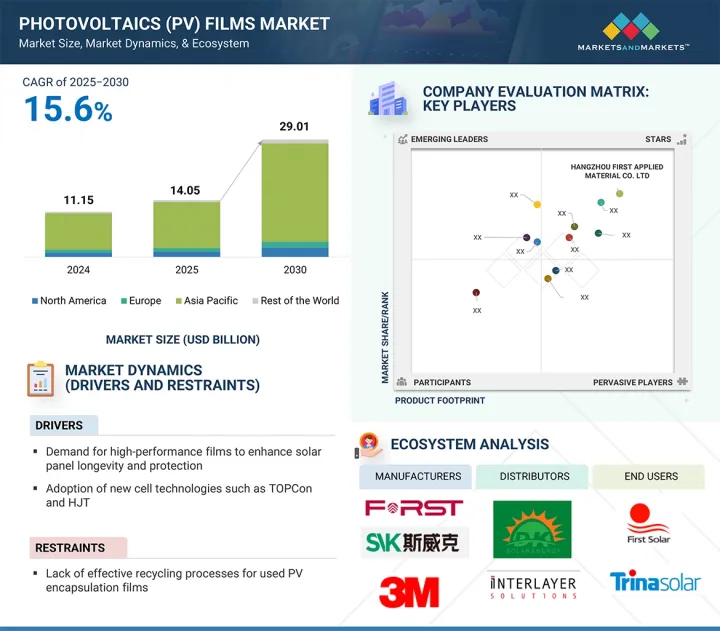
The photovoltaics (PV) films market size is projected to grow from USD 14.05 billion in 2025 to USD 29.01 billion by 2030, registering a CAGR of 15.6% during the forecast period.
| Scope of the Report | |
|---|---|
| Years Considered for the Study | 2021-2030 |
| Base Year | 2024 |
| Forecast Period | 2025-2034 |
| Units Considered | Value (USD Million/Billion) and Volume |
| Segments | Raw Material, Application, and Region |
| Regions covered | North America, Europe, Asia Pacific, Rest of the World |
The main driver is the increasing emphasis on sustainability, as countries and industries push for low-carbon energy systems, which require durable encapsulants for solar panels for long-lasting energy production and efficiency. Recent material trends include new encapsulation materials, namely, the movement away from EVA in favor of non-EVA materials like polyvinyl butyral (PVB) and thermoplastic polyurethane (TPU). It is critical due to the extreme climate conditions faced by the countries, and these encapsulation materials have superior UV stability and outstanding mechanical strength. Lightweight and flexible encapsulation films have also emerged, particularly related to applications in building-integrated photovoltaic (BIPV) systems and off-grid systems.
" POE raw material to account for the fastest-growth of photovoltaics (PV) films market in terms of value, during the forecast period"
Polyolefin elastomers (POEs) continue to be the fastest-growing product segment in the photovoltaics films market due to their superior performance properties when compared with conventional materials such as EVA. While there are many drivers behind POE's rapid growth, one of the biggest reasons is POE film's superior moisture resistance, which leads to a lower likelihood of Potential Induced Degradation (PID), a well-known risk when operating in humid and high-voltage environments. POE is also very thermally stable and UV stable, which contributes to a ,longer-lasting transparent layer on the solar panels for high performance and durability, especially in extreme weather environments. POE is particularly suited for most modern module technologies, including bifacial modules and high-efficiency solar cells, which are constantly deployed in utility-scale solar projects.
"Ground-mounted PV to account for the fastest growth of the photovoltaics (PV) films market in terms of value, during the forecast period"
Ground-mounted PV systems are the fastest-growing segment in the photovoltaic film market because they are widely found in utility-scale and large commercial solar projects. Ground-mounted PV systems are mainly found in open and unshaded spaces with high-capacity arrays, making them ideally suited to create bulk power. In many regions, active development of utility-scale solar farms is occurring to meet the clean renewable energy requirements from emerging economies and large energy consumers, such as China, India, the US, and countries in the Middle East. Subsequently, there is a strong demand for long-term reliability and protection against the harsh environment in which these solar modules are utilized. Therefore, there is a pressing demand for durable, high-performance encapsulation films for solar modules that will provide reliability for many years or decades, depending on the location and use of the module, specifically with respect to exposure to UV rays, heat, and moisture.
"Asia Pacific is projected to be the fastest-growing region in the photovoltaics (PV) films market in terms of value, during the forecast period"
Asia Pacific is the fastest-growing region in the photovoltaics films market because of the rapidly growing solar energy capacity, government support, and a robust manufacturing ecosystem. Growing solar capacity in the region, particularly in China, India, Japan, and South Korea, is driven by reducing carbon emissions, increasing energy demands, and bolstering energy independence. China is the largest producer and consumer of solar panels and an integral player in the global supply chain, which includes the manufacture of photovoltaic encapsulation films. Favorable policies, subsidies, and renewable energy targets are fueling the expansion of solar across the region. Meanwhile, government action, such as the National Solar Mission and state incentives, are driving utility-scale and rooftop solar projects in India. The combination of abundant sunlight, low-cost labor, and a growing commitment to solar across the Asia Pacific is also a boon for the photovoltaics films market. Additionally, Asia Pacific includes many leading encapsulant film manufacturers, which facilitate new product innovation and support pricing efficiencies.
In-depth interviews were conducted with Chief Executive Officers (CEOs), marketing directors, other innovation and technology directors, and executives from various key organizations operating in the photovoltaics films market, and information was gathered from secondary research to determine and verify the market size of several segments.
- By Company Type: Tier 1 - 50%, Tier 2 - 30%, and Tier 3 - 20%
- By Designation: Managers- 15%, Directors - 20%, and Others - 65%
- By Region: North America - 30%, Europe - 20%, Asia Pacific - 40%, Rest of the World - 10%.
The Photovoltaics (PV) Films market comprises major players, such as H.B. Fuller Company (US), 3M (US), Kuraray Co., Ltd (Japan), JA SOLAR Technology Co., Ltd. (China), Borealis AG (Austria)., Jiangsu Sveck Photovoltaic New Material Co., Ltd (China), HANGZHOU FIRST APPLIED MATERIAL CO.,LTD. (China), Shanghai HIUV New Materials Co.,Ltd. (China), Guangzhou Lushan New Materials Co., Ltd. (China), Betterial (China), Mitsui Chemicals, Inc. (Japan), Hanwha Group (South Korea), Zhejiang Sinopont Technology Co.,Ltd. (China), and Cybrid Technologies Inc. (China). The study includes in-depth competitive analysis of these key players in the photovoltaic films market, with their company profiles, recent developments, and key market strategies.
Research Coverage
This report segments the market for photovoltaic films market on the basis of raw material, application, and region, and provides estimations for the overall value of the market across various regions. A detailed analysis of key industry players has been conducted to provide insights into their business overviews, products & services, key strategies, and expansions associated with the market for photovoltaic films.
Key benefits of buying this report
This research report is focused on various levels of analysis - industry analysis (industry trends), market ranking analysis of top players, and company profiles, which together provide an overall view of the competitive landscape, emerging and high-growth segments of the photovoltaic films market; high-growth regions; and market drivers, restraints, opportunities, and challenges.
The report provides insights on the following pointers:
- Analysis of drivers: (Demand for high-performance films to enhance solar panel longevity and protection), restraints (Lack of effective recycling process for used photovoltaic films), opportunities (Innovations in encapsulation materials elevate panel efficiency and performance, driving investments), and challenges (Performance Concerns of solar films in regions with climate variability).
- Market Penetration: Comprehensive information on the Photovoltaic Films market offered by top players in the Photovoltaic Films market.
- Product Development/Innovation: Detailed insights on upcoming technologies, research & development activities, product launches, partnerships, agreements, joint ventures, collaborations, announcements, awards, and expansions in the market.
- Market Development: Comprehensive information about lucrative emerging markets. The report analyzes the markets for photovoltaic films across regions.
- Market Capacity: Production capacities of companies producing photovoltaic films are provided wherever available with upcoming capacities.
- Competitive Assessment: In-depth assessment of market shares, strategies, products, and manufacturing capabilities of leading players in the photovoltaic films market.
TABLE OF CONTENTS
1 INTRODUCTION
- 1.1 STUDY OBJECTIVES
- 1.2 MARKET DEFINITION
- 1.3 STUDY SCOPE
- 1.3.1 MARKETS COVERED AND REGIONAL SCOPE
- 1.3.2 INCLUSIONS AND EXCLUSIONS
- 1.3.3 YEARS CONSIDERED
- 1.3.4 CURRENCY CONSIDERED
- 1.3.5 UNIT CONSIDERED
- 1.4 RESEARCH LIMITATIONS
- 1.5 STAKEHOLDERS
2 RESEARCH METHODOLOGY
- 2.1 RESEARCH DATA
- 2.1.1 SECONDARY DATA
- 2.1.1.1 Key data from secondary sources
- 2.1.2 PRIMARY DATA
- 2.1.2.1 Key data from primary sources
- 2.1.2.2 Key primary sources
- 2.1.2.3 Key participants for primary interviews
- 2.1.2.4 Breakdown of interviews with experts
- 2.1.2.5 Key industry insights
- 2.1.1 SECONDARY DATA
- 2.2 BASE NUMBER CALCULATION
- 2.2.1 SUPPLY-SIDE ANALYSIS
- 2.2.2 DEMAND-SIDE ANALYSIS
- 2.3 GROWTH FORECAST
- 2.3.1 SUPPLY SIDE
- 2.3.2 DEMAND SIDE
- 2.4 MARKET SIZE ESTIMATION
- 2.4.1 BOTTOM-UP APPROACH
- 2.4.2 TOP-DOWN APPROACH
- 2.5 DATA TRIANGULATION
- 2.6 RESEARCH ASSUMPTIONS
- 2.7 GROWTH FORECAST
- 2.8 RISK ASSESSMENT
- 2.9 FACTOR ANALYSIS
3 EXECUTIVE SUMMARY
4 PREMIUM INSIGHTS
- 4.1 ATTRACTIVE OPPORTUNITIES FOR PLAYERS IN PHOTOVOLTAIC (PV) FILMS MARKET
- 4.2 PHOTOVOLTAIC (PV) FILMS MARKET, BY RAW MATERIAL
- 4.3 PHOTOVOLTAIC (PV) FILMS MARKET, BY APPLICATION
- 4.4 PHOTOVOLTAIC (PV) FILMS MARKET, BY COUNTRY
5 MARKET OVERVIEW
- 5.1 INTRODUCTION
- 5.2 MARKET DYNAMICS
- 5.2.1 DRIVERS
- 5.2.1.1 Increasing demand for high-performance films to enhance solar panel longevity and protection
- 5.2.1.2 Adoption of new cell technologies - Tunnel Oxide Passivated Contact (TOPCon) and Heterojunction Technology (HJT)
- 5.2.1.3 Government-led policies for solar energy
- 5.2.2 RESTRAINTS
- 5.2.2.1 Lack of effective recycling processes for used PV encapsulation films
- 5.2.3 OPPORTUNITIES
- 5.2.3.1 Increasing deployment of floating solar installations
- 5.2.3.2 Innovations in encapsulation materials to elevate panel efficiency and performance
- 5.2.4 CHALLENGES
- 5.2.4.1 Performance concerns associated with solar films in regions with climate variability
- 5.2.1 DRIVERS
- 5.3 IMPACT OF GENERATIVE AI ON PHOTOVOLTAICS (PV) FILMS MARKET
- 5.3.1 INTRODUCTION
6 INDUSTRY TRENDS
- 6.1 INTRODUCTION
- 6.2 TRENDS/DISRUPTIONS IMPACTING CUSTOMER BUSINESS
- 6.3 SUPPLY CHAIN ANALYSIS
- 6.4 IMPACT OF 2025 US TARIFF ON PHOTOVOLTAIC (PV) FILMS MARKET
- 6.4.1 INTRODUCTION
- 6.4.2 KEY TARIFF RATES
- 6.4.3 PRICE IMPACT ANALYSIS
- 6.4.4 IMPACT ON REGIONS
- 6.4.4.1 North America
- 6.4.4.2 Europe
- 6.4.4.3 Asia Pacific
- 6.4.5 IMPACT ON MATERIALS
- 6.5 INVESTMENT AND FUNDING SCENARIO
- 6.6 PRICING ANALYSIS
- 6.6.1 AVERAGE SELLING PRICE TREND, BY REGION, 2021-2024
- 6.6.2 AVERAGE SELLING PRICE TREND, BY RAW MATERIAL, 2021-2024
- 6.6.3 AVERAGE SELLING PRICE TREND OF KEY PLAYERS, BY RAW MATERIAL, 2024
- 6.7 ECOSYSTEM ANALYSIS
- 6.8 TECHNOLOGY ANALYSIS
- 6.8.1 KEY TECHNOLOGIES
- 6.8.2 COMPLEMENTARY TECHNOLOGIES
- 6.8.3 ADJACENT TECHNOLOGIES
- 6.9 PATENT ANALYSIS
- 6.9.1 METHODOLOGY
- 6.9.2 PATENTS GRANTED WORLDWIDE
- 6.9.3 PATENT PUBLICATION TRENDS
- 6.9.4 INSIGHTS
- 6.9.5 LEGAL STATUS OF PATENTS
- 6.9.6 JURISDICTION ANALYSIS
- 6.9.7 TOP APPLICANTS
- 6.10 TRADE ANALYSIS
- 6.10.1 IMPORT SCENARIO (HS CODE 392010)
- 6.10.2 EXPORT SCENARIO (HS CODE 392010)
- 6.11 KEY CONFERENCES AND EVENTS, 2025-2026
- 6.12 TARIFF AND REGULATORY LANDSCAPE
- 6.12.1 TARIFF ANALYSIS
- 6.12.2 REGULATORY BODIES, GOVERNMENT AGENCIES, AND OTHER ORGANIZATIONS
- 6.12.3 STANDARDS AND REGULATIONS
- 6.13 PORTER'S FIVE FORCES ANALYSIS
- 6.13.1 THREAT OF NEW ENTRANTS
- 6.13.2 THREAT OF SUBSTITUTES
- 6.13.3 BARGAINING POWER OF SUPPLIERS
- 6.13.4 BARGAINING POWER OF BUYERS
- 6.13.5 INTENSITY OF COMPETITIVE RIVALRY
- 6.14 KEY STAKEHOLDERS AND BUYING CRITERIA
- 6.14.1 KEY STAKEHOLDERS IN BUYING PROCESS
- 6.14.2 BUYING CRITERIA
- 6.15 MACROECONOMIC OUTLOOK
- 6.15.1 GDP TRENDS AND FORECASTS OF MAJOR ECONOMIES
- 6.16 CASE STUDY ANALYSIS
- 6.16.1 COMPARATIVE DURABILITY ANALYSIS OF POE AND EVA ENCAPSULANTS IN PHOTOVOLTAIC MODULES
- 6.16.2 CHARACTERIZATION OF EVA FILMS FOR PHOTOVOLTAIC MODULES
7 PHOTOVOLTAIC (PV) FILMS MARKET, BY RAW MATERIAL
- 7.1 INTRODUCTION
- 7.2 ETHYLENE VINYL ACETATE (EVA)
- 7.2.1 RAPID GROWTH OF GLOBAL SOLAR INFRASTRUCTURE AND RISING NEED FOR HIGH-PERFORMANCE FILMS TO DRIVE MARKET
- 7.3 POLYVINYL BUTYRAL (PVB)
- 7.3.1 STRONG BINDING PROPERTIES, OPTICAL CLARITY, ADHESION TO VARIOUS SURFACES, TOUGHNESS, AND FLEXIBILITY TO FUEL DEMAND
- 7.4 POLYOLEFIN ELASTOMER (POE)
- 7.4.1 LOW WATER VAPOR TRANSMISSION RATE AND THERMAL STABILITY TO FUEL DEMAND
- 7.5 OTHER RAW MATERIALS
- 7.5.1 PDMS
- 7.5.2 IONOMER
- 7.5.3 SILICON
- 7.5.4 TPO
8 PHOTOVOLTAIC (PV) FILMS MARKET, BY APPLICATION
- 8.1 INTRODUCTION
- 8.2 GROUND-MOUNTED PV
- 8.2.1 EXPANSION OF GROUND-MOUNTED PV PROJECTS TO DRIVE DEMAND
- 8.3 BUILDING-INTEGRATED PV
- 8.3.1 INCREASING DEMAND FOR SUSTAINABLE CONSTRUCTION, SUPPORTIVE GOVERNMENT POLICIES, AND ADVANCEMENTS IN PV TECHNOLOGY TO PROPEL MARKET
9 PHOTOVOLTAIC (PV) FILMS MARKET, BY REGION
- 9.1 INTRODUCTION
- 9.2 ASIA PACIFIC
- 9.2.1 CHINA
- 9.2.1.1 Presence of leading PV encapsulation film manufacturers to drive market
- 9.2.2 JAPAN
- 9.2.2.1 Subsidies and feed-in tariffs to drive market
- 9.2.3 INDIA
- 9.2.3.1 High government-led support through schemes, solar parks, and net metering policies to drive market
- 9.2.4 SOUTH KOREA
- 9.2.4.1 Significant investment in R&D for high-quality materials to drive market
- 9.2.5 TAIWAN
- 9.2.5.1 High export of solar panels and domestic manufacturing of PV films to propel market
- 9.2.6 REST OF ASIA PACIFIC
- 9.2.1 CHINA
- 9.3 NORTH AMERICA
- 9.3.1 US
- 9.3.1.1 Inflation Reduction Act (IRA) supporting domestic solar manufacturing and installations to drive market
- 9.3.2 CANADA
- 9.3.2.1 Expansion of solar projects in Ontario and Alberta to drive market
- 9.3.3 MEXICO
- 9.3.3.1 Emergence as manufacturing hub to drive demand
- 9.3.1 US
- 9.4 EUROPE
- 9.4.1 GERMANY
- 9.4.1.1 Rising construction of sustainable buildings to drive demand
- 9.4.2 ITALY
- 9.4.2.1 Increased production capacity and strong international partnerships to drive market
- 9.4.3 FRANCE
- 9.4.3.1 Expansion of floating solar systems on reservoirs, rivers, and coastal waters to fuel market growth
- 9.4.4 UK
- 9.4.4.1 Growing focus on renewable energy and solar installations to propel market
- 9.4.5 SPAIN
- 9.4.5.1 Expansion of solar parks to drive demand
- 9.4.6 RUSSIA
- 9.4.6.1 Ongoing investments in renewable energy infrastructure to drive market
- 9.4.7 REST OF EUROPE
- 9.4.1 GERMANY
- 9.5 ROW
- 9.5.1 SAUDI ARABIA
- 9.5.1.1 High focus on diversification under Vision 2030 initiative to drive market
- 9.5.2 UAE
- 9.5.2.1 Government-led incentives and policies supporting solar energy to drive demand
- 9.5.3 OMAN
- 9.5.3.1 Utility-scale solar projects to boost demand
- 9.5.4 EGYPT
- 9.5.4.1 Expanding local manufacturing to boost domestic demand
- 9.5.5 SOUTH AFRICA
- 9.5.5.1 Rapid expansion of utility-scale solar farms to drive demand
- 9.5.6 OTHERS IN ROW
- 9.5.1 SAUDI ARABIA
10 COMPETITIVE LANDSCAPE
- 10.1 INTRODUCTION
- 10.2 KEY PLAYER STRATEGIES/RIGHT TO WIN
- 10.3 MARKET SHARE ANALYSIS
- 10.4 REVENUE ANALYSIS
- 10.5 COMPANY EVALUATION MATRIX: KEY PLAYERS, 2024
- 10.5.1 STARS
- 10.5.2 EMERGING LEADERS
- 10.5.3 PERVASIVE PLAYERS
- 10.5.4 PARTICIPANTS
- 10.5.5 COMPANY FOOTPRINT: KEY PLAYERS, 2024
- 10.5.5.1 Company footprint
- 10.5.5.2 Region footprint
- 10.5.5.3 Raw material footprint
- 10.5.5.4 Application footprint
- 10.6 COMPANY EVALUATION MATRIX: STARTUPS/SMES, 2024
- 10.6.1 PROGRESSIVE COMPANIES
- 10.6.2 RESPONSIVE COMPANIES
- 10.6.3 DYNAMIC COMPANIES
- 10.6.4 STARTING BLOCKS
- 10.6.5 COMPETITIVE BENCHMARKING: STARTUPS/SMES, 2024
- 10.6.5.1 Detailed list of key startups/SMEs
- 10.6.5.2 Competitive benchmarking of key startups/SMEs
- 10.7 BRAND/PRODUCT COMPARATIVE ANALYSIS
- 10.8 COMPANY VALUATION AND FINANCIAL METRICS
- 10.9 COMPETITIVE SCENARIO
- 10.9.1 PRODUCT LAUNCHES
- 10.9.2 DEALS
- 10.9.3 EXPANSIONS
- 10.9.4 OTHERS
11 COMPANY PROFILES
- 11.1 KEY PLAYERS
- 11.1.1 H.B. FULLER COMPANY
- 11.1.1.1 Business overview
- 11.1.1.2 Products/Solutions/Services offered
- 11.1.1.3 Recent developments
- 11.1.1.3.1 Deals
- 11.1.1.4 MnM view
- 11.1.1.4.1 Key strengths/Right to win
- 11.1.1.4.2 Strategic choices
- 11.1.1.4.3 Weaknesses/Competitive threats
- 11.1.2 3M
- 11.1.2.1 Business overview
- 11.1.2.2 Products/Solutions/Services offered
- 11.1.2.3 MnM view
- 11.1.2.3.1 Key strengths/Right to win
- 11.1.2.3.2 Strategic choices
- 11.1.2.3.3 Weaknesses/Competitive threats
- 11.1.3 KURARAY CO., LTD.
- 11.1.3.1 Business overview
- 11.1.3.2 Products/Solutions/Services offered
- 11.1.3.3 MnM view
- 11.1.3.3.1 Key strengths/Right to win
- 11.1.3.3.2 Strategic choices
- 11.1.3.3.3 Weaknesses/Competitive threats
- 11.1.4 JA SOLAR TECHNOLOGY CO., LTD.
- 11.1.4.1 Business overview
- 11.1.4.2 Products/Solutions/Services offered
- 11.1.4.3 MnM view
- 11.1.4.3.1 Key strengths/Right to win
- 11.1.4.3.2 Strategic choices
- 11.1.4.3.3 Weaknesses/Competitive threats
- 11.1.5 BOREALIS GMBH
- 11.1.5.1 Business overview
- 11.1.5.2 Products/Solutions/Services offered
- 11.1.5.3 MnM view
- 11.1.5.3.1 Key strengths/Right to win
- 11.1.5.3.2 Strategic choices
- 11.1.5.3.3 Weaknesses/Competitive threats
- 11.1.6 JIANGSU SVECK PHOTOVOLTAIC NEW MATERIAL CO., LTD.
- 11.1.6.1 Business overview
- 11.1.6.2 Products/Solutions/Services offered
- 11.1.6.3 Recent developments
- 11.1.6.3.1 Deals
- 11.1.6.3.2 Expansions
- 11.1.6.3.3 Others
- 11.1.6.4 MnM view
- 11.1.6.4.1 Key strengths/Right to win
- 11.1.6.4.2 Strategic choices
- 11.1.6.4.3 Weaknesses/Competitive threats
- 11.1.7 HANGZHOU FIRST APPLIED MATERIAL CO., LTD.
- 11.1.7.1 Business overview
- 11.1.7.2 Products/Solutions/Services offered
- 11.1.7.3 Recent developments
- 11.1.7.3.1 Expansions
- 11.1.7.3.2 Others
- 11.1.7.4 MnM view
- 11.1.7.4.1 Key strengths/Right to win
- 11.1.7.4.2 Strategic choices
- 11.1.7.4.3 Weaknesses/Competitive threats
- 11.1.8 SHANGHAI HIUV NEW MATERIALS CO., LTD.
- 11.1.8.1 Business overview
- 11.1.8.2 Products/Solutions/Services offered
- 11.1.8.3 Recent developments
- 11.1.8.3.1 Others
- 11.1.8.4 MnM view
- 11.1.8.4.1 Key strengths/Right to win
- 11.1.8.4.2 Strategic choices
- 11.1.8.4.3 Weaknesses/Competitive threats
- 11.1.9 GUANGZHOU LUSHAN NEW MATERIALS CO., LTD.
- 11.1.9.1 Business overview
- 11.1.9.2 Products/Solutions/Services offered
- 11.1.9.3 MnM view
- 11.1.9.3.1 Key strengths/Right to win
- 11.1.9.3.2 Strategic choices
- 11.1.9.3.3 Weaknesses/Competitive threats
- 11.1.10 BETTERIAL
- 11.1.10.1 Business overview
- 11.1.10.2 Products/Solutions/Services offered
- 11.1.10.3 Recent developments
- 11.1.10.3.1 Product launches
- 11.1.10.3.2 Deals
- 11.1.10.3.3 Others
- 11.1.10.4 MnM view
- 11.1.10.4.1 Key strengths/Right to win
- 11.1.10.4.2 Strategic choices
- 11.1.10.4.3 Weaknesses/Competitive threats
- 11.1.11 MITSUI CHEMICALS, INC.
- 11.1.11.1 Business overview
- 11.1.11.2 Products/Solutions/Services offered
- 11.1.11.3 Recent development
- 11.1.11.3.1 Expansions
- 11.1.11.3.2 Others
- 11.1.11.4 MnM view
- 11.1.11.4.1 Key strengths/Right to win
- 11.1.11.4.2 Strategic choices
- 11.1.11.4.3 Weaknesses/Competitive threats
- 11.1.12 HANWHA GROUP
- 11.1.12.1 Business overview
- 11.1.12.2 Products/Solutions/Services offered
- 11.1.12.3 Recent developments
- 11.1.12.3.1 Deals
- 11.1.12.3.2 Expansions
- 11.1.12.4 MnM view
- 11.1.12.4.1 Key strengths/Right to win
- 11.1.12.4.2 Strategic choices
- 11.1.12.4.3 Weaknesses/Competitive threats
- 11.1.13 ZHEJIANG SINOPONT TECHNOLOGY CO., LTD.
- 11.1.13.1 Business overview
- 11.1.13.2 Products/Solutions/Services offered
- 11.1.13.3 Recent developments
- 11.1.13.3.1 Expansions
- 11.1.13.4 MnM view
- 11.1.13.4.1 Key strengths/Right to win
- 11.1.13.4.2 Strategic choices
- 11.1.13.4.3 Weaknesses/Competitive threats
- 11.1.14 CYBRID TECHNOLOGIES INC.
- 11.1.14.1 Business overview
- 11.1.14.2 Products/Solutions/Services offered
- 11.1.14.3 Recent developments
- 11.1.14.3.1 Deals
- 11.1.14.3.2 Others
- 11.1.14.4 MnM view
- 11.1.14.4.1 Key strengths/Right to win
- 11.1.14.4.2 Strategic choices
- 11.1.14.4.3 Weaknesses/Competitive threats
- 11.1.1 H.B. FULLER COMPANY
- 11.2 OTHER PLAYERS
- 11.2.1 SATINAL SPA
- 11.2.2 LUCENT CLEANENERGY
- 11.2.3 THE COMPOUND COMPANY
- 11.2.4 DR. HANS WERNER CHEMIKALIEN
- 11.2.5 FILMTEC
- 11.2.6 CROWN ADVANCED MATERIAL CO., LTD.
- 11.2.7 HANGZHOU XINDONGKE ENERGY TECHNOLOGY CO., LTD
- 11.2.8 FELIX NONWOVENS
- 11.2.9 HUIZHOU BAOJUN MATERIAL TECHNOLOGY CO., LTD
- 11.2.10 DANA POLY, INC.
- 11.2.11 VISHAKHA RENEWABLES PVT. LTD.
- 11.2.12 NOVOPOLYMERS
- 11.2.13 ENRICH ENCAP PVT. LTD.
- 11.2.14 ZHEJIANG FEIYU NEW ENERGY CO., LTD.
- 11.2.15 FUYIN GROUP
12 APPENDIX
- 12.1 DISCUSSION GUIDE
- 12.2 KNOWLEDGESTORE: MARKETSANDMARKETS' SUBSCRIPTION PORTAL
- 12.3 CUSTOMIZATION OPTIONS
- 12.4 RELATED REPORTS
- 12.5 AUTHOR DETAILS
List of Tables
- TABLE 1 AVERAGE SELLING PRICE TREND OF PV FILMS, BY REGION, 2021-2024 (USD/SQUARE METERS)
- TABLE 2 AVERAGE SELLING PRICE TREND OF PV FILMS, BY RAW MATERIAL, 2021-2024 (USD/SQUARE METERS)
- TABLE 3 AVERAGE SELLING PRICE TREND OF PV FILMS OFFERED BY KEY PLAYERS, BY RAW MATERIAL, 2024 (USD/SQUARE METERS)
- TABLE 4 ROLES OF COMPANIES IN PHOTOVOLTAIC (PV) FILMS ECOSYSTEM
- TABLE 5 PHOTOVOLTAIC (PV) FILMS MARKET: KEY TECHNOLOGIES
- TABLE 6 PHOTOVOLTAIC (PV) FILMS MARKET: COMPLEMENTARY TECHNOLOGIES
- TABLE 7 PHOTOVOLTAIC (PV) FILMS MARKET: ADJACENT TECHNOLOGIES
- TABLE 8 PHOTOVOLTAIC (PV) FILMS MARKET: TOTAL NUMBER OF PATENTS, 2015-2024
- TABLE 9 PHOTOVOLTAIC (PV) FILMS: LIST OF MAJOR PATENT OWNERS
- TABLE 10 PHOTOVOLTAIC (PV) FILMS: LIST OF MAJOR PATENTS, 2015-2024
- TABLE 11 PHOTOVOLTAIC (PV) FILMS MARKET: LIST OF KEY CONFERENCES AND EVENTS, 2025-2026
- TABLE 12 TARIFFS RELATED TO PV FILMS, BY COUNTRY, 2025
- TABLE 13 NORTH AMERICA: REGULATORY BODIES, GOVERNMENT AGENCIES, AND OTHER ORGANIZATIONS
- TABLE 14 EUROPE: REGULATORY BODIES, GOVERNMENT AGENCIES, AND OTHER ORGANIZATIONS
- TABLE 15 ASIA PACIFIC: REGULATORY BODIES, GOVERNMENT AGENCIES, AND OTHER ORGANIZATIONS
- TABLE 16 ROW: REGULATORY BODIES, GOVERNMENT AGENCIES, AND OTHER ORGANIZATIONS
- TABLE 17 PHOTOVOLTAIC (PV) FILMS MARKET: STANDARDS AND REGULATIONS
- TABLE 18 PHOTOVOLTAIC (PV) FILMS MARKET: PORTER'S FIVE FORCES ANALYSIS
- TABLE 19 INFLUENCE OF STAKEHOLDERS ON BUYING PROCESS, BY APPLICATION (%)
- TABLE 20 KEY BUYING CRITERIA, BY APPLICATION
- TABLE 21 GDP TRENDS AND FORECASTS, BY KEY COUNTRY, 2023-2025 (USD MILLION)
- TABLE 22 PHOTOVOLTAIC (PV) FILMS MARKET, BY RAW MATERIAL, 2021-2024 (USD MILLION)
- TABLE 23 PHOTOVOLTAIC (PV) FILMS MARKET, BY RAW MATERIAL, 2025-2030 (USD MILLION)
- TABLE 24 PHOTOVOLTAIC (PV) FILMS MARKET, BY RAW MATERIAL, 2021-2024 (MILLION SQUARE METERS)
- TABLE 25 PHOTOVOLTAIC (PV) FILMS MARKET, BY RAW MATERIAL, 2025-2030 (MILLION SQUARE METERS)
- TABLE 26 PHOTOVOLTAIC (PV) FILMS MARKET, BY APPLICATION, 2021-2024 (USD MILLION)
- TABLE 27 PHOTOVOLTAIC (PV) FILMS MARKET, BY APPLICATION, 2025-2030 (USD MILLION)
- TABLE 28 PHOTOVOLTAIC (PV) FILMS MARKET, BY APPLICATION, 2021-2024 (MILLION SQUARE METERS)
- TABLE 29 PHOTOVOLTAIC (PV) FILMS MARKET, BY APPLICATION, 2025-2030 (MILLION SQUARE METERS)
- TABLE 30 PHOTOVOLTAIC (PV) FILMS MARKET, BY REGION, 2021-2024 (USD MILLION)
- TABLE 31 PHOTOVOLTAIC (PV) FILMS MARKET, BY REGION, 2025-2030 (USD MILLION)
- TABLE 32 PHOTOVOLTAIC (PV) FILMS MARKET, BY REGION, 2021-2024 (MILLION SQUARE METERS)
- TABLE 33 PHOTOVOLTAIC (PV) FILMS MARKET, BY REGION, 2025-2030 (MILLION SQUARE METERS)
- TABLE 34 ASIA PACIFIC: PHOTOVOLTAIC (PV) FILMS MARKET, BY COUNTRY, 2021-2024 (USD MILLION)
- TABLE 35 ASIA PACIFIC: PHOTOVOLTAIC (PV) FILMS MARKET, BY COUNTRY, 2025-2030 (USD MILLION)
- TABLE 36 ASIA PACIFIC: PHOTOVOLTAIC (PV) FILMS MARKET, BY COUNTRY, 2021-2024 (MILLION SQUARE METERS)
- TABLE 37 ASIA PACIFIC: PHOTOVOLTAIC (PV) FILMS MARKET, BY COUNTRY, 2025-2030 (MILLION SQUARE METERS)
- TABLE 38 ASIA PACIFIC: PHOTOVOLTAIC (PV) FILMS MARKET, BY RAW MATERIAL, 2021-2024 (USD MILLION)
- TABLE 39 ASIA PACIFIC: PHOTOVOLTAIC (PV) FILMS MARKET, BY RAW MATERIAL, 2025-2030 (USD MILLION)
- TABLE 40 ASIA PACIFIC: PHOTOVOLTAIC (PV) FILMS MARKET, BY RAW MATERIAL, 2021-2024 (MILLION SQUARE METERS)
- TABLE 41 ASIA PACIFIC: PHOTOVOLTAIC (PV) FILMS MARKET, BY RAW MATERIAL, 2025-2030 (MILLION SQUARE METERS)
- TABLE 42 ASIA PACIFIC: PHOTOVOLTAIC (PV) FILMS MARKET, BY APPLICATION, 2021-2024 (USD MILLION)
- TABLE 43 ASIA PACIFIC: PHOTOVOLTAIC (PV) FILMS MARKET, BY APPLICATION, 2025-2030 (USD MILLION)
- TABLE 44 ASIA PACIFIC: PHOTOVOLTAIC (PV) FILMS MARKET, BY APPLICATION, 2021-2024 (MILLION SQUARE METERS)
- TABLE 45 ASIA PACIFIC: PHOTOVOLTAIC (PV) FILMS MARKET, BY APPLICATION, 2025-2030 (MILLION SQUARE METERS)
- TABLE 46 CHINA: PHOTOVOLTAIC (PV) FILMS MARKET, BY APPLICATION, 2021-2024 (USD MILLION)
- TABLE 47 CHINA: PHOTOVOLTAIC (PV) FILMS MARKET, BY APPLICATION, 2025-2030 (USD MILLION)
- TABLE 48 CHINA: PHOTOVOLTAIC (PV) FILMS MARKET, BY APPLICATION, 2021-2024 (MILLION SQUARE METERS)
- TABLE 49 CHINA: PHOTOVOLTAIC (PV) FILMS MARKET, BY APPLICATION, 2025-2030 (MILLION SQUARE METERS)
- TABLE 50 JAPAN: PHOTOVOLTAIC (PV) FILMS MARKET, BY APPLICATION, 2021-2024 (USD MILLION)
- TABLE 51 JAPAN: PHOTOVOLTAIC (PV) FILMS MARKET, BY APPLICATION, 2025-2030 (USD MILLION)
- TABLE 52 JAPAN: PHOTOVOLTAIC (PV) FILMS MARKET, BY APPLICATION, 2021-2024 (MILLION SQUARE METERS)
- TABLE 53 JAPAN: PHOTOVOLTAIC (PV) FILMS MARKET, BY APPLICATION, 2025-2030 (MILLION SQUARE METERS)
- TABLE 54 INDIA: PHOTOVOLTAIC (PV) FILMS MARKET, BY APPLICATION, 2021-2024 (USD MILLION)
- TABLE 55 INDIA: PHOTOVOLTAIC (PV) FILMS MARKET, BY APPLICATION, 2025-2030 (USD MILLION)
- TABLE 56 INDIA: PHOTOVOLTAIC (PV) FILMS MARKET, BY APPLICATION, 2021-2024 (MILLION SQUARE METERS)
- TABLE 57 INDIA: PHOTOVOLTAIC (PV) FILMS MARKET, BY APPLICATION, 2025-2030 (MILLION SQUARE METERS)
- TABLE 58 SOUTH KOREA: PHOTOVOLTAIC (PV) FILMS MARKET, BY APPLICATION, 2021-2024 (USD MILLION)
- TABLE 59 SOUTH KOREA: PHOTOVOLTAIC (PV) FILMS MARKET, BY APPLICATION, 2025-2030 (USD MILLION)
- TABLE 60 SOUTH KOREA: PHOTOVOLTAIC (PV) FILMS MARKET, BY APPLICATION, 2021-2024 (MILLION SQUARE METERS)
- TABLE 61 SOUTH KOREA: PHOTOVOLTAIC (PV) FILMS MARKET, BY APPLICATION, 2025-2030 (MILLION SQUARE METERS)
- TABLE 62 TAIWAN: PHOTOVOLTAIC (PV) FILMS MARKET, BY APPLICATION, 2021-2024 (USD MILLION)
- TABLE 63 TAIWAN: PHOTOVOLTAIC (PV) FILMS MARKET, BY APPLICATION, 2025-2030 (USD MILLION)
- TABLE 64 TAIWAN: PHOTOVOLTAIC (PV) FILMS MARKET, BY APPLICATION, 2021-2024 (MILLION SQUARE METERS)
- TABLE 65 TAIWAN: PHOTOVOLTAIC (PV) FILMS MARKET, BY APPLICATION, 2025-2030 (MILLION SQUARE METERS)
- TABLE 66 REST OF ASIA PACIFIC: PHOTOVOLTAIC (PV) FILMS MARKET, BY APPLICATION, 2021-2024 (USD MILLION)
- TABLE 67 REST OF ASIA PACIFIC: PHOTOVOLTAIC (PV) FILMS MARKET, BY APPLICATION, 2025-2030 (USD MILLION)
- TABLE 68 REST OF ASIA PACIFIC: PHOTOVOLTAIC (PV) FILMS MARKET, BY APPLICATION, 2021-2024 (MILLION SQUARE METERS)
- TABLE 69 REST OF ASIA PACIFIC: PHOTOVOLTAIC (PV) FILMS MARKET, BY APPLICATION, 2025-2030 (MILLION SQUARE METERS)
- TABLE 70 NORTH AMERICA: PHOTOVOLTAIC (PV) FILMS MARKET, BY COUNTRY, 2021-2024 (USD MILLION)
- TABLE 71 NORTH AMERICA: PHOTOVOLTAIC (PV) FILMS MARKET, BY COUNTRY, 2025-2030 (USD MILLION)
- TABLE 72 NORTH AMERICA: PHOTOVOLTAIC (PV) FILMS MARKET, BY COUNTRY, 2021-2024 (MILLION SQUARE METERS)
- TABLE 73 NORTH AMERICA: PHOTOVOLTAIC (PV) FILMS MARKET, BY COUNTRY, 2025-2030 (MILLION SQUARE METERS)
- TABLE 74 NORTH AMERICA: PHOTOVOLTAIC (PV) FILMS MARKET, BY RAW MATERIAL, 2021-2024 (USD MILLION)
- TABLE 75 NORTH AMERICA: PHOTOVOLTAIC (PV) FILMS MARKET, BY RAW MATERIAL, 2025-2030 (USD MILLION)
- TABLE 76 NORTH AMERICA: PHOTOVOLTAIC (PV) FILMS MARKET, BY RAW MATERIAL, 2021-2024 (MILLION SQUARE METERS)
- TABLE 77 NORTH AMERICA: PHOTOVOLTAIC (PV) FILMS MARKET, BY RAW MATERIAL, 2025-2030 (MILLION SQUARE METERS)
- TABLE 78 NORTH AMERICA: PHOTOVOLTAIC (PV) FILMS MARKET, BY APPLICATION, 2021-2024 (USD MILLION)
- TABLE 79 NORTH AMERICA: PHOTOVOLTAIC (PV) FILMS MARKET, BY APPLICATION, 2025-2030 (USD MILLION)
- TABLE 80 NORTH AMERICA: PHOTOVOLTAIC (PV) FILMS MARKET, BY APPLICATION, 2021-2024 (MILLION SQUARE METERS)
- TABLE 81 NORTH AMERICA: PHOTOVOLTAIC (PV) FILMS MARKET, BY APPLICATION, 2025-2030 (MILLION SQUARE METERS)
- TABLE 82 US: PHOTOVOLTAIC (PV) FILMS MARKET, BY APPLICATION, 2021-2024 (USD MILLION)
- TABLE 83 US: PHOTOVOLTAIC (PV) FILMS MARKET, BY APPLICATION, 2025-2030 (USD MILLION)
- TABLE 84 US: PHOTOVOLTAIC (PV) FILMS MARKET, BY APPLICATION, 2021-2024 (MILLION SQUARE METERS)
- TABLE 85 US: PHOTOVOLTAIC (PV) FILMS MARKET, BY APPLICATION, 2025-2030 (MILLION SQUARE METERS)
- TABLE 86 CANADA: PHOTOVOLTAIC (PV) FILMS MARKET, BY APPLICATION, 2021-2024 (USD MILLION)
- TABLE 87 CANADA: PHOTOVOLTAIC (PV) FILMS MARKET, BY APPLICATION, 2025-2030 (USD MILLION)
- TABLE 88 CANADA: PHOTOVOLTAIC (PV) FILMS MARKET, BY APPLICATION, 2021-2024 (MILLION SQUARE METERS)
- TABLE 89 CANADA: PHOTOVOLTAIC (PV) FILMS MARKET, BY APPLICATION, 2025-2030 (MILLION SQUARE METERS)
- TABLE 90 MEXICO: PHOTOVOLTAIC (PV) FILMS MARKET, BY APPLICATION, 2021-2024 (USD MILLION)
- TABLE 91 MEXICO: PHOTOVOLTAIC (PV) FILMS MARKET, BY APPLICATION, 2025-2030 (USD MILLION)
- TABLE 92 MEXICO: PHOTOVOLTAIC (PV) FILMS MARKET, BY APPLICATION, 2021-2024 (MILLION SQUARE METERS)
- TABLE 93 MEXICO: PHOTOVOLTAIC (PV) FILMS MARKET, BY APPLICATION, 2025-2030 (MILLION SQUARE METERS)
- TABLE 94 EUROPE: PHOTOVOLTAIC (PV) FILMS MARKET, BY COUNTRY, 2021-2024 (USD MILLION)
- TABLE 95 EUROPE: PHOTOVOLTAIC (PV) FILMS MARKET, BY COUNTRY, 2025-2030 (USD MILLION)
- TABLE 96 EUROPE: PHOTOVOLTAIC (PV) FILMS MARKET, BY COUNTRY, 2021-2024 (MILLION SQUARE METERS)
- TABLE 97 EUROPE: PHOTOVOLTAIC (PV) FILMS MARKET, BY COUNTRY, 2025-2030 (MILLION SQUARE METERS)
- TABLE 98 EUROPE: PHOTOVOLTAIC (PV) FILMS MARKET, BY RAW MATERIAL, 2021-2024 (USD MILLION)
- TABLE 99 EUROPE: PHOTOVOLTAIC (PV) FILMS MARKET, BY RAW MATERIAL, 2025-2030 (USD MILLION)
- TABLE 100 EUROPE: PHOTOVOLTAIC (PV) FILMS MARKET, BY RAW MATERIAL, 2021-2024 (MILLION SQUARE METERS)
- TABLE 101 EUROPE: PHOTOVOLTAIC (PV) FILMS MARKET, BY RAW MATERIAL, 2025-2030 (MILLION SQUARE METERS)
- TABLE 102 EUROPE: PHOTOVOLTAIC (PV) FILMS MARKET, BY APPLICATION, 2021-2024 (USD MILLION)
- TABLE 103 EUROPE: PHOTOVOLTAIC (PV) FILMS MARKET, BY APPLICATION, 2025-2030 (USD MILLION)
- TABLE 104 EUROPE: PHOTOVOLTAIC (PV) FILMS MARKET, BY APPLICATION, 2021-2024 (MILLION SQUARE METERS)
- TABLE 105 EUROPE: PHOTOVOLTAIC (PV) FILMS MARKET, BY APPLICATION, 2025-2030 (MILLION SQUARE METERS)
- TABLE 106 GERMANY: PHOTOVOLTAIC (PV) FILMS MARKET, BY APPLICATION, 2021-2024 (USD MILLION)
- TABLE 107 GERMANY: PHOTOVOLTAIC (PV) FILMS MARKET, BY APPLICATION, 2025-2030 (USD MILLION)
- TABLE 108 GERMANY: PHOTOVOLTAIC (PV) FILMS MARKET, BY APPLICATION, 2021-2024 (MILLION SQUARE METERS)
- TABLE 109 GERMANY: PHOTOVOLTAIC (PV) FILMS MARKET, BY APPLICATION, 2025-2030 (MILLION SQUARE METERS)
- TABLE 110 ITALY: PHOTOVOLTAIC (PV) FILMS MARKET, BY APPLICATION, 2021-2024 (USD MILLION)
- TABLE 111 ITALY: PHOTOVOLTAIC (PV) FILMS MARKET, BY APPLICATION, 2025-2030 (USD MILLION)
- TABLE 112 ITALY: PHOTOVOLTAIC (PV) FILMS MARKET, BY APPLICATION, 2021-2024 (MILLION SQUARE METERS)
- TABLE 113 ITALY: PHOTOVOLTAIC (PV) FILMS MARKET, BY APPLICATION, 2025-2030 (MILLION SQUARE METERS)
- TABLE 114 FRANCE: PHOTOVOLTAIC (PV) FILMS MARKET, BY APPLICATION, 2021-2024 (USD MILLION)
- TABLE 115 FRANCE: PHOTOVOLTAIC (PV) FILMS MARKET, BY APPLICATION, 2025-2030 (USD MILLION)
- TABLE 116 FRANCE: PHOTOVOLTAIC (PV) FILMS MARKET, BY APPLICATION, 2021-2024 (MILLION SQUARE METERS)
- TABLE 117 FRANCE: PHOTOVOLTAIC (PV) FILMS MARKET, BY APPLICATION, 2025-2030 (MILLION SQUARE METERS)
- TABLE 118 UK: PHOTOVOLTAIC (PV) FILMS MARKET, BY APPLICATION, 2021-2024 (USD MILLION)
- TABLE 119 UK: PHOTOVOLTAIC (PV) FILMS MARKET, BY APPLICATION, 2025-2030 (USD MILLION)
- TABLE 120 UK: PHOTOVOLTAIC (PV) FILMS MARKET, BY APPLICATION, 2021-2024 (MILLION SQUARE METERS)
- TABLE 121 UK: PHOTOVOLTAIC (PV) FILMS MARKET, BY APPLICATION, 2025-2030 (MILLION SQUARE METERS)
- TABLE 122 SPAIN: PHOTOVOLTAIC (PV) FILMS MARKET, BY APPLICATION, 2021-2024 (USD MILLION)
- TABLE 123 SPAIN: PHOTOVOLTAIC (PV) FILMS MARKET, BY APPLICATION, 2025-2030 (USD MILLION)
- TABLE 124 SPAIN: PHOTOVOLTAIC (PV) FILMS MARKET, BY APPLICATION, 2021-2024 (MILLION SQUARE METERS)
- TABLE 125 SPAIN: PHOTOVOLTAIC (PV) FILMS MARKET, BY APPLICATION, 2025-2030 (MILLION SQUARE METERS)
- TABLE 126 RUSSIA: PHOTOVOLTAIC (PV) FILMS MARKET, BY APPLICATION, 2021-2024 (USD MILLION)
- TABLE 127 RUSSIA: PHOTOVOLTAIC (PV) FILMS MARKET, BY APPLICATION, 2025-2030 (USD MILLION)
- TABLE 128 RUSSIA: PHOTOVOLTAIC (PV) FILMS MARKET, BY APPLICATION, 2021-2024 (MILLION SQUARE METERS)
- TABLE 129 RUSSIA: PHOTOVOLTAIC (PV) FILMS MARKET, BY APPLICATION, 2025-2030 (MILLION SQUARE METERS)
- TABLE 130 REST OF EUROPE: PHOTOVOLTAIC (PV) FILMS MARKET, BY APPLICATION, 2021-2024 (USD MILLION)
- TABLE 131 REST OF EUROPE: PHOTOVOLTAIC (PV) FILMS MARKET, BY APPLICATION, 2025-2030 (USD MILLION)
- TABLE 132 REST OF EUROPE: PHOTOVOLTAIC (PV) FILMS MARKET, BY APPLICATION, 2021-2024 (MILLION SQUARE METERS)
- TABLE 133 REST OF EUROPE: PHOTOVOLTAIC (PV) FILMS MARKET, BY APPLICATION, 2025-2030 (MILLION SQUARE METERS)
- TABLE 134 ROW: PHOTOVOLTAIC (PV) FILMS MARKET, BY COUNTRY, 2021-2024 (USD MILLION)
- TABLE 135 ROW: PHOTOVOLTAIC (PV) FILMS MARKET, BY COUNTRY, 2025-2030 (USD MILLION)
- TABLE 136 ROW: PHOTOVOLTAIC (PV) FILMS MARKET, BY COUNTRY, 2021-2024 (MILLION SQUARE METERS)
- TABLE 137 ROW: PHOTOVOLTAIC (PV) FILMS MARKET, BY COUNTRY, 2025-2030 (MILLION SQUARE METERS)
- TABLE 138 ROW: PHOTOVOLTAIC (PV) FILMS MARKET, BY RAW MATERIAL, 2021-2024 (USD MILLION)
- TABLE 139 ROW: PHOTOVOLTAIC (PV) FILMS MARKET, BY RAW MATERIAL, 2025-2030 (USD MILLION)
- TABLE 140 ROW: PHOTOVOLTAIC (PV) FILMS MARKET, BY RAW MATERIAL, 2021-2024 (MILLION SQUARE METERS)
- TABLE 141 ROW: PHOTOVOLTAIC (PV) FILMS MARKET, BY RAW MATERIAL, 2025-2030 (MILLION SQUARE METERS)
- TABLE 142 ROW: PHOTOVOLTAIC (PV) FILMS MARKET, BY APPLICATION, 2021-2024 (USD MILLION)
- TABLE 143 ROW: PHOTOVOLTAIC (PV) FILMS MARKET, BY APPLICATION, 2025-2030 (USD MILLION)
- TABLE 144 ROW: PHOTOVOLTAIC (PV) FILMS MARKET, BY APPLICATION, 2021-2024 (MILLION SQUARE METERS)
- TABLE 145 ROW: PHOTOVOLTAIC (PV) FILMS MARKET, BY APPLICATION, 2025-2030 (MILLION SQUARE METERS)
- TABLE 146 SAUDI ARABIA: PHOTOVOLTAIC (PV) FILMS MARKET, BY APPLICATION, 2021-2024 (USD MILLION)
- TABLE 147 SAUDI ARABIA: PHOTOVOLTAIC (PV) FILMS MARKET, BY APPLICATION, 2025-2030 (USD MILLION)
- TABLE 148 SAUDI ARABIA: PHOTOVOLTAIC (PV) FILMS MARKET, BY APPLICATION, 2021-2024 (MILLION SQUARE METERS)
- TABLE 149 SAUDI ARABIA: PHOTOVOLTAIC (PV) FILMS MARKET, BY APPLICATION, 2025-2030 (MILLION SQUARE METERS)
- TABLE 150 UAE: PHOTOVOLTAIC (PV) FILMS MARKET, BY APPLICATION, 2021-2024 (USD MILLION)
- TABLE 151 UAE: PHOTOVOLTAIC (PV) FILMS MARKET, BY APPLICATION, 2025-2030 (USD MILLION)
- TABLE 152 UAE: PHOTOVOLTAIC (PV) FILMS MARKET, BY APPLICATION, 2021-2024 (MILLION SQUARE METERS)
- TABLE 153 UAE: PHOTOVOLTAIC (PV) FILMS MARKET, BY APPLICATION, 2025-2030 (MILLION SQUARE METERS)
- TABLE 154 OMAN: PHOTOVOLTAIC (PV) FILMS MARKET, BY APPLICATION, 2021-2024 (USD MILLION)
- TABLE 155 OMAN: PHOTOVOLTAIC (PV) FILMS MARKET, BY APPLICATION, 2025-2030 (USD MILLION)
- TABLE 156 OMAN: PHOTOVOLTAIC (PV) FILMS MARKET, BY APPLICATION, 2021-2024 (MILLION SQUARE METERS)
- TABLE 157 OMAN: PHOTOVOLTAIC (PV) FILMS MARKET, BY APPLICATION, 2025-2030 (MILLION SQUARE METERS)
- TABLE 158 EGYPT: PHOTOVOLTAIC (PV) FILMS MARKET, BY APPLICATION, 2021-2024 (USD MILLION)
- TABLE 159 EGYPT: PHOTOVOLTAIC (PV) FILMS MARKET, BY APPLICATION, 2025-2030 (USD MILLION)
- TABLE 160 EGYPT: PHOTOVOLTAIC (PV) FILMS MARKET, BY APPLICATION, 2021-2024 (MILLION SQUARE METERS)
- TABLE 161 EGYPT: PHOTOVOLTAIC (PV) FILMS MARKET, BY APPLICATION, 2025-2030 (MILLION SQUARE METERS)
- TABLE 162 SOUTH AFRICA: PHOTOVOLTAIC (PV) FILMS MARKET, BY APPLICATION, 2021-2024 (USD MILLION)
- TABLE 163 SOUTH AFRICA: PHOTOVOLTAIC (PV) FILMS MARKET, BY APPLICATION, 2025-2030 (USD MILLION)
- TABLE 164 SOUTH AFRICA: PHOTOVOLTAIC (PV) FILMS MARKET, BY APPLICATION, 2021-2024 (MILLION SQUARE METERS)
- TABLE 165 SOUTH AFRICA: PHOTOVOLTAIC (PV) FILMS MARKET, BY APPLICATION, 2025-2030 (MILLION SQUARE METERS)
- TABLE 166 OTHERS IN ROW: PHOTOVOLTAIC (PV) FILMS MARKET, BY APPLICATION, 2021-2024 (USD MILLION)
- TABLE 167 OTHERS IN ROW: PHOTOVOLTAIC (PV) FILMS MARKET, BY APPLICATION, 2025-2030 (USD MILLION)
- TABLE 168 OTHERS IN ROW: PHOTOVOLTAIC (PV) FILMS MARKET, BY APPLICATION, 2021-2024 (MILLION SQUARE METERS)
- TABLE 169 OTHERS IN ROW: PHOTOVOLTAIC (PV) FILMS MARKET, BY APPLICATION, 2025-2030 (MILLION SQUARE METERS)
- TABLE 170 PHOTOVOLTAIC (PV) FILMS MARKET: OVERVIEW OF STRATEGIES ADOPTED BY KEY PLAYERS
- TABLE 171 PHOTOVOLTAIC (PV) FILMS MARKET: DEGREE OF COMPETITION, 2024
- TABLE 172 PHOTOVOLTAIC (PV) FILMS MARKET: REGION FOOTPRINT
- TABLE 173 PHOTOVOLTAIC (PV) FILMS MARKET: RAW MATERIAL FOOTPRINT
- TABLE 174 PHOTOVOLTAIC (PV) FILMS MARKET: APPLICATION FOOTPRINT
- TABLE 175 PHOTOVOLTAIC (PV) FILMS MARKET: DETAILED LIST OF KEY STARTUPS/SMES
- TABLE 176 PHOTOVOLTAIC (PV) FILMS MARKET: COMPETITIVE BENCHMARKING OF KEY STARTUPS/SMES (1/2)
- TABLE 177 PHOTOVOLTAIC (PV) FILMS MARKET: COMPETITIVE BENCHMARKING OF KEY STARTUPS/SMES (2/2)
- TABLE 178 PHOTOVOLTAIC (PV) FILMS MARKET: PRODUCT LAUNCHES, JANUARY 2021-MAY 2025
- TABLE 179 PHOTOVOLTAIC (PV) FILMS MARKET: DEALS, JANUARY 2021-MAY 2025
- TABLE 180 PHOTOVOLTAIC (PV) FILMS MARKET: EXPANSIONS, JANUARY 2021-MAY 2025
- TABLE 181 PHOTOVOLTAIC (PV) FILMS MARKET: OTHERS, JANUARY 2021-MAY 2025
- TABLE 182 H.B. FULLER COMPANY: COMPANY OVERVIEW
- TABLE 183 H.B. FULLER COMPANY: PRODUCTS/SOLUTIONS/SERVICES OFFERED
- TABLE 184 H.B. FULLER COMPANY: DEALS
- TABLE 185 3M: COMPANY OVERVIEW
- TABLE 186 3M: PRODUCTS/SOLUTIONS/SERVICES OFFERED
- TABLE 187 KURARAY CO., LTD.: COMPANY OVERVIEW
- TABLE 188 KURARAY CO., LTD.: PRODUCTS/SOLUTIONS/SERVICES OFFERED
- TABLE 189 JA SOLAR TECHNOLOGY CO., LTD.: COMPANY OVERVIEW
- TABLE 190 JA SOLAR TECHNOLOGY CO., LTD.: PRODUCTS/SOLUTIONS/SERVICES OFFERED
- TABLE 191 BOREALIS GMBH: COMPANY OVERVIEW
- TABLE 192 BOREALIS GMBH: PRODUCTS/SOLUTIONS/SERVICES OFFERED
- TABLE 193 JIANGSU SVECK PHOTOVOLTAIC NEW MATERIAL CO., LTD.: COMPANY OVERVIEW
- TABLE 194 JIANGSU SVECK PHOTOVOLTAIC NEW MATERIAL CO., LTD.: PRODUCT/SOLUTIONS/SERVICES OFFERED
- TABLE 195 JIANGSU SVECK PHOTOVOLTAIC NEW MATERIAL CO., LTD.: DEALS
- TABLE 196 JIANGSU SVECK PHOTOVOLTAIC NEW MATERIAL CO., LTD.: EXPANSIONS
- TABLE 197 JIANGSU SVECK PHOTOVOLTAIC NEW MATERIAL CO., LTD.: OTHERS
- TABLE 198 HANGZHOU FIRST APPLIED MATERIAL CO., LTD.: COMPANY OVERVIEW
- TABLE 199 HANGZHOU FIRST APPLIED MATERIAL CO., LTD.: PRODUCTS/SOLUTIONS/ SERVICES OFFERED
- TABLE 200 HANGZHOU FIRST APPLIED MATERIAL CO., LTD.: EXPANSIONS
- TABLE 201 HANGZHOU FIRST APPLIED MATERIAL CO., LTD.: OTHERS
- TABLE 202 SHANGHAI HIUV NEW MATERIALS CO., LTD.: COMPANY OVERVIEW
- TABLE 203 SHANGHAI HIUV NEW MATERIALS CO., LTD.: PRODUCTS/SOLUTIONS/ SERVICES OFFERED
- TABLE 204 SHANGHAI HIUV NEW MATERIALS CO., LTD.: OTHERS
- TABLE 205 GUANGZHOU LUSHAN NEW MATERIALS CO., LTD.: COMPANY OVERVIEW
- TABLE 206 GUANGZHOU LUSHAN NEW MATERIALS CO., LTD.: PRODUCTS/SOLUTIONS/ SERVICES OFFERED
- TABLE 207 BETTERIAL: COMPANY OVERVIEW
- TABLE 208 BETTERIAL: PRODUCTS/SOLUTIONS/SERVICES OFFERED
- TABLE 209 BETTERIAL: PRODUCT LAUNCHES
- TABLE 210 BETTERIAL: DEALS
- TABLE 211 BETTERIAL: OTHERS
- TABLE 212 MITSUI CHEMICALS, INC.: COMPANY OVERVIEW
- TABLE 213 MITSUI CHEMICALS, INC.: PRODUCTS/SOLUTIONS/SERVICES OFFERED
- TABLE 214 MITSUI CHEMICALS, INC.: EXPANSIONS
- TABLE 215 MITSUI CHEMICALS, INC.: OTHERS
- TABLE 216 HANWHA GROUP: COMPANY OVERVIEW
- TABLE 217 HANWHA GROUP: PRODUCTS/SOLUTIONS/SERVICES OFFERED
- TABLE 218 HANWHA GROUP: DEALS
- TABLE 219 HANWHA GROUP: EXPANSIONS
- TABLE 220 ZHEJIANG SINOPONT TECHNOLOGY CO., LTD.: COMPANY OVERVIEW
- TABLE 221 ZHEJIANG SINOPONT TECHNOLOGY CO., LTD.: PRODUCTS/SOLUTIONS/ SERVICES OFFERED
- TABLE 222 ZHEJIANG SINOPONT TECHNOLOGY CO., LTD.: EXPANSIONS
- TABLE 223 CYBRID TECHNOLOGIES INC.: COMPANY OVERVIEW
- TABLE 224 CYBRID TECHNOLOGIES INC.: PRODUCTS/SOLUTIONS/SERVICES OFFERED
- TABLE 225 CYBRID TECHNOLOGIES INC.: DEALS
- TABLE 226 CYBRID TECHNOLOGIES INC.: OTHERS
- TABLE 227 SATINAL SPA: COMPANY OVERVIEW
- TABLE 228 LUCENT CLEANENERGY: COMPANY OVERVIEW
- TABLE 229 THE COMPOUND COMPANY: COMPANY OVERVIEW
- TABLE 230 DR. HANS WERNER CHEMIKALIEN: COMPANY OVERVIEW
- TABLE 231 FILMTEC: COMPANY OVERVIEW
- TABLE 232 CROWN ADVANCED MATERIAL CO., LTD.: COMPANY OVERVIEW
- TABLE 233 HANGZHOU XINDONGKE ENERGY TECHNOLOGY CO., LTD: COMPANY OVERVIEW
- TABLE 234 FELIX NONWOVENS: COMPANY OVERVIEW
- TABLE 235 HUIZHOU BAOJUN MATERIAL TECHNOLOGY CO., LTD: COMPANY OVERVIEW
- TABLE 236 DANA POLY, INC.: COMPANY OVERVIEW
- TABLE 237 VISHAKHA RENEWABLES PVT. LTD.: COMPANY OVERVIEW
- TABLE 238 NOVOPOLYMERS: COMPANY OVERVIEW
- TABLE 239 ENRICH ENCAP PVT. LTD.: COMPANY OVERVIEW
- TABLE 240 ZHEJIANG FEIYU NEW ENERGY CO., LTD.: COMPANY OVERVIEW
- TABLE 241 FUYIN GROUP: COMPANY OVERVIEW
List of Figures
- FIGURE 1 PHOTOVOLTAIC (PV) FILMS MARKET: SEGMENTATION AND REGIONAL SCOPE
- FIGURE 2 PHOTOVOLTAIC (PV) FILMS MARKET: RESEARCH DESIGN
- FIGURE 3 MARKET SIZE ESTIMATION METHODOLOGY: SUPPLY-SIDE APPROACH
- FIGURE 4 MARKET SIZE ESTIMATION METHODOLOGY: DEMAND-SIDE APPROACH
- FIGURE 5 MARKET SIZE ESTIMATION METHODOLOGY: REVENUE OF MARKET PLAYERS
- FIGURE 6 MARKET SIZE ESTIMATION METHODOLOGY: BOTTOM-UP APPROACH
- FIGURE 7 MARKET SIZE ESTIMATION METHODOLOGY: TOP-DOWN APPROACH
- FIGURE 8 PHOTOVOLTAIC (PV) FILMS MARKET: DATA TRIANGULATION
- FIGURE 9 PVB SEGMENT TO DOMINATE MARKET IN 2030
- FIGURE 10 GROUND-MOUNTED PV SEGMENT TO HOLD LARGER MARKET SHARE IN 2030
- FIGURE 11 ASIA PACIFIC TO REGISTER HIGHEST CAGR IN PHOTOVOLTAIC (PV) FILMS MARKET DURING FORECAST PERIOD
- FIGURE 12 GROWING USE OF PHOTOVOLTAIC (PV) FILMS IN GROUND-MOUNTED PV APPLICATIONS TO CREATE LUCRATIVE OPPORTUNITIES FOR MARKET PLAYERS
- FIGURE 13 POE SEGMENT TO REGISTER HIGHEST CAGR DURING FORECAST PERIOD
- FIGURE 14 GROUND-MOUNTED PV SEGMENT TO REGISTER HIGHER CAGR DURING FORECAST PERIOD
- FIGURE 15 CHINA TO BE FASTEST-GROWING MARKET FOR PHOTOVOLTAIC (PV) FILMS DURING FORECAST PERIOD
- FIGURE 16 PHOTOVOLTAIC (PV) FILMS MARKET: DRIVERS, RESTRAINTS, OPPORTUNITIES, AND CHALLENGES
- FIGURE 17 USE OF GENERATIVE AI IN PHOTOVOLTAIC (PV) FILMS MARKET
- FIGURE 18 TRENDS/DISRUPTIONS INFLUENCING CUSTOMER BUSINESS
- FIGURE 19 PHOTOVOLTAIC (PV) FILMS MARKET: SUPPLY CHAIN ANALYSIS
- FIGURE 20 PHOTOVOLTAIC (PV) FILMS MARKET: INVESTMENT AND FUNDING SCENARIO, 2021 VS. 2022 (USD MILLION)
- FIGURE 21 AVERAGE SELLING PRICE TREND OF PV FILMS, BY REGION, 2021-2024 (USD/SQUARE METERS)
- FIGURE 22 AVERAGE SELLING PRICE TREND OF PV FILMS OFFERED BY KEY PLAYERS, BY RAW MATERIAL, 2024 (USD/SQUARE METERS)
- FIGURE 23 PHOTOVOLTAIC (PV) FILMS MARKET: ECOSYSTEM ANALYSIS
- FIGURE 24 PATENTS GRANTED PER YEAR, 2015-2024
- FIGURE 25 PHOTOVOLTAIC (PV) FILMS MARKET: LEGAL STATUS OF PATENTS, 2015-2024
- FIGURE 26 PATENTS ANALYSIS FOR PHOTOVOLTAIC (PV) FILMS, BY JURISDICTION, 2015-2024
- FIGURE 27 TOP 10 COMPANIES WITH HIGHEST PERCENTAGE OF PATENTS IN LAST 10 YEARS
- FIGURE 28 IMPORT DATA FOR HS CODE 392010-COMPLIANT PRODUCTS, BY COUNTRY, 2021-2024 (USD THOUSAND)
- FIGURE 29 EXPORT DATA FOR HS CODE 392010-COMPLIANT PRODUCTS, BY COUNTRY, 2021-2024 (USD THOUSAND)
- FIGURE 30 PHOTOVOLTAIC (PV) FILMS MARKET: PORTER'S FIVE FORCES ANALYSIS
- FIGURE 31 INFLUENCE OF STAKEHOLDERS ON BUYING PROCESS, BY APPLICATION
- FIGURE 32 KEY BUYING CRITERIA, BY APPLICATION
- FIGURE 33 PVB SEGMENT TO LEAD PHOTOVOLTAIC (PV) FILMS MARKET IN 2025
- FIGURE 34 GROUND-MOUNTED PV SEGMENT TO HOLD LARGER SHARE OF PHOTOVOLTAIC (PV) FILMS MARKET IN 2025
- FIGURE 35 ASIA PACIFIC TO BE FASTEST-GROWING MARKET DURING FORECAST PERIOD
- FIGURE 36 ASIA PACIFIC: PHOTOVOLTAIC (PV) FILMS MARKET SNAPSHOT
- FIGURE 37 NORTH AMERICA: PHOTOVOLTAIC (PV) FILMS MARKET SNAPSHOT
- FIGURE 38 EUROPE: PHOTOVOLTAIC (PV) FILMS MARKET SNAPSHOT
- FIGURE 39 PHOTOVOLTAIC (PV) FILMS MARKET SHARE ANALYSIS, 2024
- FIGURE 40 PHOTOVOLTAIC (PV) FILMS MARKET: REVENUE ANALYSIS OF KEY COMPANIES, 2021-2025 (USD BILLION)
- FIGURE 41 PHOTOVOLTAIC (PV) FILMS MARKET: COMPANY EVALUATION MATRIX (KEY PLAYERS), 2024
- FIGURE 42 PHOTOVOLTAIC (PV) FILMS MARKET: COMPANY FOOTPRINT
- FIGURE 43 PHOTOVOLTAIC (PV) FILMS MARKET: COMPANY EVALUATION MATRIX (STARTUPS/SMES), 2024
- FIGURE 44 PHOTOVOLTAIC (PV) FILMS MARKET: BRAND/PRODUCT COMPARATIVE ANALYSIS
- FIGURE 45 PHOTOVOLTAIC (PV) FILMS MARKET: EV/EBITDA OF KEY COMPANIES
- FIGURE 46 PHOTOVOLTAIC (PV) FILMS MARKET: YEAR-TO-DATE (YTD) PRICE TOTAL RETURN
- FIGURE 47 H.B. FULLER COMPANY: COMPANY SNAPSHOT
- FIGURE 48 3M: COMPANY SNAPSHOT
- FIGURE 49 KURARAY CO., LTD.: COMPANY SNAPSHOT
- FIGURE 50 JA SOLAR TECHNOLOGY CO., LTD.: COMPANY SNAPSHOT
- FIGURE 51 BOREALIS GMBH: COMPANY SNAPSHOT
- FIGURE 52 HANGZHOU FIRST APPLIED MATERIAL CO., LTD.: COMPANY SNAPSHOT
- FIGURE 53 MITSUI CHEMICALS, INC.: COMPANY SNAPSHOT
- FIGURE 54 HANWHA GROUP: COMPANY SNAPSHOT

