
PUBLISHER: MarketsandMarkets | PRODUCT CODE: 1793326
PUBLISHER: MarketsandMarkets | PRODUCT CODE: 1793326
UV LED Market by UV-A, UV-B, UV-C, UV Curing (Printing, Adhesives), Disinfection, Medical & Scientific (Equipment Sterilization, Tanning, Teeth Brightening), Security, Lithography, Power Output (Less than 1w, 1W-5W, Above 5W) Global - Forecast to 2030
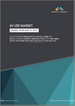
The UV LED Market is projected at USD 1.23 billion in 2025 and is likely to reach USD 2.16 billion by 2030 with a CAGR of 11.9% during the forecast period.
| Scope of the Report | |
|---|---|
| Years Considered for the Study | 2021-2030 |
| Base Year | 2024 |
| Forecast Period | 2025-2030 |
| Units Considered | Value (USD Billion) |
| Segments | By technology, power output, application, end user, and region |
| Regions covered | North America, Europe, APAC, RoW |
The growing demand for UV LEDs is primarily driven by their application in disinfection, sterilization, and curing processes. These LEDs offer significant advantages over traditional UV lamps, including lower power consumption, longer lifespan, and reduced environmental impact.
"By technology, the UV-C technology segment is expected to hold a significant share of the UV LED market during the forecast period."
UV-C technology is expected to hold a significant share of the UV LED market during the forecast period due to its strong germicidal properties, increasing demand for chemical-free disinfection, and rising use in water and air purification systems. Strong germicidal properties make UV-C highly effective at killing or inactivating viruses, bacteria, and other pathogens, making it the preferred choice for disinfection across healthcare, industrial, and residential sectors. The growing demand for chemical-free disinfection is accelerating the shift toward UV-C LEDs, as they offer a safer and more environmentally friendly alternative to traditional chemical-based methods such as chlorine. Furthermore, the integration of UV-C LEDs into water filters, HVAC systems, and portable sanitizers is rising due to their compact size, energy efficiency, and ability to neutralize harmful microorganisms. These features ensure reliable and sustainable purification, contributing to the growing adoption of UV-C technology in diverse applications.
"By application, disinfection segment is expected to register the highest CAGR in the UV LED market during the forecast period."
During the forecast period, the disinfection segment is expected to register the highest CAGR in the UV LED market due to growing awareness of hygiene and infection control, increasing demand for chemical-free sterilization solutions, and rising integration of UV-C LEDs in healthcare and consumer applications. Growing awareness of hygiene and infection control increases the demand for effective and reliable disinfection solutions in public, healthcare, and residential settings, especially in the wake of global health concerns. The increasing demand for chemical-free sterilization promotes UV-C LEDs as a safe, eco-friendly, and residue-free alternative to traditional disinfection methods such as chlorine or alcohol-based chemicals. Furthermore, the rising integration of UV-C LEDs into healthcare and consumer products such as air purifiers, surface sanitizers, and water treatment systems broadens their application scope and accelerates adoption, significantly contributing to market growth.
"The US is expected to grow at the highest CAGR during the forecast period."
The US is expected to witness the highest CAGR in the UV LED market in North America during the forecast period due to rising demand for advanced disinfection technologies in healthcare, water treatment, and air purification. Increasing awareness of hygiene has accelerated the adoption of UV-C LED solutions. Additionally, strong government support for sustainable and energy-efficient technologies and ongoing R&D investments by key players are driving market growth. The presence of leading manufacturers and rapid adoption of UV curing in industries such as electronics and printing further boost the US market, positioning it as a major contributor to global expansion.
Extensive primary interviews were conducted with key industry experts in the UV LED Market space to determine and verify the market size for various segments and subsegments gathered through secondary research. The breakdown of primary participants for the report is shown below.
The study contains insights from various industry experts, from component suppliers to Tier 1 companies and OEMs. The break-up of the primaries is as follows:
- By Company Type - Tier 1 - 45%, Tier 2 - 35%, Tier 3 - 20%
- By Designation- C-level Executives - 40%, Directors - 30%, Others - 30%
- By Region - North America- 20%, Europe - 25%, Asia Pacific - 40%, RoW - 15%
The UV LED market is dominated by a few globally established players, such as Seoul Viosys Co., Ltd. (South Korea), NICHIA CORPORATION (Japan), STANLEY ELECTRIC CO., LTD. (Japan), ams-OSRAM AG (Austria), and Crystal IS, Inc. (US).
The study includes an in-depth competitive analysis of these key players in the UV LED Market, as well as their company profiles, recent developments, and key market strategies.
Research Coverage:
The report segments the UV LED Market and forecasts its size by application (UV Curving, Medical & Scientific, Disinfection, Security, Lithography, Other Applications), technology (UV-A, UV-B, UV-C), power output (Less Than 1W, 1-5W, Above 5W), and End User (Industrial, Commercial, Residential). It also discusses the market's drivers, restraints, opportunities, and challenges. It gives a detailed view of the market across regions (North America, Europe, Asia Pacific, RoW). The report includes a supply chain analysis of the key players and their competitive analysis in the UV LED ecosystem.
Key Benefits of Buying the Report:
- Analysis of key drivers (Longer operational life of UV LEDs compared with conventional UV lamps, Growing inclination toward eco-friendly products and implementation of stringent regulations regarding use of green products, Growing concern regarding safe drinking water in emerging nations, Higher benefits of UV curing systems than traditional curing systems), restraint (Lower cost of conventional disinfectants compared with UV lights, High cost and lack of awareness associated with UV coatings), opportunities (Increasing demand for ultrapure water, Expanding consumer electronics industry, Emerging applications of UV LEDs in automotive industry), challenges (Limited applications of UV LED technology compared with traditional UV lamps, Strict standards related to UV LED technology)
- Product Development/Innovation: Detailed insights into upcoming technologies, research and development activities, and new product launches in the UV LED Market
- Market Development: Comprehensive information about lucrative markets - the report analyses the UV LED Market across varied regions.
- Market Diversification: Exhaustive information about new products, untapped geographies, recent developments, and investments in the UV LED Market.
- Competitive Assessment: In-depth assessment of market shares, growth strategies, and service offerings of leading players, such as Seoul Viosys Co., Ltd. (South Korea), NICHIA CORPORATION (Japan), STANLEY ELECTRIC CO., LTD. (Japan), ams-OSRAM AG (Austria), and Crystal IS, Inc. (US) among others in the UV LED Market.
TABLE OF CONTENTS
1 INTRODUCTION
- 1.1 STUDY OBJECTIVES
- 1.2 MARKET DEFINITION
- 1.3 STUDY SCOPE
- 1.3.1 MARKETS COVERED
- 1.3.2 INCLUSIONS AND EXCLUSIONS
- 1.3.3 YEARS CONSIDERED
- 1.4 CURRENCY CONSIDERED
- 1.5 UNIT CONSIDERED
- 1.6 LIMITATIONS
- 1.7 STAKEHOLDERS
- 1.8 SUMMARY OF CHANGES
2 RESEARCH METHODOLOGY
- 2.1 INTRODUCTION
- 2.2 RESEARCH DATA
- 2.2.1 SECONDARY DATA
- 2.2.1.1 List of major secondary sources
- 2.2.1.2 Key data from secondary sources
- 2.2.2 PRIMARY DATA
- 2.2.2.1 List of primary interview participants
- 2.2.2.2 Breakdown of primaries
- 2.2.2.3 Key data from primary sources
- 2.2.2.4 Key industry insights
- 2.2.1 SECONDARY DATA
- 2.3 FACTOR ANALYSIS
- 2.3.1 SUPPLY-SIDE ANALYSIS
- 2.3.2 DEMAND-SIDE ANALYSIS
- 2.4 MARKET SIZE ESTIMATION METHODOLOGY
- 2.4.1 BOTTOM-UP APPROACH
- 2.4.1.1 Approach to arrive at market size using bottom-up analysis (demand side)
- 2.4.2 TOP-DOWN APPROACH
- 2.4.2.1 Approach to arrive at market size using top-down approach (supply side)
- 2.4.1 BOTTOM-UP APPROACH
- 2.5 MARKET BREAKDOWN AND DATA TRIANGULATION
- 2.6 RESEARCH LIMITATIONS
- 2.7 RISK ANALYSIS
3 EXECUTIVE SUMMARY
4 PREMIUM INSIGHTS
- 4.1 ATTRACTIVE GROWTH OPPORTUNITIES FOR PLAYERS IN UV LED MARKET
- 4.2 UV LED MARKET, BY UV CURING
- 4.3 UV LED MARKET FOR UV-A TECHNOLOGY, BY REGION
- 4.4 UV LED MARKET IN RESIDENTIAL END USER, BY REGION
- 4.5 UV LED MARKET IN ASIA PACIFIC, BY COUNTRY
- 4.6 UV LED MARKET, BY REGION
- 4.7 UV LED MARKET, BY COUNTRY
5 MARKET OVERVIEW
- 5.1 INTRODUCTION
- 5.2 MARKET DYNAMICS
- 5.2.1 DRIVERS
- 5.2.1.1 Regulatory push and environmental bans accelerating shift to mercury-free UV disinfection solutions
- 5.2.1.2 Rising integration of UV LEDs in in-vitro diagnostics (IVD) and lab equipment
- 5.2.1.3 Advancements in high-power and high-efficiency packaged UV-C LEDs
- 5.2.1.4 Miniaturization of UV LEDs for wearables and smart consumer devices
- 5.2.2 RESTRAINTS
- 5.2.2.1 High cost and lower output efficiency across UV LED spectrum
- 5.2.2.2 Limited standardization in performance metrics and reliability testing
- 5.2.3 OPPORTUNITIES
- 5.2.3.1 Increased use in robotic and autonomous disinfection systems
- 5.2.3.2 Adoption in compact air and water sterilization modules for appliances
- 5.2.3.3 Development of UV LED-based analytical instruments for food safety testing
- 5.2.4 CHALLENGES
- 5.2.4.1 Limited thermal tolerance and reliability issues in high-density UV LED arrays
- 5.2.1 DRIVERS
- 5.3 VALUE CHAIN ANALYSIS
- 5.4 ECOSYSTEM ANALYSIS
- 5.5 PRICING ANALYSIS
- 5.5.1 AVERAGE SELLING PRICE OF UV LEDS OFFERED BY KEY PLAYERS, BY TECHNOLOGY, 2024
- 5.5.2 AVERAGE SELLING PRICE TREND OF UV LED, 2021-2024
- 5.5.3 AVERAGE SELLING PRICE OF UV LEDS, BY REGION
- 5.5.4 AVERAGE SELLING PRICE OF UV LED, BY REGION
- 5.6 TRENDS/DISRUPTIONS IMPACTING CUSTOMERS' BUSINESSES
- 5.7 TECHNOLOGY ANALYSIS
- 5.7.1 KEY TECHNOLOGIES
- 5.7.1.1 AlGaN epitaxial growth and substrate engineering
- 5.7.1.2 Flip-chip packaging technology
- 5.7.2 COMPLEMENTARY TECHNOLOGIES
- 5.7.2.1 UV-LED curing systems
- 5.7.2.2 UV-transparent optical lenses/windows
- 5.7.3 ADJACENT TECHNOLOGIES
- 5.7.3.1 Microfluidic lab-on-chip systems
- 5.7.3.2 Deep-UV solid-state & frequency-doubled lasers (DUV, 405-261 nm)
- 5.7.1 KEY TECHNOLOGIES
- 5.8 PORTER'S FIVE FORCES ANALYSIS
- 5.8.1 THREAT OF NEW ENTRANTS
- 5.8.2 THREAT OF SUBSTITUTES
- 5.8.3 BARGAINING POWER OF SUPPLIERS
- 5.8.4 BARGAINING POWER OF BUYERS
- 5.8.5 INTENSITY OF COMPETITIVE RIVALRY
- 5.9 INVESTMENT AND FUNDING SCENARIO
- 5.10 KEY STAKEHOLDERS AND BUYING CRITERIA
- 5.10.1 KEY STAKEHOLDERS IN BUYING PROCESS
- 5.10.2 BUYING CRITERIA
- 5.11 CASE STUDY ANALYSIS
- 5.11.1 UV LED CURING SOLUTION FOR PCB PRINTING
- 5.11.2 UV LED DISINFECTION SYSTEM FOR OFF-GRID DRINKING WATER
- 5.11.3 UV CURING SYSTEM FOR POLYJET
- 5.12 TRADE ANALYSIS
- 5.13 PATENT ANALYSIS
- 5.14 KEY CONFERENCES AND EVENTS, 2025-2026
- 5.15 TARIFF AND REGULATORY LANDSCAPE
- 5.15.1 TARIFF ANALYSIS
- 5.15.2 REGULATORY BODIES, GOVERNMENT AGENCIES, AND OTHER ORGANIZATIONS
- 5.15.3 STANDARDS
- 5.16 IMPACT OF AI/GENERATIVE AI ON UV LED MARKET
- 5.17 IMPACT OF 2025 US TARIFF ON UV LED MARKET
- 5.17.1 INTRODUCTION
- 5.17.2 KEY TARIFF RATES
- 5.17.3 PRICE IMPACT ANALYSIS
- 5.17.4 IMPACT ON COUNTRIES/REGIONS
- 5.17.4.1 US
- 5.17.4.2 Europe
- 5.17.4.3 Asia Pacific
- 5.17.5 IMPACT ON INDUSTRIES
6 UV LED MARKET, BY TECHNOLOGY
- 6.1 INTRODUCTION
- 6.2 UV-A
- 6.2.1 RISING ADOPTION IN ELECTRONICS, AUTOMOTIVE, PACKAGING, AND PRINTING INDUSTRIES TO DRIVE DEMAND
- 6.3 UV-B
- 6.3.1 ADOPTION IN TREATMENT OF CHRONIC SKIN CONDITIONS SUCH AS PSORIASIS AND VITILIGO TO DRIVE MARKET
- 6.4 UV-C
- 6.4.1 GROWING DEMAND FOR EFFECTIVE DISINFECTION AND STERILIZATION SOLUTIONS TO DRIVE MARKET
7 UV LED MARKET, BY POWER OUTPUT
- 7.1 INTRODUCTION
- 7.2 LESS THAN 1 W
- 7.2.1 INCREASING DEMAND IN PORTABLE AND COMPACT SYSTEMS TO DRIVE MARKET
- 7.3 1-5 W
- 7.3.1 GROWING USE IN INDUSTRIAL SURFACE CURING, INKJET PRINTING, AND MID-POWER DISINFECTION TO DRIVE MARKET
- 7.4 ABOVE 5 W
- 7.4.1 EXPANDING INDUSTRIAL AND MUNICIPAL ADOPTION OF HIGH-POWER UV-C LEDS FOR STERILIZATION TO FUEL DEMAND
8 UV LED MARKET, BY APPLICATION
- 8.1 INTRODUCTION
- 8.2 UV CURING
- 8.2.1 GROWING DEMAND FOR ENERGY-EFFICIENT AND ECO-FRIENDLY CURING SOLUTIONS FUELING ADOPTION
- 8.2.2 PRINTING/3D PRINTING
- 8.2.2.1 Demand for instant-cure technology driving adoption in advanced printing solutions
- 8.2.3 COATING
- 8.2.3.1 Growing focus on eco-friendly, low-heat curing boosting demand
- 8.2.4 ADHESIVES
- 8.2.4.1 Increasing need for fast and reliable bonding to drive demand in adhesive curing processes
- 8.3 MEDICAL & SCIENTIFIC
- 8.3.1 RISING USE IN DISINFECTION AND PHOTOTHERAPY FUELING MARKET GROWTH
- 8.3.2 PHOTOTHERAPY
- 8.3.2.1 Growing demand for non-invasive skin treatments fueling segmental growth
- 8.3.3 SENSING
- 8.3.3.1 Offers energy-efficient light sources for sensor applications
- 8.3.4 EQUIPMENT STERILIZATION
- 8.3.4.1 Rising focus on infection control and hygiene driving demand
- 8.3.5 RESEARCH & DEVELOPMENT
- 8.3.5.1 Increasing need for reliable and stable illumination driving adoption in lab equipment
- 8.3.6 TEETH BRIGHTENING
- 8.3.6.1 Growing trend toward fast and safe oral aesthetic treatments driving demand
- 8.3.7 TANNING
- 8.3.7.1 Rising preference for safer UV exposure alternatives fueling demand
- 8.4 DISINFECTION
- 8.4.1 INCREASING NEED FOR COMPACT AND ECO-FRIENDLY DISINFECTION TECHNOLOGIES BOOSTING MARKET GROWTH
- 8.4.2 WATER DISINFECTION
- 8.4.2.1 Rising demand for safe and chemical-free drinking water driving adoption
- 8.4.3 AIR DISINFECTION
- 8.4.3.1 Increasing emphasis on infection prevention in enclosed spaces boosting deployment in HVAC systems
- 8.4.4 SURFACE DISINFECTION
- 8.4.4.1 Shift toward eco-friendly cleaning methods fueling demand
- 8.5 SECURITY
- 8.5.1 INCREASING FOCUS ON PRODUCT TRACEABILITY AND FRAUD PREVENTION FUELING MARKET GROWTH
- 8.5.2 COUNTERFEIT DETECTION (MONEY AND ID)
- 8.5.2.1 Growing need for counterfeit detection and document authentication driving market growth
- 8.5.3 FORENSIC
- 8.5.3.1 Rising demand for non-intrusive forensic tools to increase adoption in law enforcement and investigation
- 8.6 LITHOGRAPHY
- 8.6.1 RISING DEMAND FOR HIGH-PRECISION PATTERNING DRIVING ADOPTION
- 8.7 OTHER APPLICATIONS
9 UV LED MARKET, BY END USER
- 9.1 INTRODUCTION
- 9.2 INDUSTRIAL
- 9.2.1 INCREASING DEMAND FOR UV TECHNOLOGY IN MANUFACTURING SECTOR TO DRIVE MARKET
- 9.3 COMMERCIAL
- 9.3.1 RISING DEMAND FOR HYGIENE AND STERILIZATION IN HIGH-TRAFFIC COMMERCIAL SPACES DRIVING ADOPTION
- 9.4 RESIDENTIAL
- 9.4.1 RISING DEMAND FOR HYGIENIC LIVING CONDITIONS AND COMPACT DISINFECTION SOLUTIONS DRIVING ADOPTION
10 UV LED MARKET, BY REGION
- 10.1 INTRODUCTION
- 10.2 NORTH AMERICA
- 10.2.1 MACROECONOMIC OUTLOOK FOR NORTH AMERICA
- 10.2.2 US
- 10.2.2.1 Rising focus on sustainable disinfection accelerates market growth
- 10.2.3 CANADA
- 10.2.3.1 Growing demand for clean water and air quality strengthening UV LED deployment
- 10.2.4 MEXICO
- 10.2.4.1 Increasing environmental awareness fueling adoption of UV LEDs
- 10.3 EUROPE
- 10.3.1 MACROECONOMIC OUTLOOK FOR EUROPE
- 10.3.2 UK
- 10.3.2.1 Rising adoption in public infrastructure and smart sanitation to accelerate market growth
- 10.3.3 GERMANY
- 10.3.3.1 Increasing shift toward UV LED modules in CleanTech landscape to drive market
- 10.3.4 FRANCE
- 10.3.4.1 Rising demand for UV LED packages in healthcare and agriculture sectors to drive market
- 10.3.5 ITALY
- 10.3.5.1 Increasing demand in disinfection and food industries to support market growth
- 10.3.6 SPAIN
- 10.3.6.1 Rising application of UV LED modules in disinfection ecosystem fueling demand
- 10.4 REST OF EUROPE
- 10.5 ASIA PACIFIC
- 10.5.1 MACROECONOMIC OUTLOOK FOR ASIA PACIFIC
- 10.5.2 CHINA
- 10.5.2.1 Rising demand in industrial and disinfection applications to fuel market growth
- 10.5.3 JAPAN
- 10.5.3.1 Growing focus on UV LED innovation and exports to drive market
- 10.5.4 SOUTH KOREA
- 10.5.4.1 Growing demand in semiconductor & display sector to propel market
- 10.5.5 TAIWAN
- 10.5.5.1 Expanding UV LED applications in PCB manufacturing and surface treatment to drive market
- 10.5.6 INDIA
- 10.5.6.1 Government push for UV-based sanitation driving market growth
- 10.5.7 REST OF ASIA PACIFIC
- 10.6 ROW
- 10.6.1 MACROECONOMIC OUTLOOK FOR ROW
- 10.6.2 SOUTH AMERICA
- 10.6.2.1 Rising demand in manufacturing and public health infrastructure to drive market
- 10.6.3 MIDDLE EAST & AFRICA
- 10.6.3.1 Clean water and healthcare needs driving adoption
- 10.6.3.2 GCC countries
- 10.6.3.3 Rest of Middle East & Africa
11 COMPETITIVE LANDSCAPE
- 11.1 OVERVIEW
- 11.2 KEY PLAYER STRATEGIES/RIGHT TO WIN, 2021-2024
- 11.3 MARKET SHARE ANALYSIS, 2024
- 11.4 REVENUE ANALYSIS, 2021-2024
- 11.5 COMPANY VALUATION AND FINANCIAL METRICS, 2025
- 11.6 BRAND COMPARISON
- 11.7 COMPANY EVALUATION MATRIX: KEY PLAYERS, 2024
- 11.7.1 STARS
- 11.7.2 EMERGING LEADERS
- 11.7.3 PERVASIVE PLAYERS
- 11.7.4 PARTICIPANTS
- 11.7.5 COMPANY FOOTPRINT: KEY PLAYERS, 2024
- 11.7.5.1 Company footprint
- 11.7.5.2 Region footprint
- 11.7.5.3 Technology footprint
- 11.7.5.4 Application footprint
- 11.7.5.5 End user footprint
- 11.8 COMPANY EVALUATION MATRIX: STARTUPS/SMES, 2024
- 11.8.1 PROGRESSIVE COMPANIES
- 11.8.2 RESPONSIVE COMPANIES
- 11.8.3 DYNAMIC COMPANIES
- 11.8.4 STARTING BLOCKS
- 11.8.5 COMPETITIVE BENCHMARKING: STARTUPS/SMES, 2024
- 11.8.5.1 Detailed list of key startups/SMEs
- 11.8.5.2 Competitive benchmarking of key startups/SMEs
- 11.9 COMPETITIVE SCENARIO
- 11.9.1 PRODUCT LAUNCHES/DEVELOPMENTS
- 11.9.2 DEALS
12 COMPANY PROFILES
- 12.1 KEY PLAYERS
- 12.1.1 SEOUL VIOSYS CO., LTD.
- 12.1.1.1 Business overview
- 12.1.1.2 Products/Solutions/Services offered
- 12.1.1.3 Recent developments
- 12.1.1.3.1 Deals
- 12.1.1.4 MnM view
- 12.1.1.4.1 Key strengths
- 12.1.1.4.2 Strategic choices
- 12.1.1.4.3 Weaknesses and competitive threats
- 12.1.2 NICHIA CORPORATION
- 12.1.2.1 Business overview
- 12.1.2.2 Products/Solutions/Services offered
- 12.1.2.3 Recent developments
- 12.1.2.3.1 Product launches
- 12.1.2.4 MnM view
- 12.1.2.4.1 Key strengths
- 12.1.2.4.2 Strategic choices
- 12.1.2.4.3 Weaknesses and competitive threats
- 12.1.3 STANLEY ELECTRIC CO., LTD.
- 12.1.3.1 Business overview
- 12.1.3.2 Products/Solutions/Services offered
- 12.1.3.3 Recent developments
- 12.1.3.3.1 Product launches
- 12.1.3.4 MnM view
- 12.1.3.4.1 Key strengths
- 12.1.3.4.2 Strategic choices
- 12.1.3.4.3 Weaknesses and competitive threats
- 12.1.4 AMS-OSRAM AG
- 12.1.4.1 Business overview
- 12.1.4.2 Products/Solutions/Services offered
- 12.1.4.3 Recent developments
- 12.1.4.3.1 Product launches
- 12.1.4.3.2 Deals
- 12.1.4.4 MnM view
- 12.1.4.4.1 Key strengths
- 12.1.4.4.2 Strategic choices
- 12.1.4.4.3 Weaknesses and competitive threats
- 12.1.5 CRYSTAL IS, INC.
- 12.1.5.1 Business overview
- 12.1.5.2 Products/Solutions/Services offered
- 12.1.5.3 Recent developments
- 12.1.5.3.1 Deals
- 12.1.5.4 MnM view
- 12.1.5.4.1 Key strengths
- 12.1.5.4.2 Strategic choices
- 12.1.5.4.3 Weaknesses and competitive threats
- 12.1.6 EVERLIGHT ELECTRONICS CO., LTD.
- 12.1.6.1 Business overview
- 12.1.6.2 Products/Solutions/Services offered
- 12.1.6.3 Recent developments
- 12.1.6.3.1 Product launches
- 12.1.7 BROADCOM
- 12.1.7.1 Business overview
- 12.1.7.2 Products/Services/Solutions offered
- 12.1.8 LITE-ON TECHNOLOGY, INC.
- 12.1.8.1 Business overview
- 12.1.8.2 Products/Solutions/Services offered
- 12.1.9 LUMINUS, INC.
- 12.1.9.1 Business overview
- 12.1.9.2 Products/Solutions/Services offered
- 12.1.9.3 Recent developments
- 12.1.9.3.1 Product launches
- 12.1.10 BOLB INC.
- 12.1.10.1 Business overview
- 12.1.10.2 Products/Solutions/Services offered
- 12.1.1 SEOUL VIOSYS CO., LTD.
- 12.2 OTHER PLAYERS
- 12.2.1 TSLC
- 12.2.2 VIOLUMAS
- 12.2.3 HOUKEM
- 12.2.4 VISHAY INTERTECHNOLOGY, INC.
- 12.2.5 INTERNATIONAL LIGHT TECHNOLOGIES INC.
- 12.2.6 KRISHNA SMART TECHNOLOGY
- 12.2.7 LEDESTAR OPTO-ELECTRONICS TECH. CO., LTD.
- 12.2.8 MARKTECH OPTOELECTRONICS INC.
- 12.2.9 BOSTON ELECTRONICS CORPORATION
- 12.2.10 EPIGAP OSA PHOTONICS GMBH
- 12.2.11 SHENZHEN DESHENGXING ELECTRONICS CO., LTD.
- 12.2.12 LUMIXTAR
- 12.2.13 LUCKYLIGHT ELECTRONICS CO., LTD.
- 12.2.14 WURTH ELEKTRONIK EISOS GMBH & CO. KG
- 12.2.15 IBT GROUP
13 APPENDIX
- 13.1 INSIGHTS FROM INDUSTRY EXPERTS
- 13.2 DISCUSSION GUIDE
- 13.3 KNOWLEDGESTORE: MARKETSANDMARKETS' SUBSCRIPTION PORTAL
- 13.4 CUSTOMIZATION OPTIONS
- 13.5 RELATED REPORTS
- 13.6 AUTHOR DETAILS
List of Tables
- TABLE 1 UV LED MARKET: INCLUSIONS AND EXCLUSIONS
- TABLE 2 LIST OF MAJOR SECONDARY SOURCES
- TABLE 3 LIST OF PRIMARY INTERVIEW PARTICIPANTS
- TABLE 4 UV LED MARKET: RISK ANALYSIS
- TABLE 5 UV LED MARKET: ROLE OF PLAYERS IN ECOSYSTEM
- TABLE 6 AVERAGE SELLING PRICE OF UV LED OFFERED BY KEY PLAYERS, BY TECHNOLOGY
- TABLE 7 AVERAGE SELLING PRICE TREND OF UV LED, BY REGION, 2021-2024 (USD)
- TABLE 8 UV LED MARKET: IMPACT OF PORTER'S FIVE FORCES
- TABLE 9 INFLUENCE OF STAKEHOLDERS ON BUYING PROCESS FOR TOP THREE APPLICATIONS (%)
- TABLE 10 KEY BUYING CRITERIA FOR TOP THREE APPLICATIONS
- TABLE 11 PHOSEON'S UV LED CURING SYSTEM OPTIMIZED PCB PRINTING FOR BELONG ELECTRONICS
- TABLE 12 AQUISENSE PARTNERS WITH BOSAQ TO INCORPORATE UV-C LED IN THE SOLARAQ SYSTEM
- TABLE 13 PHOSEON TECHNOLOGY PROVIDED UV CURING TECHNOLOGY TO POLYJET FOR INCREASING PRINT ACCURACY
- TABLE 14 IMPORT DATA FOR HS CODE 853949-COMPLIANT PRODUCTS, BY COUNTRY, 2021-2024 (USD MILLION)
- TABLE 15 EXPORT DATA FOR HS CODE 853949-COMPLIANT PRODUCTS, BY COUNTRY, 2021-2024 (USD MILLION)
- TABLE 16 UV LED MARKET: KEY PATENTS, 2020-2024
- TABLE 17 UV LED MARKET: CONFERENCES AND EVENTS
- TABLE 18 MFN TARIFF FOR HS CODE 853949-COMPLIANT PRODUCTS, 2024
- TABLE 19 AMERICAS: REGULATORY BODIES, GOVERNMENT AGENCIES, AND OTHER ORGANIZATIONS
- TABLE 20 EUROPE: REGULATORY BODIES, GOVERNMENT AGENCIES, AND OTHER ORGANIZATIONS
- TABLE 21 ASIA PACIFIC: REGULATORY BODIES, GOVERNMENT AGENCIES, AND OTHER ORGANIZATIONS
- TABLE 22 ROW: REGULATORY BODIES, GOVERNMENT AGENCIES, AND OTHER ORGANIZATIONS
- TABLE 23 UV LED: CODES AND STANDARDS
- TABLE 24 US ADJUSTED RECIPROCAL TARIFF RATES
- TABLE 25 UV LED MARKET, BY TECHNOLOGY, 2021-2024 (USD MILLION)
- TABLE 26 UV LED MARKET, BY TECHNOLOGY, 2025-2030 (USD MILLION)
- TABLE 27 UV LED MARKET, BY TECHNOLOGY, 2021-2024 (MILLION UNITS)
- TABLE 28 UV LED MARKET, BY TECHNOLOGY, 2025-2030 (MILLION UNITS)
- TABLE 29 UV-A: UV LED MARKET, BY REGION, 2021-2024 (USD MILLION)
- TABLE 30 UV-A: UV LED MARKET, BY REGION, 2025-2030 (USD MILLION)
- TABLE 31 UV-B: UV LED MARKET, BY REGION, 2021-2024 (USD MILLION)
- TABLE 32 UV-B: UV LED MARKET, BY REGION, 2025-2030 (USD MILLION)
- TABLE 33 UV-C: UV LED MARKET, BY REGION, 2021-2024 (USD MILLION)
- TABLE 34 UV-C: UV LED MARKET, BY REGION, 2025-2030 (USD MILLION)
- TABLE 35 UV LED MARKET, BY POWER OUTPUT, 2021-2024 (USD MILLION)
- TABLE 36 UV LED MARKET, BY POWER OUTPUT, 2025-2030 (USD MILLION)
- TABLE 37 UV LED MARKET, BY APPLICATION, 2021-2024 (USD MILLION)
- TABLE 38 UV LED MARKET, BY APPLICATION, 2025-2030 (USD MILLION)
- TABLE 39 UV CURING: UV LED MARKET, BY REGION, 2021-2024 (USD MILLION)
- TABLE 40 UV CURING: UV LED MARKET, BY REGION, 2025-2030 (USD MILLION)
- TABLE 41 UV CURING: UV LED MARKET, BY TYPE, 2021-2024 (USD MILLION)
- TABLE 42 UV CURING: UV LED MARKET, BY TYPE, 2025-2030 (USD MILLION)
- TABLE 43 MEDICAL & SCIENTIFIC: UV LED MARKET, BY REGION, 2021-2024 (USD MILLION)
- TABLE 44 MEDICAL & SCIENTIFIC: UV LED MARKET, BY REGION, 2025-2030 (USD MILLION)
- TABLE 45 MEDICAL & SCIENTIFIC: UV LED MARKET, BY TYPE, 2021-2024 (USD MILLION)
- TABLE 46 MEDICAL & SCIENTIFIC: UV LED MARKET, BY TYPE, 2025-2030 (USD MILLION)
- TABLE 47 DISINFECTION: UV LED MARKET, BY REGION, 2021-2024 (USD MILLION)
- TABLE 48 DISINFECTION: UV LED MARKET, BY REGION, 2025-2030 (USD MILLION)
- TABLE 49 DISINFECTION: UV LED MARKET, BY TYPE, 2021-2024 (USD MILLION)
- TABLE 50 DISINFECTION: UV LED MARKET, BY TYPE, 2025-2030 (USD MILLION)
- TABLE 51 SECURITY: UV LED MARKET, BY REGION, 2021-2024 (USD MILLION)
- TABLE 52 SECURITY: UV LED MARKET, BY REGION, 2025-2030 (USD MILLION)
- TABLE 53 SECURITY: UV LED MARKET, BY TYPE, 2021-2024 (USD MILLION)
- TABLE 54 SECURITY: UV LED MARKET, BY TYPE, 2025-2030 (USD MILLION)
- TABLE 55 LITHOGRAPHY: UV LED MARKET, BY REGION, 2021-2024 (USD MILLION)
- TABLE 56 LITHOGRAPHY: UV LED MARKET, BY REGION, 2025-2030 (USD MILLION)
- TABLE 57 OTHER APPLICATIONS: UV LED MARKET, BY REGION, 2021-2024 (USD MILLION)
- TABLE 58 OTHER APPLICATIONS: UV LED MARKET, BY REGION, 2025-2030 (USD MILLION)
- TABLE 59 UV LED MARKET, BY END USER, 2021-2024 (USD MILLION)
- TABLE 60 UV LED MARKET, BY END USER, 2025-2030 (USD MILLION)
- TABLE 61 INDUSTRIAL: UV LED MARKET, BY REGION, 2021-2024 (USD MILLION)
- TABLE 62 INDUSTRIAL: UV LED MARKET, BY REGION, 2025-2030 (USD MILLION)
- TABLE 63 INDUSTRIAL: UV LED MARKET IN NORTH AMERICA, BY COUNTRY, 2021-2024 (USD MILLION)
- TABLE 64 INDUSTRIAL: UV LED MARKET IN NORTH AMERICA, BY COUNTRY, 2025-2030 (USD MILLION)
- TABLE 65 INDUSTRIAL: UV LED MARKET IN EUROPE, BY COUNTRY, 2021-2024 (USD MILLION)
- TABLE 66 INDUSTRIAL: UV LED MARKET IN EUROPE, BY COUNTRY, 2025-2030 (USD MILLION)
- TABLE 67 INDUSTRIAL: UV LED MARKET IN ASIA PACIFIC, BY COUNTRY, 2021-2024 (USD MILLION)
- TABLE 68 INDUSTRIAL: UV LED MARKET IN ASIA PACIFIC, BY COUNTRY, 2025-2030 (USD MILLION)
- TABLE 69 INDUSTRIAL: UV LED MARKET IN ROW, BY REGION, 2021-2024 (USD MILLION)
- TABLE 70 INDUSTRIAL: UV LED MARKET IN ROW, BY REGION, 2025-2030 (USD MILLION)
- TABLE 71 COMMERCIAL: UV LED MARKET, BY REGION, 2021-2024 (USD MILLION)
- TABLE 72 COMMERCIAL: UV LED MARKET, BY REGION, 2025-2030 (USD MILLION)
- TABLE 73 COMMERCIAL: UV LED MARKET IN NORTH AMERICA, BY COUNTRY, 2021-2024 (USD MILLION)
- TABLE 74 COMMERCIAL: UV LED MARKET IN NORTH AMERICA, BY COUNTRY, 2025-2030 (USD MILLION)
- TABLE 75 COMMERCIAL: UV LED MARKET IN EUROPE, BY COUNTRY, 2021-2024 (USD MILLION)
- TABLE 76 COMMERCIAL: UV LED MARKET IN EUROPE, BY COUNTRY, 2025-2030 (USD MILLION)
- TABLE 77 COMMERCIAL: UV LED MARKET IN ASIA PACIFIC, BY COUNTRY, 2021-2024 (USD MILLION)
- TABLE 78 COMMERCIAL: UV LED MARKET IN ASIA PACIFIC, BY COUNTRY, 2025-2030 (USD MILLION)
- TABLE 79 COMMERCIAL: UV LED MARKET IN ROW, BY REGION, 2021-2024 (USD MILLION)
- TABLE 80 COMMERCIAL: UV LED MARKET IN ROW, BY REGION, 2025-2030 (USD MILLION)
- TABLE 81 RESIDENTIAL: UV LED MARKET, BY REGION, 2021-2024 (USD MILLION)
- TABLE 82 RESIDENTIAL: UV LED MARKET, BY REGION, 2025-2030 (USD MILLION)
- TABLE 83 RESIDENTIAL: UV LED MARKET IN NORTH AMERICA, BY COUNTRY, 2021-2024 (USD MILLION)
- TABLE 84 RESIDENTIAL: UV LED MARKET IN NORTH AMERICA, BY COUNTRY, 2025-2030 (USD MILLION)
- TABLE 85 RESIDENTIAL: UV LED MARKET IN EUROPE, BY COUNTRY, 2021-2024 (USD MILLION)
- TABLE 86 RESIDENTIAL: UV LED MARKET IN EUROPE, BY COUNTRY, 2025-2030 (USD MILLION)
- TABLE 87 RESIDENTIAL: UV LED MARKET IN ASIA PACIFIC, BY COUNTRY, 2021-2024 (USD MILLION)
- TABLE 88 RESIDENTIAL: UV LED MARKET IN ASIA PACIFIC, BY COUNTRY, 2025-2030 (USD MILLION)
- TABLE 89 RESIDENTIAL: UV LED MARKET IN ROW, BY REGION, 2021-2024 (USD MILLION)
- TABLE 90 RESIDENTIAL: UV LED MARKET IN ROW, BY REGION, 2025-2030 (USD MILLION)
- TABLE 91 UV LED MARKET, BY REGION, 2021-2024 (USD MILLION)
- TABLE 92 UV LED MARKET, BY REGION, 2025-2030 (USD MILLION)
- TABLE 93 NORTH AMERICA: UV LED MARKET, BY COUNTRY, 2021-2024 (USD MILLION)
- TABLE 94 NORTH AMERICA: UV LED MARKET, BY COUNTRY, 2025-2030 (USD MILLION)
- TABLE 95 NORTH AMERICA: UV LED MARKET, BY TECHNOLOGY, 2021-2024 (USD MILLION)
- TABLE 96 NORTH AMERICA: UV LED MARKET, BY TECHNOLOGY, 2025-2030 (USD MILLION)
- TABLE 97 NORTH AMERICA: UV LED MARKET, BY APPLICATION, 2021-2024 (USD MILLION)
- TABLE 98 NORTH AMERICA: UV LED MARKET, BY APPLICATION, 2025-2030 (USD MILLION)
- TABLE 99 NORTH AMERICA: UV LED MARKET, BY END USER, 2021-2024 (USD MILLION)
- TABLE 100 NORTH AMERICA: UV LED MARKET, BY END USER, 2025-2030 (USD MILLION)
- TABLE 101 US: UV LED MARKET, BY APPLICATION, 2021-2024 (USD MILLION)
- TABLE 102 US: UV LED MARKET, BY APPLICATION, 2025-2030 (USD MILLION)
- TABLE 103 US: UV LED MARKET, BY END USER, 2021-2024 (USD MILLION)
- TABLE 104 US: UV LED MARKET, BY END USER, 2025-2030 (USD MILLION)
- TABLE 105 CANADA: UV LED MARKET, BY APPLICATION, 2021-2024 (USD MILLION)
- TABLE 106 CANADA: UV LED MARKET, BY APPLICATION, 2025-2030 (USD MILLION)
- TABLE 107 CANADA: UV LED MARKET, BY END USER, 2021-2024 (USD MILLION)
- TABLE 108 CANADA: UV LED MARKET, BY END USER, 2025-2030 (USD MILLION)
- TABLE 109 MEXICO: UV LED MARKET, BY APPLICATION, 2021-2024 (USD MILLION)
- TABLE 110 MEXICO: UV LED MARKET, BY APPLICATION, 2025-2030 (USD MILLION)
- TABLE 111 MEXICO: UV LED MARKET, BY END USER, 2021-2024 (USD MILLION)
- TABLE 112 MEXICO: UV LED MARKET, BY END USER, 2025-2030 (USD MILLION)
- TABLE 113 EUROPE: UV LED MARKET, BY COUNTRY, 2021-2024 (USD MILLION)
- TABLE 114 EUROPE: UV LED MARKET, BY COUNTRY, 2025-2030 (USD MILLION)
- TABLE 115 EUROPE: UV LED MARKET, BY TECHNOLOGY, 2021-2024 (USD MILLION)
- TABLE 116 EUROPE: UV LED MARKET, BY TECHNOLOGY, 2025-2030 (USD MILLION)
- TABLE 117 EUROPE: UV LED MARKET, BY APPLICATION, 2021-2024 (USD MILLION)
- TABLE 118 EUROPE: UV LED MARKET, BY APPLICATION, 2025-2030 (USD MILLION)
- TABLE 119 EUROPE: UV LED MARKET, BY END USER, 2021-2024 (USD MILLION)
- TABLE 120 EUROPE: UV LED MARKET, BY END USER, 2025-2030 (USD MILLION)
- TABLE 121 UK: UV LED MARKET, BY APPLICATION, 2021-2024 (USD MILLION)
- TABLE 122 UK: UV LED MARKET, BY APPLICATION, 2025-2030 (USD MILLION)
- TABLE 123 UK: UV LED MARKET, BY END USER, 2021-2024 (USD MILLION)
- TABLE 124 UK: UV LED MARKET, BY END USER, 2025-2030 (USD MILLION)
- TABLE 125 GERMANY: UV LED MARKET, BY APPLICATION, 2021-2024 (USD MILLION)
- TABLE 126 GERMANY: UV LED MARKET, BY APPLICATION, 2025-2030 (USD MILLION)
- TABLE 127 GERMANY: UV LED MARKET, BY END USER, 2021-2024 (USD MILLION)
- TABLE 128 GERMANY: UV LED MARKET, BY END USER, 2025-2030 (USD MILLION)
- TABLE 129 FRANCE: UV LED MARKET, BY APPLICATION, 2021-2024 (USD MILLION)
- TABLE 130 FRANCE: UV LED MARKET, BY APPLICATION, 2025-2030 (USD MILLION)
- TABLE 131 FRANCE: UV LED MARKET, BY END USER, 2021-2024 (USD MILLION)
- TABLE 132 FRANCE: UV LED MARKET, BY END USER, 2025-2030 (USD MILLION)
- TABLE 133 ITALY: UV LED MARKET, BY APPLICATION, 2021-2024 (USD MILLION)
- TABLE 134 ITALY: UV LED MARKET, BY APPLICATION, 2025-2030 (USD MILLION)
- TABLE 135 ITALY: UV LED MARKET, BY END USER, 2021-2024 (USD MILLION)
- TABLE 136 ITALY: UV LED MARKET, BY END USER, 2025-2030 (USD MILLION)
- TABLE 137 SPAIN: UV LED MARKET, BY APPLICATION, 2021-2024 (USD MILLION)
- TABLE 138 SPAIN: UV LED MARKET, BY APPLICATION, 2025-2030 (USD MILLION)
- TABLE 139 SPAIN: UV LED MARKET, BY END USER, 2021-2024 (USD MILLION)
- TABLE 140 SPAIN: UV LED MARKET, BY END USER, 2025-2030 (USD MILLION)
- TABLE 141 REST OF EUROPE: UV LED MARKET, BY APPLICATION, 2021-2024 (USD MILLION)
- TABLE 142 REST OF EUROPE: UV LED MARKET, BY APPLICATION, 2025-2030 (USD MILLION)
- TABLE 143 REST OF EUROPE: UV LED MARKET, BY END USER, 2021-2024 (USD MILLION)
- TABLE 144 REST OF EUROPE: UV LED MARKET, BY END USER, 2025-2030 (USD MILLION)
- TABLE 145 ASIA PACIFIC: UV LED MARKET, BY COUNTRY, 2021-2024 (USD MILLION)
- TABLE 146 ASIA PACIFIC: UV LED MARKET, BY COUNTRY, 2025-2030 (USD MILLION)
- TABLE 147 ASIA PACIFIC: UV LED MARKET, BY TECHNOLOGY, 2021-2024 (USD MILLION)
- TABLE 148 ASIA PACIFIC: UV LED MARKET, BY TECHNOLOGY, 2025-2030 (USD MILLION)
- TABLE 149 ASIA PACIFIC: UV LED MARKET, BY APPLICATION, 2021-2024 (USD MILLION)
- TABLE 150 ASIA PACIFIC: UV LED MARKET, BY APPLICATION, 2025-2030 (USD MILLION)
- TABLE 151 ASIA PACIFIC: UV LED MARKET, BY END USER, 2021-2024 (USD MILLION)
- TABLE 152 ASIA PACIFIC: UV LED MARKET, BY END USER, 2025-2030 (USD MILLION)
- TABLE 153 CHINA: UV LED MARKET, BY APPLICATION, 2021-2024 (USD MILLION)
- TABLE 154 CHINA: UV LED MARKET, BY APPLICATION, 2025-2030 (USD MILLION)
- TABLE 155 CHINA: UV LED MARKET, BY END USER, 2021-2024 (USD MILLION)
- TABLE 156 CHINA: UV LED MARKET, BY END USER, 2025-2030 (USD MILLION)
- TABLE 157 JAPAN: UV LED MARKET, BY APPLICATION, 2021-2024 (USD MILLION)
- TABLE 158 JAPAN: UV LED MARKET, BY APPLICATION, 2025-2030 (USD MILLION)
- TABLE 159 JAPAN: UV LED MARKET, BY END USER, 2021-2024 (USD MILLION)
- TABLE 160 JAPAN: UV LED MARKET, BY END USER, 2025-2030 (USD MILLION)
- TABLE 161 SOUTH KOREA: UV LED MARKET, BY APPLICATION, 2021-2024 (USD MILLION)
- TABLE 162 SOUTH KOREA: UV LED MARKET, BY APPLICATION, 2025-2030 (USD MILLION)
- TABLE 163 SOUTH KOREA: UV LED MARKET, BY END USER, 2021-2024 (USD MILLION)
- TABLE 164 SOUTH KOREA: UV LED MARKET, BY END USER, 2025-2030 (USD MILLION)
- TABLE 165 TAIWAN: UV LED MARKET, BY APPLICATION, 2021-2024 (USD MILLION)
- TABLE 166 TAIWAN: UV LED MARKET, BY APPLICATION, 2025-2030 (USD MILLION)
- TABLE 167 TAIWAN: UV LED MARKET, BY END USER, 2021-2024 (USD MILLION)
- TABLE 168 TAIWAN: UV LED MARKET, BY END USER, 2025-2030 (USD MILLION)
- TABLE 169 INDIA: UV LED MARKET, BY APPLICATION, 2021-2024 (USD MILLION)
- TABLE 170 INDIA: UV LED MARKET, BY APPLICATION, 2025-2030 (USD MILLION)
- TABLE 171 INDIA: UV LED MARKET, BY END USER, 2021-2024 (USD MILLION)
- TABLE 172 INDIA: UV LED MARKET, BY END USER, 2025-2030 (USD MILLION)
- TABLE 173 REST OF ASIA PACIFIC: UV LED MARKET, BY APPLICATION, 2021-2024 (USD MILLION)
- TABLE 174 REST OF ASIA PACIFIC: UV LED MARKET, BY APPLICATION, 2025-2030 (USD MILLION)
- TABLE 175 REST OF ASIA PACIFIC: UV LED MARKET, BY END USER, 2021-2024 (USD MILLION)
- TABLE 176 REST OF ASIA PACIFIC: UV LED MARKET, BY END USER, 2025-2030 (USD MILLION)
- TABLE 177 ROW: UV LED MARKET, BY REGION, 2021-2024 (USD MILLION)
- TABLE 178 ROW: UV LED MARKET, BY REGION, 2025-2030 (USD MILLION)
- TABLE 179 ROW: UV LED MARKET, BY TECHNOLOGY, 2021-2024 (USD MILLION)
- TABLE 180 ROW: UV LED MARKET, BY TECHNOLOGY, 2025-2030 (USD MILLION)
- TABLE 181 ROW: UV LED MARKET, BY APPLICATION, 2021-2024 (USD MILLION)
- TABLE 182 ROW: UV LED MARKET, BY APPLICATION, 2025-2030 (USD MILLION)
- TABLE 183 ROW: UV LED MARKET, BY END USER, 2021-2024 (USD MILLION)
- TABLE 184 ROW: UV LED MARKET, BY END USER, 2025-2030 (USD MILLION)
- TABLE 185 SOUTH AMERICA: UV LED MARKET, BY APPLICATION, 2021-2024 (USD MILLION)
- TABLE 186 SOUTH AMERICA: UV LED MARKET, BY APPLICATION, 2025-2030 (USD MILLION)
- TABLE 187 SOUTH AMERICA: UV LED MARKET, BY END USER, 2021-2024 (USD MILLION)
- TABLE 188 SOUTH AMERICA: UV LED MARKET, BY END USER, 2025-2030 (USD MILLION)
- TABLE 189 MIDDLE EAST & AFRICA: UV LED MARKET, BY REGION, 2021-2024 (USD MILLION)
- TABLE 190 MIDDLE EAST & AFRICA: UV LED MARKET, BY REGION, 2025-2030 (USD MILLION)
- TABLE 191 MIDDLE EAST & AFRICA: UV LED MARKET, BY APPLICATION, 2021-2024 (USD MILLION)
- TABLE 192 MIDDLE EAST & AFRICA: UV LED MARKET, BY APPLICATION, 2025-2030 (USD MILLION)
- TABLE 193 MIDDLE EAST & AFRICA: UV LED MARKET, BY END USER, 2021-2024 (USD MILLION)
- TABLE 194 MIDDLE EAST & AFRICA: UV LED MARKET, BY END USER, 2025-2030 (USD MILLION)
- TABLE 195 UV LED MARKET: OVERVIEW OF STRATEGIES ADOPTED BY KEY PLAYERS, 2021-2024
- TABLE 196 UV LED MARKET: DEGREE OF COMPETITION, 2024
- TABLE 197 UV LED MARKET: REGION FOOTPRINT
- TABLE 198 UV LED MARKET: TECHNOLOGY FOOTPRINT
- TABLE 199 UV LED MARKET: APPLICATION FOOTPRINT
- TABLE 200 UV LED MARKET: END USER FOOTPRINT
- TABLE 201 UV LED MARKET: DETAILED LIST OF KEY STARTUPS/SMES
- TABLE 202 UV LED MARKET: COMPETITIVE BENCHMARKING OF KEY STARTUPS/SMES
- TABLE 203 UV LED MARKET: PRODUCT LAUNCHES/DEVELOPMENTS, MARCH 2020-OCTOBER 2024
- TABLE 204 UV LED MARKET: DEALS, MARCH 2020-OCTOBER 2024
- TABLE 205 SEOUL VIOSYS CO., LTD.: COMPANY OVERVIEW
- TABLE 206 SEOUL VIOSYS CO., LTD.: PRODUCTS/SOLUTIONS/SERVICES OFFERED
- TABLE 207 SEOUL VIOSYS CO., LTD.: DEALS
- TABLE 208 NICHIA CORPORATION: COMPANY OVERVIEW
- TABLE 209 NICHIA CORPORATION: PRODUCTS/SOLUTIONS/SERVICES OFFERED
- TABLE 210 NICHIA CORPORATION: PRODUCT LAUNCHES
- TABLE 211 STANLEY ELECTRIC CO., LTD.: COMPANY OVERVIEW
- TABLE 212 STANLEY ELECTRIC CO., LTD.: PRODUCTS/SOLUTIONS/SERVICES OFFERED
- TABLE 213 STANLEY ELECTRIC CO., LTD.: PRODUCT LAUNCHES
- TABLE 214 AMS-OSRAM AG: COMPANY OVERVIEW
- TABLE 215 AMS-OSRAM AG: PRODUCTS/SOLUTIONS/SERVICES OFFERED
- TABLE 216 AMS-OSRAM AG: PRODUCT LAUNCHES
- TABLE 217 AMS-OSRAM AG: DEALS
- TABLE 218 CRYSTAL IS, INC.: COMPANY OVERVIEW
- TABLE 219 CRYSTAL IS, INC.: PRODUCTS/SOLUTIONS/SERVICES OFFERED
- TABLE 220 CRYSTAL IS, INC.: DEALS
- TABLE 221 EVERLIGHT ELECTRONICS CO., LTD.: COMPANY OVERVIEW
- TABLE 222 EVERLIGHT ELECTRONICS CO., LTD.: PRODUCTS/SOLUTIONS/SERVICES OFFERED
- TABLE 223 EVERLIGHT ELECTRONICS CO., LTD.: PRODUCT LAUNCHES
- TABLE 224 BROADCOM: COMPANY OVERVIEW
- TABLE 225 BROADCOM: PRODUCTS/SERVICES/SOLUTIONS OFFERED
- TABLE 226 LITE-ON TECHNOLOGY CORPORATION: COMPANY OVERVIEW
- TABLE 227 LITE-ON TECHNOLOGY CORPORATION: PRODUCTS/SOLUTIONS/SERVICES OFFERED
- TABLE 228 LUMINUS, INC.: COMPANY OVERVIEW
- TABLE 229 LUMINUS, INC.: PRODUCTS/SOLUTIONS/SERVICES OFFERED
- TABLE 230 LUMINUS, INC.: PRODUCT LAUNCHES
- TABLE 231 BOLB INC.: COMPANY OVERVIEW
- TABLE 232 BOLB INC.: PRODUCTS/SOLUTIONS/SERVICES OFFERED
List of Figures
- FIGURE 1 UV LED MARKET SEGMENTATION & REGIONAL SCOPE
- FIGURE 2 UV LED MARKET: RESEARCH DESIGN
- FIGURE 3 UV LED MARKET: RESEARCH APPROACH
- FIGURE 4 KEY DATA FROM SECONDARY SOURCES
- FIGURE 5 BREAKDOWN OF PRIMARIES
- FIGURE 6 KEY DATA FROM PRIMARY SOURCES
- FIGURE 7 KEY INDUSTRY INSIGHTS
- FIGURE 8 REVENUE GENERATED FROM SALES OF UV LED
- FIGURE 9 UV LED MARKET: SUPPLY-SIDE ANALYSIS
- FIGURE 10 UV LED MARKET: BOTTOM-UP APPROACH
- FIGURE 11 UV LED MARKET: TOP-DOWN APPROACH
- FIGURE 12 UV LED MARKET: DATA TRIANGULATION
- FIGURE 13 UV LED MARKET, 2021-2030 (USD MILLION)
- FIGURE 14 DISINFECTION APPLICATION TO ACCOUNT FOR LARGEST SHARE OF UV LED MARKET FROM 2025 TO 2030
- FIGURE 15 RESIDENTIAL SEGMENT TO REGISTER HIGHEST CAGR FROM 2025 TO 2030
- FIGURE 16 UV-C TECHNOLOGY TO WITNESS HIGHEST CAGR DURING FORECAST PERIOD
- FIGURE 17 ABOVE 5W TO RECORD HIGHEST CAGR IN UV LED MARKET DURING FORECAST PERIOD
- FIGURE 18 ASIA PACIFIC TO RECORD HIGHEST CAGR IN UV LED MARKET FROM 2025 TO 2030
- FIGURE 19 SHIFT TOWARD ECO-FRIENDLY SOLUTIONS AND STRINGENT REGULATIONS FUELING UV LED MARKET GROWTH
- FIGURE 20 COATING TO ACCOUNT FOR LARGEST MARKET SHARE IN UV CURING APPLICATION DURING FORECAST PERIOD
- FIGURE 21 ASIA PACIFIC TO REGISTER HIGHEST CAGR IN UV-A TECHNOLOGY SEGMENT DURING FORECAST PERIOD
- FIGURE 22 ASIA PACIFIC TO CAPTURE LARGEST SHARE OF UV LED MARKET IN RESIDENTIAL SEGMENT
- FIGURE 23 CHINA TO ACCOUNT FOR LARGEST SHARE OF UV LED MARKET IN ASIA PACIFIC DURING FORECAST PERIOD
- FIGURE 24 ASIA PACIFIC TO BE LARGEST UV LED MARKET DURING FORECAST PERIOD
- FIGURE 25 CHINA TO RECORD HIGHEST CAGR IN GLOBAL UV LED MARKET DURING FORECAST PERIOD
- FIGURE 26 UV LED MARKET: DRIVERS, RESTRAINTS, OPPORTUNITIES, AND CHALLENGES
- FIGURE 27 UV LED MARKET: DRIVERS AND THEIR IMPACT
- FIGURE 28 UV LED MARKET: RESTRAINTS AND THEIR IMPACT
- FIGURE 29 UV LED MARKET: OPPORTUNITIES AND THEIR IMPACT
- FIGURE 30 UV LED MARKET: CHALLENGES AND THEIR IMPACT
- FIGURE 31 UV LED MARKET: VALUE CHAIN ANALYSIS
- FIGURE 32 UV LED MARKET: ECOSYSTEM ANALYSIS
- FIGURE 33 AVERAGE SELLING PRICE OF UV LEDS OFFERED BY KEY PLAYERS, BY TECHNOLOGY, 2024
- FIGURE 34 AVERAGE SELLING PRICE TREND OF UV LED, 2021-2024
- FIGURE 35 AVERAGE SELLING PRICE OF UV LEDS, BY REGION
- FIGURE 36 REVENUE SHIFT AND NEW REVENUE POCKETS FOR UV LED PROVIDERS
- FIGURE 37 UV LED MARKET: PORTER'S FIVE FORCES ANALYSIS
- FIGURE 38 UV LED MARKET: INVESTMENT AND FUNDING, 2021-2024 (USD MILLION)
- FIGURE 39 INFLUENCE OF STAKEHOLDERS ON BUYING PROCESS FOR TOP THREE APPLICATIONS
- FIGURE 40 KEY BUYING CRITERIA FOR TOP THREE APPLICATIONS
- FIGURE 41 IMPORT SCENARIO FOR HS CODE 853949-COMPLIANT PRODUCTS FOR KEY COUNTRIES (2021-2024)
- FIGURE 42 EXPORT SCENARIO FOR HS CODE 853949-COMPLIANT PRODUCTS FOR KEY COUNTRIES (2021-2024)
- FIGURE 43 NUMBER OF PATENTS GRANTED, 2015-2024
- FIGURE 44 IMPACT OF AI/GENERATIVE AI ON UV LED MARKET
- FIGURE 45 UV-C TECHNOLOGY TO CAPTURE LARGEST MARKET SHARE DURING FORECAST PERIOD
- FIGURE 46 1-5 W SEGMENT TO ACCOUNT FOR LARGEST MARKET SHARE DURING FORECAST PERIOD
- FIGURE 47 DISINFECTION APPLICATION TO CAPTURE LARGEST MARKET SHARE DURING FORECAST PERIOD
- FIGURE 48 COATING APPLICATION TO CAPTURE LARGEST MARKET SHARE DURING FORECAST PERIOD
- FIGURE 49 EQUIPMENT STERILIZATION TO ACCOUNT FOR LARGEST MARKET SHARE IN MEDICAL & SCIENTIFIC APPLICATION DURING FORECAST PERIOD
- FIGURE 50 WATER DISINFECTION TO ACCOUNT FOR LARGEST MARKET SHARE DURING FORECAST PERIOD
- FIGURE 51 COUNTERFEIT DETECTION TO ACCOUNT FOR LARGER MARKET SHARE IN SECURITY APPLICATION BY 2030
- FIGURE 52 ASIA PACIFIC TO DOMINATE UV LED MARKET IN LITHOGRAPHY APPLICATION DURING FORECAST PERIOD
- FIGURE 53 ASIA PACIFIC TO BE DOMINANT MARKET FOR UV LED IN OTHER APPLICATIONS SEGMENT DURING FORECAST PERIOD
- FIGURE 54 INDUSTRIAL SEGMENT TO CAPTURE LARGEST MARKET SHARE THROUGHOUT FORECAST PERIOD
- FIGURE 55 ASIA PACIFIC TO ACCOUNT FOR LARGEST MARKET SHARE IN 2025
- FIGURE 56 NORTH AMERICA: UV LED MARKET SNAPSHOT
- FIGURE 57 UV-A TO ACCOUNT FOR LARGEST MARKET SHARE IN NORTH AMERICA IN 2025
- FIGURE 58 EUROPE: UV LED MARKET SNAPSHOT
- FIGURE 59 UV-C TO REGISTER HIGHEST CAGR IN EUROPE UV LED MARKET DURING FORECAST PERIOD
- FIGURE 60 ASIA PACIFIC: UV LED MARKET SNAPSHOT
- FIGURE 61 UV-C SEGMENT TO REGISTER HIGHEST CAGR IN ASIA PACIFIC UV LED MARKET
- FIGURE 62 UV-C SEGMENT TO ACCOUNT FOR LARGEST SHARE OF UV LED MARKET IN ROW DURING FORECAST PERIOD
- FIGURE 63 MARKET SHARE ANALYSIS OF PLAYERS OFFERING UV LEDS, 2024
- FIGURE 64 UV LED MARKET: REVENUE ANALYSIS OF FIVE KEY PLAYERS, 2021-2024
- FIGURE 65 COMPANY VALUATION, 2025
- FIGURE 66 FINANCIAL METRICS (EV/EBITDA), 2025
- FIGURE 67 BRAND COMPARISON
- FIGURE 68 UV LED MARKET: COMPANY EVALUATION MATRIX (KEY PLAYERS), 2024
- FIGURE 69 UV LED MARKET: COMPANY FOOTPRINT
- FIGURE 70 UV LED MARKET: COMPANY EVALUATION MATRIX (STARTUPS/SMES), 2024
- FIGURE 71 SEOUL VIOSYS CO., LTD.: COMPANY SNAPSHOT
- FIGURE 72 STANLEY ELECTRIC CO., LTD.: COMPANY SNAPSHOT
- FIGURE 73 AMS-OSRAM AG: COMPANY SNAPSHOT
- FIGURE 74 EVERLIGHT ELECTRONICS CO., LTD.: COMPANY SNAPSHOT
- FIGURE 75 BROADCOM: COMPANY SNAPSHOT
- FIGURE 76 LITE-ON TECHNOLOGY CORPORATION: COMPANY SNAPSHOT

