
PUBLISHER: MarketsandMarkets | PRODUCT CODE: 1808971

PUBLISHER: MarketsandMarkets | PRODUCT CODE: 1808971
Photonics Market by Product Type (LED), Wavelength (Infrared, Visible), Material (Silicon, Glass), Application (Information & Communication Technology), End-use Industry (Industrial, Media & Telecommunication), & Region - Global Forecast to 2030
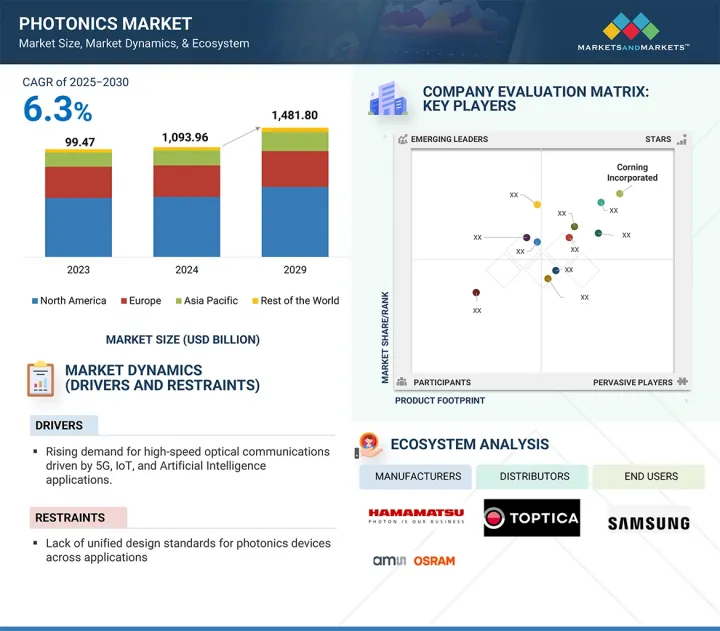
The photonics market is projected to grow from USD 1,093.96 billion in 2025 to USD 1,481.80 billion by 2030, at a CAGR of 6.3% during the forecast period. The photonics market is driven by the growing need for high-bandwidth communication solutions, particularly due to advancements in 5G technology, cloud computing, and the increasing number of Internet of Things (IoT) protocols. These advancements require optical fibers and transceivers to enhance data transmission speeds.
| Scope of the Report | |
|---|---|
| Years Considered for the Study | 2021-2030 |
| Base Year | 2024 |
| Forecast Period | 2025-2030 |
| Units Considered | Value (USD Million/Billion) |
| Segments | Product Type, Material, Wavelength, Application, and End-use Industry, and Region |
| Regions covered | North America, Europe, the Middle East & Africa, and South America |
In the realm of industrial manufacturing, lasers and optical sensors are improving the precision of cutting, welding, and quality control processes, contributing to the rise of automated assembly lines, much like the impact of Industry 4.0. In healthcare, the rising use of non-invasive diagnostic techniques, such as infrared spectroscopy and biophotonics, is stimulating market growth to support an aging population. Additionally, in consumer electronics, there is a high demand for products like smartphones, as well as augmented reality (AR) and virtual reality (VR) devices. This demand is driving the need for visible-wavelength LEDs and micro-LED displays.
"Detectors, sensors, and imaging devices segment to register the fastest growth during the forecast period ."
The detectors, sensors, and imaging devices segment is projected to register the fastest growth in the photonics market during the forecast period. This growth is driven by their widespread adoption in diverse, high-growth industries such as automotive, healthcare, consumer electronics, defense, and industrial automation. The increasing reliance on photonic sensors for high-precision smart systems is fueling the demand for real-time data acquisition across various applications. In the automotive sector, for example, the emergence of advanced driver-assistance systems (ADAS) and fully autonomous vehicles has significantly increased the production volumes of LiDAR systems, infrared detectors, and 3D imaging sensors. These technologies depend on photonics to detect obstacles, scan terrain, and enhance safety in all weather conditions. In healthcare, photonic imaging devices such as optical coherence tomography (OCT), fluorescence imaging, and bio-photonic sensors are enabling earlier and more accurate disease diagnoses than ever before. Non-invasive imaging and real-time monitoring, using both near-infrared (NIR) and visible light modalities, have become essential in surgical applications and diagnostic point-of-care settings. As the global population ages and the prevalence of chronic conditions rises, the demand for advanced diagnostic capabilities is expected to grow.
"Glass segment to register the fastest growth in the photonics market in terms of value."
Glass is the fastest-growing material segment in the photonics market due to its excellent optical properties, chemical durability, and versatility across a wide range of applications. Its growth is primarily driven by its use in the manufacture of optical fibers, which enable high-speed internet services, 5G networks, and long-haul data transmission infrastructures. As global data transfer and cloud computing continue to expand rapidly, telecom companies have made significant investments in fiber optic networks that benefit from the low optical attenuation and high transmission efficiency of silica-based glass. Additionally, glass is increasingly utilized in high-performance lenses, substrates, prisms, and waveguides for imaging (ocular), sensing (photonic), and laser applications. Specialty glasses, such as borosilicate, fused silica, and chalcogenide glass, offer a diverse range of optical properties like high thermal resistance, UV or IR transparency, and low dispersion, making them suitable for various specialized applications in aerospace, defense, healthcare, and industrial lasers. The growing acceptance of glass components is also fueled by the rise of high-precision medical devices, including diagnostic imaging systems and surgical tools. Glass is becoming indispensable for manufacturers due to its biocompatibility and dimensional stability.
"Visible wavelength segment to register the fastest growth in the photonics market in terms of value."
The visible wavelength segment is projected to register the fastest growth in the photonics market due to its wide applications in imaging, display, lighting, and consumer electronics. With wavelengths ranging from roughly 400 to 700 nanometers, visible light is the most relevant spectrum to drive human interactions, making it easier to permit possible integration into any applicable technology that would be used in the daily lives of people. The drive for high-resolution display panels has grown significantly over the past few years, with OLED, micro-LED, and quantum dot displays driving displays in phones, TVs, monitors, and AR/VR. This established demand for display screen technology has driven the adoption of visible light photonic technologies. Companies in countries like South Korea, China, and Japan, familiar with the electronics and display market, are investing heavily in visible-light photonics in new display technologies. Another major driver of growth is solid-state lighting (SSL) technologies, including LEDs (which mostly impact visible light and some IR), as governments are requiring energy efficiency metrics and mass LED adoption in commercial, residential, and public infrastructure projects.
"Lighting segment to register the fastest growth in the photonics market in terms of value."
Lighting is emerging as the fastest-growing application segment of the photonics market, owing to the increased adoption of energy-efficient lighting sources, rapid urbanization, and global goals aimed at carbon neutrality. The conversion from traditional incandescent and fluorescent lighting to solid-state lighting (SSL)-specifically light-emitting diodes (LEDs) and organic LEDs (OLEDs)-has triggered a considerable demand for photonic technologies. Photonic technologies have luminous efficacy that far exceeds traditional light source alternatives, significantly longer operating lives, and reduce energy consumption to become a viable solution in commercial, residential, industrial, and public infrastructure applications. Governments have been instituting stringent energy-efficiency regulations and subsidies/mandates to encourage the adoption of LED-based lighting solutions in the Asia Pacific, Europe, and North America, also impacting the projected growth of the market. Reality capture smart lighting systems that employ photonics-based controls and sensors are becoming increasingly desirable and consumed in smart homes and smart cities. These smart lighting systems are adjustable based on occupancy or ambient changes (dynamics) and modify their brightness and color temperature, respectively, utilizing photonics-based components such as light sensors, photodetectors, and controls.
Media & telecommunication segment to register the fastest growth in the photonics market in terms of value."
The media and telecommunication segment is the fastest-growing end-use segment in the photonics market, largely fueled by the increasing need for remote high-speed data transmission, 5G infrastructure, and the development of optical communication systems. Photonics technologies, particularly fiber optic technologies and optical transceivers, represent the most advanced telecommunications solutions that make today's telecommunications networks operate faster, more securely, and with more bandwidth and less loss, all over long distances. As the quantity of global internet usage increases, along with the speed and quantity of data traffic, telecoms are currently transitioning away from copper infrastructures and toward fiber optic networks. This transition is creating a great need for telecommunication photonic components. The development of 5G commercial networks and the anticipated development towards 6G will also require photonic solutions to accommodate the number of devices connected to the networks. The number of devices streaming content and the latency requirements for applications such as augmented reality (AR), virtual reality (VR), and cloud computing will also require greater bandwidth and a lower latency telecommunication infrastructure. Photonic integrated circuits (PICs), lasers, and photodetectors are being integrated into state-of-the-art data centers and wireless communications hubs in order to meet upcoming demands in bandwidth and latency. New developments in wavelength division multiplexing (WDM) and coherent optical systems significantly increase the efficiency of optical communications systems, furthering the need for photonic technologies in media and telecommunications.
In-depth interviews were conducted with chief executive officers (CEOs), marketing directors, other innovation and technology directors, and executives from various key organizations operating in the photonics market, and information was gathered from secondary research to determine and verify the market size of several segments.
- By Company Type: Tier 1 - 50%, Tier 2 - 30%, and Tier 3 - 20%
- By Designation: Managers- 15%, Directors - 20%, and Others - 65%
- By Region: North America - 14%, Europe - 16%, Asia Pacific - 58%, and the Rest of the World - 12%.
The photonics market comprises Thorlabs, Inc. (US), IPG Photonics Corporation (US), Lumentum Operations LLC (US), ams-OSRAM AG (Austria), Hamamatsu Photonics K.K. (Japan), Corning Incorporated (US), Coherent Corp(US), OFS Fitel, LLC (US), ON SEMICONDUCTOR CORPORATION (US), and Signify Holding (Netherlands). The study includes an in-depth competitive analysis of these key players in the photonics market, with their company profiles, recent developments, and key market strategies.
Research Coverage
This report segments the photonics market on the basis of product type, material, wavelength, application, end-use industry, and region, and provides estimations for the overall value of the market across various regions. A detailed analysis of key industry players has been conducted to provide insights into their business overviews, products & services, key strategies, and expansions associated with the photonics market.
Key benefits of buying this report
This research report is focused on various levels of analysis - industry analysis (industry trends), market ranking analysis of top players, and company profiles, which together provide an overall view of the competitive landscape; emerging and high-growth segments of the photonics market; high-growth regions; and market drivers, restraints, opportunities, and challenges.
The report provides insights on the following pointers:
- Analysis of drivers: (advancements in photonic-integrated circuits enabling miniaturization and cost-effective high-performance solutions), restraints (high optical losses in silicon nitride and SOI (silicon-on-insulator) waveguide fabrication), opportunities (integration of photonics with artificial intelligence and Internet of things to enable smart cities, precision agriculture, and industrial automation), and challenges (signal distortion from non-linear effects in high-power photonic systems).
- Market Penetration: Comprehensive information on the photonics market offered by top players in the photonics market.
- Product Development/Innovation: Detailed insights on upcoming technologies, research & development activities, partnerships, agreements, and collaboration in the market.
- Market Development: This report provides comprehensive information about lucrative emerging markets and analyzes the photonics market across regions.
- Market Capacity: Production capacities of companies producing photonics are provided wherever available with upcoming capacities for the photonics market.
- Competitive Assessment: In-depth assessment of market shares, strategies, products, and manufacturing capabilities of leading players in the photonics market.
TABLE OF CONTENTS
1 INTRODUCTION
- 1.1 STUDY OBJECTIVES
- 1.2 MARKET DEFINITION
- 1.3 STUDY SCOPE
- 1.3.1 MARKETS COVERED AND REGIONAL SNAPSHOT
- 1.3.2 INCLUSIONS AND EXCLUSIONS
- 1.3.3 YEARS CONSIDERED
- 1.3.4 CURRENCY CONSIDERED
- 1.4 RESEARCH LIMITATIONS
- 1.5 STAKEHOLDERS
- 1.6 SUMMARY OF CHANGES
2 RESEARCH METHODOLOGY
- 2.1 RESEARCH DATA
- 2.1.1 SECONDARY DATA
- 2.1.1.1 Key data from secondary sources
- 2.1.2 PRIMARY DATA
- 2.1.2.1 Key data from primary sources
- 2.1.2.2 Key primary sources
- 2.1.2.3 Key participants for primary interviews
- 2.1.2.4 Breakdown of primary interviews
- 2.1.2.5 Key industry insights
- 2.1.1 SECONDARY DATA
- 2.2 BASE NUMBER CALCULATION
- 2.2.1 SUPPLY-SIDE ANALYSIS
- 2.2.2 DEMAND-SIDE ANALYSIS
- 2.3 GROWTH FORECAST
- 2.3.1 SUPPLY SIDE
- 2.3.2 DEMAND SIDE
- 2.4 MARKET SIZE ESTIMATION
- 2.4.1 BOTTOM-UP APPROACH
- 2.4.2 TOP-DOWN APPROACH
- 2.5 DATA TRIANGULATION
- 2.6 RESEARCH ASSUMPTIONS
- 2.7 GROWTH FORECAST
- 2.8 RISK ASSESSMENT
- 2.9 FACTOR ANALYSIS
3 EXECUTIVE SUMMARY
4 PREMIUM INSIGHTS
- 4.1 ATTRACTIVE OPPORTUNITIES FOR PLAYERS IN PHOTONICS MARKET
- 4.2 PHOTONICS MARKET, BY TYPE
- 4.3 PHOTONICS MARKET, BY MATERIAL
- 4.4 PHOTONICS MARKET, BY APPLICATION
- 4.5 PHOTONICS MARKET, BY WAVELENGTH
- 4.6 PHOTONICS MARKET, BY END-USE INDUSTRY
- 4.7 PHOTONICS MARKET, BY COUNTRY
5 MARKET OVERVIEW
- 5.1 INTRODUCTION
- 5.2 MARKET DYNAMICS
- 5.2.1 DRIVERS
- 5.2.1.1 Advancements in photonic-integrated circuits (PICs)
- 5.2.1.2 Rising demand for high-speed optical communication
- 5.2.1.3 Growth of data-driven economies
- 5.2.2 RESTRAINTS
- 5.2.2.1 High optical losses in silicon nitride and silicon-on-insulator (SOI) waveguide fabrication
- 5.2.2.2 Lack of unified design standards for photonics devices
- 5.2.3 OPPORTUNITIES
- 5.2.3.1 Commercialization and innovation in quantum technologies
- 5.2.3.2 Integration of photonics with artificial intelligence and Internet of Things (IoT)
- 5.2.3.3 Expansion of next-generation data centers and telecommunication networks
- 5.2.4 CHALLENGES
- 5.2.4.1 Signal distortion from non-linear effects in high-power photonic systems
- 5.2.4.2 Complexity in integration of photonic sensors into industrial IoT systems
- 5.2.1 DRIVERS
- 5.3 IMPACT OF GENRATIVE AI ON PHOTONICS MARKET
- 5.3.1 INTRODUCTION
6 INDUSTRY TRENDS
- 6.1 INTRODUCTION
- 6.2 TRENDS/DISRUPTIONS IMPACTING CUSTOMER BUSINESS
- 6.3 VALUE CHAIN ANALYSIS
- 6.4 INVESTMENT AND FUNDING SCENARIO
- 6.5 ECOSYSTEM ANALYSIS
- 6.6 PRICING ANALYSIS
- 6.6.1 INDICATIVE PRICING ANALYSIS, BY REGION, 2024
- 6.6.2 INDICATIVE PRICING ANALYSIS, BY PRODUCT TYPE, 2024
- 6.7 TECHNOLOGY ANALYSIS
- 6.7.1 KEY TECHNOLOGIES
- 6.7.2 COMPLEMENTARY TECHNOLOGIES
- 6.7.3 ADJACENT TECHNOLOGIES
- 6.8 PATENT ANALYSIS
- 6.8.1 METHODOLOGY
- 6.8.2 PATENTS GRANTED WORLDWIDE
- 6.8.3 PATENT PUBLICATION TRENDS
- 6.8.4 INSIGHTS
- 6.8.5 LEGAL STATUS OF PATENTS
- 6.8.6 JURISDICTION ANALYSIS
- 6.8.7 TOP APPLICANTS
- 6.8.8 LIST OF MAJOR PATENTS
- 6.9 TRADE ANALYSIS
- 6.9.1 IMPORT SCENARIO (HS CODE 854140)
- 6.9.2 EXPORT SCENARIO (HS CODE 854140)
- 6.10 KEY CONFERENCES AND EVENTS, 2024-2025
- 6.11 TARIFF AND REGULATORY LANDSCAPE
- 6.11.1 TARIFFS RELATED TO PHOTONICS
- 6.11.2 REGULATORY BODIES, GOVERNMENT AGENCIES, AND OTHER ORGANIZATIONS
- 6.11.3 REGULATIONS AND STANDARDS
- 6.12 PORTER'S FIVE FORCES ANALYSIS
- 6.12.1 THREAT OF NEW ENTRANTS
- 6.12.2 THREAT OF SUBSTITUTES
- 6.12.3 BARGAINING POWER OF SUPPLIERS
- 6.12.4 BARGAINING POWER OF BUYERS
- 6.12.5 INTENSITY OF COMPETITIVE RIVALRY
- 6.13 KEY STAKEHOLDERS AND BUYING CRITERIA
- 6.13.1 KEY STAKEHOLDERS IN BUYING PROCESS
- 6.13.2 BUYING CRITERIA
- 6.14 MACROECONOMIC OUTLOOK
- 6.14.1 GDP TRENDS AND FORECASTS, BY COUNTRY
- 6.15 CASE STUDY ANALYSIS
- 6.15.1 ACCELERATING 5G AND IOT DEPLOYMENT: ACP'S CUSTOMIZED GAIN FLATTENING FILTER SOLUTION FOR A TELECOM LEADER
- 6.15.2 SMART VEHICLES AND SAFER ROADS: HAMAMATSU'S OPTICAL SENSORS POWER AUTOMOTIVE INNOVATION
- 6.15.3 ORCA-QUEST QCMOS CAMERA BY HAMAMATSU PHOTONICS - ENABLING PRECISION IMAGING ACROSS SCIENTIFIC FRONTIERS
7 PHOTONICS MARKET, BY PRODUCT TYPE
- 7.1 INTRODUCTION
- 7.2 LIGHT SOURCES
- 7.2.1 SHIFT TOWARD LED-BASED EFFICIENCY AND SMART ILLUMINATION TO DRIVE MARKET
- 7.3 LASERS AND LASER SYSTEMS
- 7.3.1 HIGH PRECISION, POWER, AND VERSATILITY TO DRIVE DEMAND
- 7.4 DETECTORS, SENSORS & IMAGING DEVICES
- 7.4.1 FOCUS ON ENHANCEMENT OF VISIBILITY, SENSING ACCURACY, AND DATA ACQUISITION ACROSS INDUSTRIES TO DRIVE MARKET
- 7.5 OPTICAL COMMUNICATION & NETWORKING
- 7.5.1 GROWING INTERNET PENETRATION AND 5G EXPANSION TO FUEL DEMAND
- 7.6 OPTICAL COMPONENTS & SYSTEMS
- 7.6.1 INCREASING ADOPTION OF PHOTONIC SYSTEMS IN LIDAR FOR AUTONOMOUS VEHICLES AND ADVANCED DRIVER-ASSISTANCE SYSTEMS TO DRIVE MARKET
- 7.7 OPTOELECTRONICS & INTEGRATED PHOTONIC CIRCUITS
- 7.7.1 MINIATURIZATION AND HIGH-SPEED FUNCTIONALITY IN NEXT-GEN PHOTONIC APPLICATIONS TO PROPEL MARKET
8 PHOTONICS MARKET, BY WAVELENGTH
- 8.1 INTRODUCTION
- 8.2 ULTRAVIOLET
- 8.2.1 RISING DEMAND FOR STERILIZATION AND NANOLITHOGRAPHY TO ACCELERATE ADOPTION
- 8.3 VISIBLE
- 8.3.1 TECHNOLOGICAL ADVANCEMENTS IN DISPLAYS, EXCELLENT LIGHTING EFFICIENCY, AND BOOMING CONSUMER ELECTRONICS INDUSTRY TO DRIVE MARKET
- 8.4 INFRARED
- 8.4.1 RISING SECURITY & SURVEILLANCE REQUIREMENTS, AUTONOMOUS VEHICLE INTEGRATION, AND ENVIRONMENTAL MONITORING NEEDS TO PROPEL MARKET
9 PHOTONICS MARKET, BY APPLICATION
- 9.1 INTRODUCTION
- 9.2 DISPLAY
- 9.2.1 RISING DEMAND FOR HIGH-RESOLUTION PANELS IN CONSUMER AND INDUSTRIAL INTERFACES TO DRIVE MARKET
- 9.3 INFORMATION & COMMUNICATION TECHNOLOGY
- 9.3.1 RISING OPTICAL DATA TRANSMISSION DEMANDS TO ACCELERATE ADOPTION
- 9.4 PHOTOVOLTAICS
- 9.4.1 ENERGY TRANSITION GOALS AND OFF-GRID ELECTRIFICATION TO DRIVE DEMAND
- 9.5 MEDICAL TECHNOLOGY & LIFE SCIENCES
- 9.5.1 USE IN PRECISION DIAGNOSTICS AND NEXT-GEN MEDICAL TREATMENTS TO DRIVE MARKET
- 9.6 MEASUREMENT & AUTOMATED VISION
- 9.6.1 NEED FOR INDUSTRIAL ACCURACY AND ROBOTICS INTEGRATION TO FUEL DEMAND
- 9.7 LIGHTING
- 9.7.1 GROWTH OF SMART AND HUMAN-CENTRIC LIGHTING TO DRIVE MARKET
- 9.8 OTHER APPLICATIONS
- 9.8.1 ASTRONOMY
- 9.8.2 SEMICONDUCTOR MANUFACTURING
10 PHOTONICS MARKET, BY MATERIAL
- 10.1 INTRODUCTION
- 10.2 SILICON
- 10.2.1 CMOS INTEGRATION, DATA CENTER GROWTH, AND INTEGRATED PHOTONICS DEMAND TO DRIVE MARKET
- 10.3 GLASS
- 10.3.1 RISING OPTICAL FIBER DEMAND, INFRARED TECHNOLOGY GROWTH, AND TELECOM INFRASTRUCTURE NEEDS TO PROPEL MARKET
- 10.4 INDIUM PHOSPHIDE (INP)
- 10.4.1 HIGH-SPEED OPTICAL COMMUNICATION AND QUANTUM ADVANCEMENTS TO DRIVE DEMAND
- 10.5 GALLIUM ARSENIDE
- 10.5.1 ONGOING ADVANCES IN OPTOELECTRONICS DRIVEN BY TELECOM AND AUTOMOTIVE NEEDS TO DRIVE MARKET
- 10.6 GALLIUM NITRIDE
- 10.6.1 RISING DEMAND FOR LIGHTING EFFICIENCY, SUPPORTED BY GLOBAL SUSTAINABILITY GOALS, TO DRIVE MARKET
- 10.7 LITHIUM NIOBATE
- 10.7.1 USE FOR ADVANCING MODULATION, NON-LINEAR OPTICS, AND HIGH-SPEED COMMUNICATION TO PROPEL MARKET
- 10.8 OTHER MATERIALS
- 10.8.1 GALLIUM ALUMINIUM ARSENIDE
- 10.8.2 GERMANIUM
11 PHOTONICS MARKET, BY END-USE INDUSTRY
- 11.1 INTRODUCTION
- 11.2 CONSTRUCTION
- 11.2.1 GREEN BUILDING PRACTICES AND RISING USE IN STRUCTURAL HEALTH MONITORING TO DRIVE MARKET
- 11.3 MEDIA & TELECOMMUNICATION
- 11.3.1 5G NETWORK ROLLOUT, STREAMING SERVICE GROWTH, AND DIGITAL TRANSFORMATION TO DRIVE DEMAND
- 11.4 MEDICAL
- 11.4.1 DIOGNOSTIC IMAGING DEMAND AND MINIMALLY INVASIVE SURGERY TRENDS TO FUEL MARKET GROWTH
- 11.5 SECURITY & DEFENSE
- 11.5.1 ADVANCING DIRECTED ENERGY AND SECURE COMMUNICATIONS THROUGH PHOTONICS TO PROPEL MARKET
- 11.6 INDUSTRIAL
- 11.6.1 FOCUS ON PRECISION MANUFACTURING AND PROCESS OPTIMIZATION TO DRIVE MARKET
- 11.7 OTHER END-USE INDUSTRIES
- 11.7.1 CONSUMER ELECTRONICS
- 11.7.2 AGRICULTURE
12 PHOTONICS MARKET, BY REGION
- 12.1 INTRODUCTION
- 12.2 ASIA PACIFIC
- 12.2.1 CHINA
- 12.2.1.1 High investments in telecommunications and artificial intelligence (AI) to drive demand
- 12.2.2 JAPAN
- 12.2.2.1 Increased semiconductor manufacturing to propel demand
- 12.2.3 INDIA
- 12.2.3.1 Government-backed digitalization and growth in medical diagnostics to drive market
- 12.2.4 SOUTH KOREA
- 12.2.4.1 High R&D investments in high-quality materials to fuel demand
- 12.2.5 TAIWAN
- 12.2.5.1 Leadership in semiconductor fabrication to drive adoption
- 12.2.6 REST OF ASIA PACIFIC
- 12.2.1 CHINA
- 12.3 NORTH AMERICA
- 12.3.1 US
- 12.3.1.1 Strong federal and private sector R&D funding to drive market
- 12.3.2 CANADA
- 12.3.2.1 Expansion of optical communication networks to boost market growth
- 12.3.3 MEXICO
- 12.3.3.1 Rising electronics manufacturing and demand for LED lighting to propel market
- 12.3.1 US
- 12.4 EUROPE
- 12.4.1 GERMANY
- 12.4.1.1 Industrial automation, smart manufacturing, and automotive LiDAR to drive demand
- 12.4.2 ITALY
- 12.4.2.1 Growing medical imaging and smart lighting needs to drive adoption
- 12.4.3 FRANCE
- 12.4.3.1 Rising demand from aerospace & defense industry to drive market
- 12.4.4 UK
- 12.4.4.1 Government-led funding in quantum technologies to drive market
- 12.4.5 NETHERLANDS
- 12.4.5.1 Growing integrated photonics startups due to strong R&D support and innovation-driven policies to boost market
- 12.4.6 REST OF EUROPE
- 12.4.1 GERMANY
- 12.5 ROW
- 12.5.1 SAUDI ARABIA
- 12.5.1.1 High focus on diversification under Vision 2030 initiative to drive market
- 12.5.2 UAE
- 12.5.2.1 Digitalization and smart governance to accelerate market growth
- 12.5.3 OMAN
- 12.5.3.1 Industrial diversification and maritime security demands to accelerate adoption
- 12.5.4 EGYPT
- 12.5.4.1 Local solar film production and bio-photonics adoption to accelerate market growth
- 12.5.5 SOUTH AFRICA
- 12.5.5.1 Growing use in mining and astronomy applications to drive market
- 12.5.6 OTHERS IN ROW
- 12.5.1 SAUDI ARABIA
13 COMPETITIVE LANDSCAPE
- 13.1 INTRODUCTION
- 13.2 KEY PLAYER STRATEGIES/RIGHT TO WIN
- 13.3 MARKET SHARE ANALYSIS
- 13.4 REVENUE ANALYSIS
- 13.5 BRAND/PRODUCT COMPARISON
- 13.6 COMPANY EVALUATION MATRIX: KEY PLAYERS, 2024
- 13.6.1 STARS
- 13.6.2 EMERGING LEADERS
- 13.6.3 PERVASIVE PLAYERS
- 13.6.4 PARTICIPANTS
- 13.6.5 COMPANY FOOTPRINT: KEY PLAYERS, 2024
- 13.6.5.1 Company footprint
- 13.6.5.2 Product type footprint
- 13.6.5.3 Application footprint
- 13.6.5.4 End-use industry footprint
- 13.6.5.5 Region footprint
- 13.7 COMPANY EVALUATION MATRIX: STARTUPS/SMES, 2024
- 13.7.1 PROGRESSIVE COMPANIES
- 13.7.2 RESPONSIVE COMPANIES
- 13.7.3 DYNAMIC COMPANIES
- 13.7.4 STARTING BLOCKS
- 13.7.5 COMPETITIVE BENCHMARKING: STARTUPS/SMES, 2024
- 13.7.5.1 Detailed list of key startups/SMEs
- 13.7.5.2 Competitive benchmarking of key startups/SMEs
- 13.8 COMPANY VALUATION AND FINANCIAL METRICS, 2024
- 13.9 COMPETITIVE SCENARIO
- 13.9.1 DEALS
- 13.9.2 PRODUCT LAUNCHES
14 COMPANY PROFILES
- 14.1 KEY PLAYERS
- 14.1.1 THORALABS, INC.
- 14.1.1.1 Business overview
- 14.1.1.2 Products/Solutions/Services offered
- 14.1.1.3 MnM view
- 14.1.1.3.1 Key strengths/Right to win
- 14.1.1.3.2 Strategic choices
- 14.1.1.3.3 Weaknesses/Competitive threats
- 14.1.2 AMS-OSRAM
- 14.1.2.1 Business overview
- 14.1.2.2 Products/Solutions/Services offered
- 14.1.2.3 MnM view
- 14.1.2.3.1 Key strengths/Right to win
- 14.1.2.3.2 Strategic choices
- 14.1.2.3.3 Weaknesses/Competitive threats
- 14.1.3 HAMAMATSU PHOTONICS K.K.
- 14.1.3.1 Business overview
- 14.1.3.2 Products/Solutions/Services offered
- 14.1.3.3 MnM view
- 14.1.3.3.1 Key strengths/Right to win
- 14.1.3.3.2 Strategic choices
- 14.1.3.3.3 Weaknesses/Competitive threats
- 14.1.4 LUMENTUM OPERATIONS LLC
- 14.1.4.1 Business overview
- 14.1.4.2 Products/Solutions/Services offered
- 14.1.4.3 MnM view
- 14.1.4.3.1 Key strengths/Right to win
- 14.1.4.3.2 Strategic choices
- 14.1.4.3.3 Weaknesses/Competitive threats
- 14.1.5 IPG PHOTONICS CORPORATION
- 14.1.5.1 Business overview
- 14.1.5.2 Products/Solutions/Services offered
- 14.1.5.3 MnM view
- 14.1.5.3.1 Key strengths/Right to win
- 14.1.5.3.2 Strategic choices
- 14.1.5.3.3 Weaknesses/Competitive threats
- 14.1.6 SIGNIFY HOLDING
- 14.1.6.1 Business overview
- 14.1.6.2 Products/Solutions/Services offered
- 14.1.7 CORNING INCORPORATED
- 14.1.7.1 Business overview
- 14.1.7.2 Products/Solutions/Services offered
- 14.1.7.3 Recent developments
- 14.1.7.3.1 Product launches
- 14.1.7.3.2 Deals
- 14.1.7.4 MnM view
- 14.1.7.4.1 Key strengths/Right to win
- 14.1.7.4.2 Strategic choices
- 14.1.7.4.3 Weaknesses/Competitive threats
- 14.1.8 ON SEMICONDUCTOR CORPORATION
- 14.1.8.1 Business overview
- 14.1.8.2 Products/Solutions/Services offered
- 14.1.8.3 Recent developments
- 14.1.8.3.1 Deals
- 14.1.9 OFS FITEL, LLC
- 14.1.9.1 Business overview
- 14.1.9.2 Products/Solutions/Services offered
- 14.1.9.3 Recent developments
- 14.1.9.3.1 Product launches
- 14.1.10 COHERENT CORP.
- 14.1.10.1 Business overview
- 14.1.10.2 Products/Solutions/Services offered
- 14.1.11 NICHIA CORPORATION
- 14.1.11.1 Business overview
- 14.1.11.2 Products/Solutions/Services offered
- 14.1.11.3 Recent developments
- 14.1.11.3.1 Product launches
- 14.1.1 THORALABS, INC.
- 14.2 OTHER PLAYERS
- 14.2.1 TOPTICA PHOTONICS
- 14.2.2 M SQUARED LASERS LIMITED
- 14.2.3 FREEDOM PHOTONICS LLC
- 14.2.4 SCINTIL PHOTONICS
- 14.2.5 PHOTONICS INDUSTRIES INTERNATIONAL. INC.
- 14.2.6 LUMILEDS HOLDINGS B.V.
- 14.2.7 EXCELITAS TECHNOLOGIES CORP.
- 14.2.8 TRUMPF
- 14.2.9 EMERSON ELECTRIC CO
- 14.2.10 SAMSUNG ELECTRONICS
15 APPENDIX
- 15.1 DISCUSSION GUIDE
- 15.2 KNOWLEDGESTORE: MARKETSANDMARKETS' SUBSCRIPTION PORTAL
- 15.3 CUSTOMIZATION OPTIONS
- 15.4 RELATED REPORTS
- 15.5 AUTHOR DETAILS
List of Tables
- TABLE 1 ROLES OF COMPANIES IN PHOTONICS ECOSYSTEM
- TABLE 2 INDICATIVE PRICING ANALYSIS OF PHOTONIC PRODUCT TYPES, BY REGION, 2024 (USD/UNIT)
- TABLE 3 INDICATIVE PRICING ANALYSIS OF PHOTONICS, BY PRODUCT TYPE, 2024 (USD/UNIT)
- TABLE 4 PHOTONICS MARKET: KEY TECHNOLOGIES
- TABLE 5 PHOTONICS MARKET: COMPLEMENTARY TECHNOLOGIES
- TABLE 6 PHOTONICS MARKET: ADJACENT TECHNOLOGIES
- TABLE 7 PHOTONICS MARKET: TOTAL NUMBER OF PATENTS, 2015-2024
- TABLE 8 PHOTONICS MARKET: LIST OF MAJOR PATENT OWNERS, 2015-2024
- TABLE 9 PHOTONICS MARKET: LIST OF MAJOR PATENTS, 2018-2024
- TABLE 10 PHOTONICS MARKET: LIST OF KEY CONFERENCES AND EVENTS, 2025-2026
- TABLE 11 PHOTONICS MARKET: TARIFF ANALYSIS, 2025
- TABLE 12 NORTH AMERICA: REGULATORY BODIES, GOVERNMENT AGENCIES, AND OTHER ORGANIZATIONS
- TABLE 13 EUROPE: REGULATORY BODIES, GOVERNMENT AGENCIES, AND OTHER ORGANIZATIONS
- TABLE 14 ASIA PACIFIC: REGULATORY BODIES, GOVERNMENT AGENCIES, AND OTHER ORGANIZATIONS
- TABLE 15 ROW: REGULATORY BODIES, GOVERNMENT AGENCIES, AND OTHER ORGANIZATIONS
- TABLE 16 PHOTONICS MARKET: REGULATIONS AND STANDARDS
- TABLE 17 PHOTONICS MARKET: PORTER'S FIVE FORCES ANALYSIS
- TABLE 18 INFLUENCE OF STAKEHOLDERS ON BUYING PROCESS FOR TOP THREE END-USE INDUSTRIES
- TABLE 19 KEY BUYING CRITERIA FOR TOP THREE END-USE INDUSTRIES
- TABLE 20 GDP TRENDS AND FORECASTS, BY COUNTRY, 2023-2025 (USD MILLION)
- TABLE 21 PHOTONICS MARKET, BY PRODUCT TYPE, 2021-2024 (USD BILLION)
- TABLE 22 PHOTONICS MARKET, BY PRODUCT TYPE, 2025-2030 (USD BILLION)
- TABLE 23 PHOTONICS MARKET, BY WAVELENGTH, 2021-2024 (USD BILLION)
- TABLE 24 PHOTONICS MARKET, BY WAVELENGTH, 2025-2030 (USD BILLION)
- TABLE 25 PHOTONICS MARKET, BY APPLICATION, 2021-2024 (USD BILLION)
- TABLE 26 PHOTONICS MARKET, BY APPLICATION, 2025-2030 (USD BILLION)
- TABLE 27 PHOTONICS MARKET, BY MATERIAL, 2021-2024 (USD BILLION)
- TABLE 28 PHOTONICS MARKET, BY MATERIAL, 2025-2030 (USD BILLION)
- TABLE 29 PHOTONICS MARKET, BY END-USE INDUSTRY, 2021-2024 (USD BILLION)
- TABLE 30 PHOTONICS MARKET, BY END-USE INDUSTRY, 2025-2030 (USD BILLION)
- TABLE 31 PHOTONICS MARKET, BY REGION, 2021-2024 (USD BILLION)
- TABLE 32 PHOTONICS MARKET, BY REGION, 2025-2030 (USD BILLION)
- TABLE 33 ASIA PACIFIC: PHOTONICS MARKET, BY COUNTRY, 2021-2024 (USD BILLION)
- TABLE 34 ASIA PACIFIC: PHOTONICS MARKET, BY COUNTRY, 2025-2030 (USD BILLION)
- TABLE 35 ASIA PACIFIC: PHOTONICS MARKET, BY PRODUCT TYPE, 2021-2024 (USD BILLION)
- TABLE 36 ASIA PACIFIC: PHOTONICS MARKET, BY PRODUCT TYPE, 2025-2030 (USD BILLION)
- TABLE 37 ASIA PACIFIC: PHOTONICS MARKET, BY APPLICATION, 2021-2024 (USD BILLION)
- TABLE 38 ASIA PACIFIC: PHOTONICS MARKET, BY APPLICATION, 2025-2030 (USD BILLION)
- TABLE 39 ASIA PACIFIC: PHOTONICS MARKET, BY END-USE INDUSTRY, 2021-2024 (USD BILLION)
- TABLE 40 ASIA PACIFIC: PHOTONICS MARKET, BY END-USE INDUSTRY, 2025-2030 (USD BILLION)
- TABLE 41 CHINA: PHOTONICS MARKET, BY END-USE INDUSTRY, 2021-2024 (USD BILLION)
- TABLE 42 CHINA: PHOTONICS MARKET, BY END-USE INDUSTRY, 2025-2030 (USD BILLION)
- TABLE 43 JAPAN: PHOTONICS MARKET, BY END-USE INDUSTRY, 2021-2024 (USD BILLION)
- TABLE 44 JAPAN: PHOTONICS MARKET, BY END-USE INDUSTRY, 2025-2030 (USD BILLION)
- TABLE 45 INDIA: PHOTONICS MARKET, BY END-USE INDUSTRY, 2021-2024 (USD BILLION)
- TABLE 46 INDIA: PHOTONICS MARKET, BY END-USE INDUSTRY, 2025-2030 (USD BILLION)
- TABLE 47 SOUTH KOREA: PHOTONICS MARKET, BY END-USE INDUSTRY, 2021-2024 (USD BILLION)
- TABLE 48 SOUTH KOREA: PHOTONICS MARKET, BY END-USE INDUSTRY, 2025-2030 (USD BILLION)
- TABLE 49 TAIWAN: PHOTONICS MARKET, BY END-USE INDUSTRY, 2021-2024 (USD BILLION)
- TABLE 50 TAIWAN: PHOTONICS MARKET, BY END-USE INDUSTRY, 2025-2030 (USD BILLION)
- TABLE 51 REST OF ASIA PACIFIC: PHOTONICS MARKET, BY END-USE INDUSTRY, 2021-2024 (USD BILLION)
- TABLE 52 REST OF ASIA PACIFIC: PHOTONICS MARKET, BY END-USE INDUSTRY, 2025-2030 (USD BILLION)
- TABLE 53 NORTH AMERICA: PHOTONICS MARKET, BY COUNTRY, 2021-2024 (USD BILLION)
- TABLE 54 NORTH AMERICA: PHOTONICS MARKET, BY COUNTRY, 2025-2030 (USD BILLION)
- TABLE 55 NORTH AMERICA: PHOTONICS MARKET, BY PRODUCT TYPE, 2021-2024 (USD BILLION)
- TABLE 56 NORTH AMERICA: PHOTONICS MARKET, BY PRODUCT TYPE, 2025-2030 (USD BILLION)
- TABLE 57 NORTH AMERICA: PHOTONICS MARKET, BY APPLICATION, 2021-2024 (USD BILLION)
- TABLE 58 NORTH AMERICA: PHOTONICS MARKET, BY APPLICATION, 2025-2030 (USD BILLION)
- TABLE 59 NORTH AMERICA: PHOTONICS MARKET, BY END-USE INDUSTRY, 2021-2024 (USD BILLION)
- TABLE 60 NORTH AMERICA: PHOTONICS MARKET, BY END-USE INDUSTRY, 2025-2030 (USD BILLION)
- TABLE 61 US: PHOTONICS MARKET, BY END-USE INDUSTRY, 2021-2024 (USD BILLION)
- TABLE 62 US: PHOTONICS MARKET, BY END-USE INDUSTRY, 2025-2030 (USD BILLION)
- TABLE 63 CANADA: PHOTONICS MARKET, BY END-USE INDUSTRY, 2021-2024 (USD BILLION)
- TABLE 64 CANADA: PHOTONICS MARKET, BY END-USE INDUSTRY, 2025-2030 (USD BILLION)
- TABLE 65 MEXICO: PHOTONICS MARKET, BY END-USE INDUSTRY, 2021-2024 (USD BILLION)
- TABLE 66 MEXICO: PHOTONICS MARKET, BY END-USE INDUSTRY, 2025-2030 (USD BILLION)
- TABLE 67 EUROPE: PHOTONICS MARKET, BY COUNTRY, 2021-2024 (USD BILLION)
- TABLE 68 EUROPE: PHOTONICS MARKET, BY COUNTRY, 2025-2030 (USD BILLION)
- TABLE 69 EUROPE: PHOTONICS MARKET, BY PRODUCT TYPE, 2021-2024 (USD BILLION)
- TABLE 70 EUROPE: PHOTONICS MARKET, BY PRODUCT TYPE, 2025-2030 (USD BILLION)
- TABLE 71 EUROPE: PHOTONICS MARKET, BY APPLICATION, 2021-2024 (USD BILLION)
- TABLE 72 EUROPE: PHOTONICS MARKET, BY APPLICATION, 2025-2030 (USD BILLION)
- TABLE 73 EUROPE: PHOTONICS MARKET, BY END-USE INDUSTRY, 2021-2024 (USD BILLION)
- TABLE 74 EUROPE: PHOTONICS MARKET, BY END-USE INDUSTRY, 2025-2030 (USD BILLION)
- TABLE 75 GERMANY: PHOTONICS MARKET, BY END-USE INDUSTRY, 2021-2024 (USD BILLION)
- TABLE 76 GERMANY: PHOTONICS MARKET, BY END-USE INDUSTRY, 2025-2030 (USD BILLION)
- TABLE 77 ITALY: PHOTONICS MARKET, BY END-USE INDUSTRY, 2021-2024 (USD BILLION)
- TABLE 78 ITALY: PHOTONICS MARKET, BY END-USE INDUSTRY, 2025-2030 (USD BILLION)
- TABLE 79 FRANCE: PHOTONICS MARKET, BY END-USE INDUSTRY, 2021-2024 (USD BILLION)
- TABLE 80 FRANCE: PHOTONICS MARKET, BY END-USE INDUSTRY, 2025-2030 (USD BILLION)
- TABLE 81 UK: PHOTONICS MARKET, BY END-USE INDUSTRY, 2021-2024 (USD BILLION)
- TABLE 82 UK: PHOTONICS MARKET, BY END-USE INDUSTRY, 2025-2030 (USD BILLION)
- TABLE 83 NETHERLANDS: PHOTONICS MARKET, BY END-USE INDUSTRY, 2021-2024 (USD BILLION)
- TABLE 84 NETHERLANDS: PHOTONICS MARKET, BY END-USE INDUSTRY, 2025-2030 (USD BILLION)
- TABLE 85 REST OF EUROPE: PHOTONICS MARKET, BY END-USE INDUSTRY, 2021-2024 (USD BILLION)
- TABLE 86 REST OF EUROPE: PHOTONICS MARKET, BY END-USE INDUSTRY, 2025-2030 (USD BILLION)
- TABLE 87 ROW: PHOTONICS MARKET, BY COUNTRY, 2021-2024 (USD BILLION)
- TABLE 88 ROW: PHOTONICS MARKET, BY COUNTRY, 2025-2030 (USD BILLION)
- TABLE 89 ROW: PHOTONICS MARKET, BY PRODUCT TYPE, 2021-2024 (USD BILLION)
- TABLE 90 ROW: PHOTONICS MARKET, BY PRODUCT TYPE, 2025-2030 (USD BILLION)
- TABLE 91 ROW: PHOTONICS MARKET, BY APPLICATION, 2021-2024 (USD BILLION)
- TABLE 92 ROW: PHOTONICS MARKET, BY APPLICATION, 2025-2030 (USD BILLION)
- TABLE 93 ROW: PHOTONICS MARKET, BY END-USE INDUSTRY, 2021-2024 (USD BILLION)
- TABLE 94 ROW: PHOTONICS MARKET, BY END-USE INDUSTRY, 2025-2030 (USD BILLION)
- TABLE 95 SAUDI ARABIA: PHOTONICS MARKET, BY END-USE INDUSTRY, 2021-2024 (USD BILLION)
- TABLE 96 SAUDI ARABIA: PHOTONICS MARKET, BY END-USE INDUSTRY, 2025-2030 (USD BILLION)
- TABLE 97 UAE: PHOTONICS MARKET, BY END-USE INDUSTRY, 2021-2024 (USD BILLION)
- TABLE 98 UAE: PHOTONICS MARKET, BY END-USE INDUSTRY, 2025-2030 (USD BILLION)
- TABLE 99 OMAN: PHOTONICS MARKET, BY END-USE INDUSTRY, 2021-2024 (USD BILLION)
- TABLE 100 OMAN: PHOTONICS MARKET, BY END-USE INDUSTRY, 2025-2030 (USD BILLION)
- TABLE 101 EGYPT: PHOTONICS MARKET, BY END-USE INDUSTRY, 2021-2024 (USD BILLION)
- TABLE 102 EGYPT: PHOTONICS MARKET, BY END-USE INDUSTRY, 2025-2030 (USD BILLION)
- TABLE 103 SOUTH AFRICA: PHOTONICS MARKET, BY END-USE INDUSTRY, 2021-2024 (USD BILLION)
- TABLE 104 SOUTH AFRICA: PHOTONICS MARKET, BY END-USE INDUSTRY, 2025-2030 (USD BILLION)
- TABLE 105 OTHERS IN ROW: PHOTONICS MARKET, BY END-USE INDUSTRY, 2021-2024 (USD BILLION)
- TABLE 106 OTHERS IN ROW: PHOTONICS MARKET, BY END-USE INDUSTRY, 2025-2030 (USD BILLION)
- TABLE 107 PHOTONICS MARKET: OVERVIEW OF STRATEGIES ADOPTED BY KEY PLAYERS, JANUARY 2021-MAY 2025
- TABLE 108 PHOTONICS MARKET: DEGREE OF COMPETITION, 2024
- TABLE 109 PHOTONICS MARKET: PRODUCT TYPE FOOTPRINT
- TABLE 110 PHOTONICS MARKET: APPLICATION FOOTPRINT
- TABLE 111 PHOTONICS MARKET: END-USE INDUSTRY FOOTPRINT
- TABLE 112 PHOTONICS MARKET: REGION FOOTPRINT
- TABLE 113 PHOTONICS MARKET: DETAILED LIST OF KEY STARTUPS/SMES
- TABLE 114 PHOTONICS MARKET: COMPETITIVE BENCHMARKING OF KEY STARTUPS/SMES
- TABLE 115 PHOTONICS MARKET: DEALS, JANUARY 2021-MAY 2025
- TABLE 116 PHOTONICS MARKET: PRODUCT LAUNCHES, JANUARY 2021-MAY 2025
- TABLE 117 THORLABS, INC.: COMPANY OVERVIEW
- TABLE 118 THORLABS, INC.: PRODUCTS/SOLUTIONS/SERVICES OFFERED
- TABLE 119 AMS-OSRAM: COMPANY OVERVIEW
- TABLE 120 AMS-OSRAM: PRODUCTS/SOLUTIONS/SERVICES OFFERED
- TABLE 121 HAMAMATSU PHOTONICS K.K.: COMPANY OVERVIEW
- TABLE 122 HAMAMATSU PHOTONICS K.K.: PRODUCTS/SOLUTIONS/SERVICES OFFERED
- TABLE 123 LUMENTUM OPERATIONS LLC: COMPANY OVERVIEW
- TABLE 124 LUMENTUM OPERATIONS LLC,: PRODUCTS/SOLUTIONS/SERVICES OFFERED
- TABLE 125 IPG PHOTONICS CORPORATION: COMPANY OVERVIEW
- TABLE 126 IPG PHOTONICS CORPORATION: PRODUCTS/SOLUTIONS/SERVICES OFFERED
- TABLE 127 SIGNIFY HOLDING: COMPANY OVERVIEW
- TABLE 128 SIGNIFY HOLDING: PRODUCTS/SOLUTIONS/SERVICES OFFERED
- TABLE 129 CORNING INCORPORATED: COMPANY OVERVIEW
- TABLE 130 CORNING INCORPORATED: PRODUCTS/SOLUTIONS/SERVICES OFFERED
- TABLE 131 CORNING INCORPORATED: PRODUCT LAUNCHES
- TABLE 132 CORNING INCORPORATED: DEALS
- TABLE 133 ON SEMICONDUCTOR CORPORATION: COMPANY OVERVIEW
- TABLE 134 ON SEMICONDUCTOR CORPORATION.: PRODUCTS/SOLUTIONS/ SERVICES OFFERED
- TABLE 135 ON SEMICONDUCTOR CORPORATION: DEALS
- TABLE 136 OFS FITEL, LLC: COMPANY OVERVIEW
- TABLE 137 OFS FITEL, LLC.: PRODUCTS/SOLUTIONS/SERVICES OFFERED
- TABLE 138 OFS FITEL, LLC: PRODUCT LAUNCHES
- TABLE 139 COHERENT CORP: COMPANY OVERVIEW
- TABLE 140 COHERENT CORP.: PRODUCTS/SOLUTIONS/SERVICES OFFERED
- TABLE 141 NICHIA CORPORATION: COMPANY OVERVIEW
- TABLE 142 NICHIA CORPORATION: PRODUCTS/SOLUTIONS/SERVICES OFFERED
- TABLE 143 NICHIA CORPORATION: PRODUCT LAUNCHES
- TABLE 144 TOPTICA PHOTONICS: COMPANY OVERVIEW
- TABLE 145 M SQUARED LASERS LIMITED: COMPANY OVERVIEW
- TABLE 146 FREEDOM PHOTONICS LLC: COMPANY OVERVIEW
- TABLE 147 SCINTIL PHOTONICS: COMPANY OVERVIEW
- TABLE 148 PHOTONICS INDUSTRIES INTERNATIONAL. INC: COMPANY OVERVIEW
- TABLE 149 LUMILEDS HOLDINGS B.V.: COMPANY OVERVIEW
- TABLE 150 EXCELITAS TECHNOLOGIES CORP.: COMPANY OVERVIEW
- TABLE 151 TRUMPF: COMPANY OVERVIEW
- TABLE 152 EMERSON ELECTRIC CO: COMPANY OVERVIEW
- TABLE 153 SAMSUNG ELECTRONICS: COMPANY OVERVIEW
List of Figures
- FIGURE 1 PHOTONICS MARKET: SEGMENTATION AND REGIONAL SNAPSHOT
- FIGURE 2 PHOTONICS MARKET: RESEARCH DESIGN
- FIGURE 3 MARKET SIZE ESTIMATION METHODOLOGY: SUPPLY-SIDE APPROACH
- FIGURE 4 MARKET SIZE ESTIMATION METHODOLOGY: DEMAND-SIDE APPROACH
- FIGURE 5 MARKET SIZE ESTIMATION METHODOLOGY: REVENUE OF MARKET PLAYERS, 2024
- FIGURE 6 MARKET SIZE ESTIMATION METHODOLOGY: BOTTOM-UP APPROACH
- FIGURE 7 MARKET SIZE ESTIMATION METHODOLOGY: TOP-DOWN APPROACH
- FIGURE 8 PHOTONICS MARKET: DATA TRIANGULATION
- FIGURE 9 LIGHT SOURCES SEGMENT TO DOMINATE MARKET IN 2025
- FIGURE 10 SILICON SEGMENT TO REGISTER HIGHEST CAGR DURING FORECAST PERIOD
- FIGURE 11 INFORMATION & COMMUNICATION TECHNOLOGY SEGMENT TO EXHIBIT HIGHEST CAGR FROM 2025 TO 2030
- FIGURE 12 INFRARED SEGMENT TO RECORD HIGHEST CAGR BETWEEN 2025 AND 2030
- FIGURE 13 MEDIA & TELECOMMUNICATION SEGMENT TO REGISTER HIGHEST CAGR DURING FORECAST PERIOD
- FIGURE 14 ASIA PACIFIC TO REGISTER HIGHEST CAGR DURING FORECAST PERIOD
- FIGURE 15 GROWING USE OF PHOTONICS IN CONSTRUCTION AND MEDIA & TELECOMMUNICATION INDUSTRIES TO CREATE LUCRATIVE OPPORTUNITIES FOR MARKET PLAYERS
- FIGURE 16 LIGHT SOURCE SEGMENT TO REGISTER FASTEST GROWTH DURING FORECAST PERIOD
- FIGURE 17 SILICON SEGMENT TO REGISTER FASTEST GROWTH DURING FORECAST PERIOD
- FIGURE 18 INFORMATION & TELECOMMUNICATION SEGMENT TO REGISTER FASTEST GROWTH BETWEEN 2025 AND 2030
- FIGURE 19 INFRARED SEGMENT TO REGISTER FASTEST GROWTH FROM 2025 TO 2030
- FIGURE 20 OTHER END-USE INDUSTRIES SEGMENT TO REGISTER FASTEST GROWTH DURING FORECAST PERIOD
- FIGURE 21 CHINA TO REGISTER HIGHEST CAGR DURING FORECAST PERIOD
- FIGURE 22 PHOTONICS MARKET: DRIVERS, RESTRAINTS, OPPORTUNITIES, AND CHALLENGES
- FIGURE 23 PHOTONICS MARKET: USE OF GENERATIVE AI
- FIGURE 24 TRENDS/DISRUPTIONS IMPACTING CUSTOMER BUSINESS
- FIGURE 25 PHOTONICS MARKET: VALUE CHAIN ANALYSIS
- FIGURE 26 PHOTONICS MARKET: INVESTMENT AND FUNDING SCENARIO, 2023-2025 (USD MILLION)
- FIGURE 27 PHOTONICS MARKET: ECOSYSTEM ANALYSIS
- FIGURE 28 NUMBER OF PATENTS GRANTED PER YEAR, 2015-2024
- FIGURE 29 LEGAL STATUS OF PATENTS, 2015-2024
- FIGURE 30 PATENT ANALYSIS RELATED TO PHOTONICS TECHNOLOGY, BY JURISDICTION, 2015-2024
- FIGURE 31 TOP 10 COMPANIES WITH HIGHEST NUMBER OF PATENTS IN LAST 10 YEARS
- FIGURE 32 IMPORT DATA FOR HS CODE 854140-COMPLIANT PRODUCTS, BY COUNTRY, 2021-2024 (USD THOUSAND)
- FIGURE 33 EXPORT DATA FOR HS CODE 854140-COMPLIANT PRODUCTS, BY COUNTRY, 2021-2024 (USD THOUSAND)
- FIGURE 34 PHOTONICS MARKET: PORTER'S FIVE FORCES ANALYSIS
- FIGURE 35 INFLUENCE OF STAKEHOLDERS ON BUYING PROCESS FOR TOP THREE END-USE INDUSTRIES
- FIGURE 36 KEY BUYING CRITERIA FOR TOP THREE END-USE INDUSTRIES
- FIGURE 37 LIGHT SOURCES SEGMENT TO HOLD LARGEST SHARE OF PHOTONICS MARKET IN 2025
- FIGURE 38 INFRARED SEGMENT TO ACCOUNT FOR LARGEST SHARE OF PHOTONICS MARKET IN 2025
- FIGURE 39 INFORMATION & COMMUNICATION TECHNOLOGY SEGMENT TO HOLD LARGEST MARKET SHARE IN 2025
- FIGURE 40 SILICON SEGMENT TO HOLD LARGEST SHARE OF PHOTONICS MARKET IN 2025
- FIGURE 41 MEDIA & TELECOMMUNICATION SEGMENT TO LEAD PHOTONICS MARKET IN 2025
- FIGURE 42 ASIA PACIFIC TO BE FASTEST-GROWING PHOTONICS MARKET DURING FORECAST PERIOD
- FIGURE 43 ASIA PACIFIC: PHOTONICS MARKET SNAPSHOT
- FIGURE 44 NORTH AMERICA: PHOTONICS MARKET SNAPSHOT
- FIGURE 45 EUROPE: PHOTONICS MARKET SNAPSHOT
- FIGURE 46 PHOTONICS MARKET SHARE ANALYSIS, 2024
- FIGURE 47 PHOTONICS MARKET: REVENUE ANALYSIS OF KEY PLAYERS, 2020-2024 (USD BILLION)
- FIGURE 48 PHOTONICS MARKET: BRAND/PRODUCT COMPARATIVE ANALYSIS
- FIGURE 49 PHOTONICS MARKET: COMPANY EVALUATION MATRIX (KEY PLAYERS), 2024
- FIGURE 50 PHOTONICS MARKET: COMPANY FOOTPRINT
- FIGURE 51 PHOTONICS MARKET: COMPANY EVALUATION MATRIX (STARTUPS/SMES), 2024
- FIGURE 52 PHOTONICS MARKET: EV/EBITDA OF KEY VENDORS
- FIGURE 53 PHOTONICS MARKET: YEAR-TO-DATE (YTD) PRICE TOTAL RETURN, 2020-2024
- FIGURE 54 AMS-OSRAM.: COMPANY SNAPSHOT
- FIGURE 55 HAMAMATSU PHOTONICS K.K.: COMPANY SNAPSHOT
- FIGURE 56 LUMENTUM OPERATIONS LLC.: COMPANY SNAPSHOT
- FIGURE 57 IPG PHOTONICS CORPORATION.: COMPANY SNAPSHOT
- FIGURE 58 SIGNIFY HOLDING: COMPANY SNAPSHOT
- FIGURE 59 CORNING INCORPORATED: COMPANY SNAPSHOT
- FIGURE 60 ON SEMICONDUCTOR CORPORATION.: COMPANY SNAPSHOT
- FIGURE 61 COHERENT CORP.: COMPANY SNAPSHOT

