
PUBLISHER: MarketsandMarkets | PRODUCT CODE: 1810321

PUBLISHER: MarketsandMarkets | PRODUCT CODE: 1810321
Real-time Location Systems Market by Offering, Technology, Application - Global Forecast to 2030
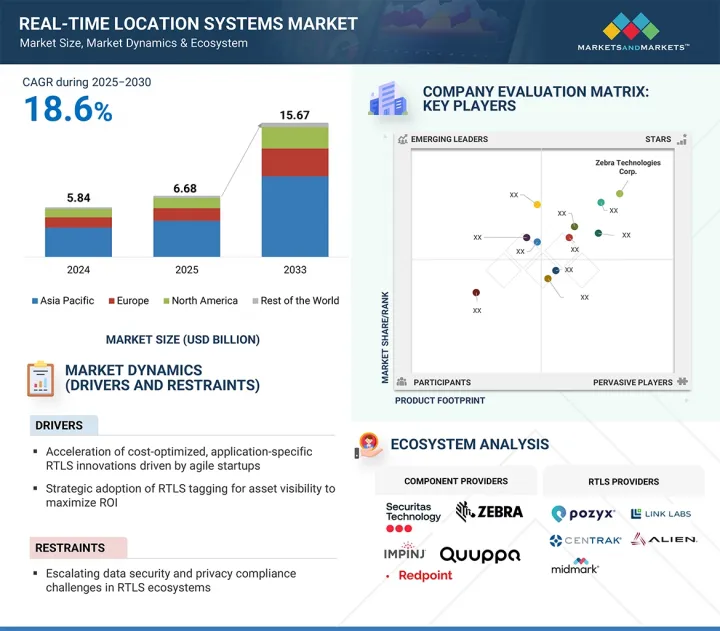
The global real-time location systems (RTLS) market is projected to expand from USD 6.68 billion in 2025 to USD 15.67 billion by 2030, registering a robust CAGR of 18.6%. RTLS solutions, also referred to as local positioning or tracking systems, are designed to automatically identify and pinpoint the real-time location of assets or individuals across a variety of environments and industries. These systems rely on tags or badges affixed to objects or worn by personnel, which transmit location data wirelessly to fixed receivers, readers, or access points within the coverage area.
| Scope of the Report | |
|---|---|
| Years Considered for the Study | 2021-2030 |
| Base Year | 2024 |
| Forecast Period | 2025-2030 |
| Units Considered | Value (USD Billion) |
| Segments | By Offering, Technology, Application, Vertical, and Region |
| Regions covered | North America, Europe, APAC, RoW |
Modern RTLS deployments leverage a range of wireless technologies, including radio frequency identification (RFID), Wi-Fi, ultrasound, infrared (IR), ultra-wideband (UWB), and Bluetooth Low Energy (BLE), with the choice of technology depending on the specific application requirements. The growing need for accurate asset tracking, operational visibility, and process optimization, combined with the proven ability of RTLS to deliver measurable return on investment, is driving increased adoption across sectors such as healthcare, manufacturing, logistics, and transportation.
" Growing adoption of personnel tracking applications to boost the RTLS market expansion."
RTLS platforms are increasingly used across industries to monitor the workflow on the operational floor. Many organizations' primary concern is keeping track of people/staff inside a predetermined area. In manufacturing, healthcare, and many other industries, keeping track of personnel can provide valuable information to the organization. This helps organizations make split-second decisions, protect staff, and avoid disasters. For this purpose, gadgets such as tags/badges and gateways are used.
Patient and staff safety is a top priority in the healthcare sector. RTLS solutions are deployed in the healthcare sector for fall detection and prevention, wander management, and infant protection applications; all these use cases require personnel/staff tracking and monitoring. An RTLS continuously provides data related to staff movements, and real-time visibility on an operational floor in any organization would increase work efficiency. Real-time staff tracking using RTLS allows the centralized system to identify staff fatigue and take appropriate measures. In the sports & entertainment vertical, the personnel/staff locating and monitoring application has different purposes than other verticals. For instance, in the sports industry, using RTLS solutions, a coach can record the exact movement of the players on the field; this information is valuable in enhancing the players' performance and developing strategies against competitors.
" Industry 4.0 adoption drives RTLS integration in manufacturing for safety and efficiency"
The manufacturing vertical includes automotive, aerospace, heavy equipment, tire, glass, and other manufacturing companies. This vertical has a vast market potential for RTLS solutions mainly because of the increasing awareness about asset/staff safety and rapid industrialization, especially in developing regions such as the Asia Pacific and RoW. The RTLS solution helps improve safety in manufacturing plants by tracking every movement of assets, staff, and vehicles. RTLS can also monitor the proximity between workers and forklifts, ensuring the safety of assets and the workforce by preventing accidents, collisions, and controlling overspeed. Moreover, the RTLS increases operational efficiency by optimizing workflows and improving employee productivity with the help of AI-integrated intelligent systems. RTLS can also be utilized in other applications, such as visitor location tracking, wayfinding, staff location tracking, secure restricted areas, production/manufacturing process tracking, condition monitoring, cold chain monitoring, equipment tracking, evacuation, and emergency accountability. With the advent of Industry 4.0, large-scale companies are expected to increasingly rely on RTLS solutions to gain greater visibility and facilitate efficient operations to improve productivity, quality, and lead time. With the emergence of Industry 4.0, RTLS is likely to be a key technology in the manufacturing environment.
"Strong industrial base and R&D capabilities are predicted to drive the RTLS market in Europe"
Europe is expected to witness substantial growth in the real-time location systems (RTLS) market during the forecast period, driven primarily by the expansion of its automotive and manufacturing industries. Key markets such as the UK, Germany, and France are leading the region in RTLS adoption, accounting for the highest levels of investment. Meanwhile, other European countries are gradually increasing their uptake, reflecting a broader regional shift toward advanced tracking technologies.
The demand for RTLS in Europe is set to rise as organizations increasingly integrate these solutions to optimize processes, enhance operational efficiency, and support business growth. The region also holds a strong position in research and development for location-based technologies, with a robust innovation ecosystem that fuels advancements in RTLS capabilities. Furthermore, the widespread use of location-based and mapping services by both enterprises and individual consumers underpins market expansion. As industries continue to embrace automation, digitalization, and Industry 4.0 practices, RTLS adoption across Europe is poised to accelerate, positioning the region as a key contributor to global market growth.
Breakdown of primaries
A variety of executives from key organizations operating in the RTLS market, including CEOs, marketing directors, and innovation and technology directors, were interviewed in depth.
- By Company Type: Tier 1 - 45%, Tier 2 - 20%, and Tier 3 - 35%
- By Designation: Directors - 35%, C-level - 25%, and Others - 4%
- By Region: North America - 40%, Europe - 25%, Asia Pacific - 30%, and RoW - 5%
Note: Three tiers of companies are defined based on their total revenue as of 2024: tier 3 = revenue less than USD 500 million; tier 2 = revenue between USD 500 million and USD 3 billion; and tier 1 = revenue more than USD 3 billion. Other designations include sales managers, marketing managers, and product managers.
Major players profiled in this report are as follows: Securitas AB (Sweden), Zebra Technologies Corp. (US), Impinj, Inc. (US), GE Healthcare (US), Siemens (Germany), TeleTracking Technologies, Inc. (US), Ubisense Ltd. (UK), AiRISTA (US), Sonitor Technologies (US), Alien Technology, LLC (US), CenTrak, Inc. (US), Quuppa (Finland), Qorvo Inc. (US), Midmark Corporation (US), Litum (Turkey), Redpoint Positioning Corporation (US), Eliko (Estonia), BlueIOT (Beijing) Technology Co., Ltd. (China). These leading companies possess a wide portfolio of products, establishing a prominent presence in established as well as emerging markets.
The study provides a detailed competitive analysis of these key players in the RTLS market, presenting their company profiles, most recent developments, and key market strategies.
Research Coverage
This report has segmented the real-time location systems market based on offering, technology, application, vertical, and region. The real-time location systems market, based on offerings, has been segmented into hardware, software, and services. Based on technology, the market has been segmented into RFID, Wi-Fi, UWB, BLE, ultrasound, infrared, GPS, and other technologies. Based on applications, the market has been segmented into inventory/asset tracking & management, personnel locating & monitoring, access control & security, environmental monitoring, yard, dock, fleet, & warehouse management & monitoring, supply chain management & automation, and others. Based on vertical, the market has been segmented into healthcare, manufacturing & automotive, retail, transportation & logistics, government, education, oil & gas, mining, sports & entertainment, and other verticals. The market has been segmented into four regions - North America, Asia Pacific, Europe, and the Rest of the World (RoW).
Reasons to buy the report
The report will help the leaders/new entrants in this market with information on the closest approximations of the revenue numbers for the overall market and the subsegments. It will also help stakeholders understand the competitive landscape and gain more insights to better position their businesses and plan suitable go-to-market strategies. The report also helps stakeholders understand the pulse of the real-time location systems market and provides information on key market drivers, restraints, challenges, and opportunities.
Key Benefits of Buying the Report
- Analysis of key drivers (Increasing development of cost-effective and application-specific RTLS solutions by startups, rising adoption of RTLS tags for asset tracking to improve return on investment, growing emphasis on maintaining patient and staff safety in healthcare facilities, burgeoning demand for ultra-wideband-powered RTLS solutions due to high accuracy), restraints (Data security and privacy concerns, high installation and maintenance costs), opportunities (Rising need for efficient resource utilization and workflow optimization, increasing popularity of hybrid RTLS solutions, escalating adoption of healthcare IoT solutions. Increasing applications of RTLS technology in the sports and entertainment sector, rapid industrialization and economic growth in developing countries, and challenges (Concerns regarding trade-offs between range and accuracy, and interoperability issues due to lack of standardization).
- Product Development/Innovation: Detailed insights on upcoming technologies, research and development activities, and product launches in the real-time location systems market.
- Market Development: Comprehensive information about lucrative markets - the report analyzes the real-time location systems market across varied regions.
- Market Diversification: Exhaustive information about new products/services, untapped geographies, recent developments, and investments in the real-time location systems market.
- Competitive Assessment: In-depth assessment of market shares, growth strategies, and service offerings of leading players such as Securitas AB (Sweden), Zebra Technologies Corp. (US), Impinj, Inc. (US), Siemens (Germany), and Centrak, Inc. (US).
TABLE OF CONTENTS
1 INTRODUCTION
- 1.1 STUDY OBJECTIVES
- 1.2 MARKET DEFINITION
- 1.3 STUDY SCOPE
- 1.3.1 MARKETS COVERED AND REGIONAL SCOPE
- 1.3.2 INCLUSIONS AND EXCLUSIONS
- 1.3.3 YEARS CONSIDERED
- 1.4 CURRENCY CONSIDERED
- 1.5 UNIT CONSIDERED
- 1.6 LIMITATIONS
- 1.7 STAKEHOLDERS
- 1.8 SUMMARY OF CHANGES
2 RESEARCH METHODOLOGY
- 2.1 RESEARCH DATA
- 2.1.1 SECONDARY AND PRIMARY RESEARCH
- 2.1.2 SECONDARY DATA
- 2.1.2.1 List of key secondary sources
- 2.1.2.2 Key data from secondary sources
- 2.1.3 PRIMARY DATA
- 2.1.3.1 List of primary interview participants
- 2.1.3.2 Key data from primary sources
- 2.1.3.3 Key industry insights
- 2.1.3.4 Breakdown of primaries
- 2.2 MARKET SIZE ESTIMATION
- 2.2.1 TOP-DOWN APPROACH
- 2.2.1.1 Approach to arrive at market size using top-down analysis (supply side)
- 2.2.2 BOTTOM-UP APPROACH
- 2.2.2.1 Approach to arrive at market size using bottom-up analysis (demand side)
- 2.2.1 TOP-DOWN APPROACH
- 2.3 MARKET BREAKDOWN AND DATA TRIANGULATION
- 2.4 RESEARCH ASSUMPTIONS
- 2.5 RESEARCH LIMITATIONS
- 2.6 RISK ANALYSIS
3 EXECUTIVE SUMMARY
4 PREMIUM INSIGHTS
- 4.1 ATTRACTIVE OPPORTUNITIES FOR PLAYERS IN RTLS MARKET
- 4.2 RTLS MARKET, BY TECHNOLOGY
- 4.3 RTLS MARKET, BY APPLICATION
- 4.4 RTLS MARKET IN NORTH AMERICA, BY VERTICAL AND COUNTRY
- 4.5 RTLS MARKET, BY GEOGRAPHY
5 MARKET OVERVIEW
- 5.1 INTRODUCTION
- 5.2 MARKET DYNAMICS
- 5.2.1 DRIVERS
- 5.2.1.1 High emphasis on safety, compliance, and operational efficiency across enterprises
- 5.2.1.2 Rising need for real-time visibility of assets in industries
- 5.2.1.3 Growing safety and security concerns in healthcare sector
- 5.2.1.4 Surging adoption of UWB-powered RTLS solutions
- 5.2.2 RESTRAINTS
- 5.2.2.1 Data security and privacy issues
- 5.2.2.2 High installation and maintenance costs
- 5.2.3 OPPORTUNITIES
- 5.2.3.1 Rising need for efficient resource utilization and workflow optimization
- 5.2.3.2 Mounting demand for hybrid RTLS solutions
- 5.2.3.3 Increasing deployment of IoT solutions in healthcare sector
- 5.2.3.4 Emerging applications of RTLS technology
- 5.2.3.5 Growing focus of RTLS vendors on untapped regions and emerging use cases
- 5.2.4 CHALLENGES
- 5.2.4.1 Persistent trade-offs in RTLS design
- 5.2.4.2 Interoperability issues due to lack of standardized protocols
- 5.2.1 DRIVERS
- 5.3 TRENDS/DISRUPTIONS IMPACTING CUSTOMER BUSINESS
- 5.4 VALUE CHAIN ANALYSIS
- 5.5 ECOSYSTEM ANALYSIS
- 5.6 INVESTMENT AND FUNDING SCENARIO
- 5.7 TECHNOLOGY ANALYSIS
- 5.7.1 KEY TECHNOLOGIES
- 5.7.1.1 Hybrid RTLS
- 5.7.2 COMPLEMENTARY TECHNOLOGIES
- 5.7.2.1 IoT
- 5.7.2.2 Artificial intelligence
- 5.7.1 KEY TECHNOLOGIES
- 5.8 TRADE ANALYSIS
- 5.8.1 IMPORT SCENARIO (HS CODE 852352)
- 5.8.2 EXPORT SCENARIO (HS CODE 852352)
- 5.9 PATENT ANALYSIS
- 5.10 KEY CONFERENCES AND EVENTS, 2025-2026
- 5.11 CASE STUDY ANALYSIS
- 5.11.1 NGK CERAMICS ADOPTS QUUPPA'S RTLS TAGS TO STREAMLINE INVENTORY MANAGEMENT AND ADDRESS PRODUCTION DELAYS
- 5.11.2 ADVENTIST HEALTH WHITE MEMORIAL AND TAGNOS PARTNER TO OPTIMIZE OPERATING ROOM EFFICIENCY USING RTLS TAGS
- 5.11.3 PIEDMONT HEALTHCARE ADOPTS VIZZIA'S RTLS SOLUTION TO STANDARDIZE ASSET MANAGEMENT
- 5.11.4 DYER ENGINEERING LEVERAGES THINKIN'S QUUPPA TECHNOLOGY-BASED RTLS FOR REAL-TIME ASSET TRACKING
- 5.12 REGULATORY LANDSCAPE
- 5.12.1 REGULATORY BODIES, GOVERNMENT AGENCIES, AND OTHER ORGANIZATIONS
- 5.12.2 STANDARDS
- 5.13 PORTER'S FIVE FORCES ANALYSIS
- 5.13.1 BARGAINING POWER OF SUPPLIERS
- 5.13.2 BARGAINING POWER OF BUYERS
- 5.13.3 INTENSITY OF COMPETITIVE RIVALRY
- 5.13.4 THREAT OF NEW ENTRANTS
- 5.13.5 THREAT OF SUBSTITUTES
- 5.14 KEY STAKEHOLDERS AND BUYING CRITERIA
- 5.14.1 KEY STAKEHOLDERS IN BUYING PROCESS
- 5.14.2 BUYING CRITERIA
- 5.15 PRICING ANALYSIS
- 5.15.1 PRICING TREND OF RTLS TAGS/BADGES, 2021-2024
- 5.15.2 PRICING RANGE OF RTLS TAGS/BADGES OFFERED BY KEY PLAYERS, 2024
- 5.15.3 PRICING RANGE OF RTLS TAGS/BADGES, BY TECHNOLOGY, 2024
- 5.15.4 AVERAGE SELLING PRICE TREND OF RTLS TAGS/BADGES, BY REGION, 2021-2024
- 5.16 IMPACT OF AI/GEN AI ON RTLS MARKET
- 5.16.1 INTRODUCTION
- 5.16.2 AI/GEN USE CASES AI IN RTLS APPLICATIONS
- 5.16.2.1 Healthcare
- 5.16.2.2 Manufacturing & logistics
- 5.16.3 AI/GEN AI USE CASES IN RTLS MARKET
- 5.17 IMPACT OF 2025 US TARIFF ON RTLS MARKET
- 5.17.1 INTRODUCTION
- 5.17.2 KEY TARIFF RATES
- 5.17.3 PRICE IMPACT ANALYSIS
- 5.17.4 IMPACT ON COUNTRIES/REGIONS
- 5.17.4.1 US
- 5.17.4.2 Europe
- 5.17.4.3 Asia Pacific
- 5.17.5 IMPACT ON INDUSTRIES
6 RTLS MARKET, BY OFFERING
- 6.1 INTRODUCTION
- 6.2 HARDWARE
- 6.2.1 TAGS/BADGES
- 6.2.1.1 Ability to deliver accurate information critical to RTLS functioning to fuel segmental growth
- 6.2.2 READERS/TRACKERS/ACCESS POINTS
- 6.2.2.1 Use in retail, manufacturing, transportation, and other industrial applications to bolster segmental growth
- 6.2.3 OTHER HARDWARE PRODUCTS
- 6.2.1 TAGS/BADGES
- 6.3 SOFTWARE
- 6.3.1 ADOPTION IN LOCATION TRACKING, ASSET TRACKING, AND ANALYTICS PURPOSES TO FOSTER SEGMENTAL GROWTH
- 6.4 SERVICES
- 6.4.1 DEPLOYMENT & INTEGRATION
- 6.4.1.1 Use of hybrid RTLS in hospitals to augment segmental growth
- 6.4.2 SUPPORT & MAINTENANCE
- 6.4.2.1 Need for smooth and uninterrupted RTLS functioning to boost market growth
- 6.4.3 CONSULTING
- 6.4.3.1 Strong focus on process improvement and workplace security to fuel segmental growth
- 6.4.1 DEPLOYMENT & INTEGRATION
7 RTLS MARKET, BY TECHNOLOGY
- 7.1 INTRODUCTION
- 7.2 RFID
- 7.2.1 ABILITY TO PENETRATE THROUGH WALLS AND FLOORS TO CONTRIBUTE TO SEGMENTAL GROWTH
- 7.3 WI-FI
- 7.3.1 COST EFFICIENCY, IMPROVED OPERATIONAL BENEFITS, AND HIGH RETURNS ON INVESTMENT TO ACCELERATE SEGMENTAL GROWTH
- 7.4 UWB
- 7.4.1 SUPERIOR ACCURACY AND ABILITY TO TRACK MULTIPLE OBJECTS SIMULTANEOUSLY TO FUEL SEGMENTAL GROWTH
- 7.5 BLE
- 7.5.1 LOW POWER CONSUMPTION, COST-EFFECTIVENESS, LONG BATTERY LIFE, AND EASY DEPLOYMENT BENEFITS TO DRIVE MARKET
- 7.6 ULTRASOUND
- 7.6.1 HIGH ADOPTION IN HEALTHCARE, MANUFACTURING, AND AUTOMOTIVE SECTORS TO EXPEDITE SEGMENTAL GROWTH
- 7.7 INFRARED
- 7.7.1 INTEGRATION WITH RF AND WI-FI TECHNOLOGIES TO AUGMENT SEGMENTAL GROWTH
- 7.8 OTHER TECHNOLOGIES
8 RTLS MARKET, BY APPLICATION
- 8.1 INTRODUCTION
- 8.2 INVENTORY/ASSET TRACKING & MANAGEMENT
- 8.2.1 RISING NEED TO REGULARLY TRACK HIGH-VALUE MEDICAL EQUIPMENT AND MATERIALS TO FOSTER SEGMENTAL GROWTH
- 8.3 PERSONNEL LOCATING & MONITORING
- 8.3.1 ADOPTION OF RTLS PLATFORMS TO HELP ORGANIZATIONS MAKE SPLIT-SECOND DECISIONS AND PROTECT STAFF TO DRIVE MARKET
- 8.4 ACCESS CONTROL & SECURITY
- 8.4.1 RELIANCE ON ADVANCED ANALYTICS AND REAL-TIME ALERTS FOR RISK MANAGEMENT TO FUEL SEGMENTAL GROWTH
- 8.5 ENVIRONMENTAL MONITORING
- 8.5.1 REQUIREMENT FOR ENVIRONMENTAL MONITORING FOR OPTIMAL PERFORMANCE TO BOOST SEGMENTAL GROWTH
- 8.6 YARD, DOCK, FLEET & WAREHOUSE MANAGEMENT & MONITORING
- 8.6.1 OPTIMIZED SPACE PLANNING AND MOVEMENT TRACKING ATTRIBUTES OF RTLS SOLUTIONS TO FUEL SEGMENTAL GROWTH
- 8.7 SUPPLY CHAIN MANAGEMENT & AUTOMATION
- 8.7.1 FOCUS ON STREAMLINING INVENTORY AND ASSET MANAGEMENT TO CONTRIBUTE TO SEGMENTAL GROWTH
- 8.8 OTHER APPLICATIONS
9 RTLS MARKET, BY VERTICAL
- 9.1 INTRODUCTION
- 9.2 HEALTHCARE
- 9.2.1 NEED FOR INVENTORY TRACKING, STAFF AND PATIENT TRACKING, AND ACCESS CONTROL TO BOOST SEGMENTAL GROWTH
- 9.3 MANUFACTURING & AUTOMOTIVE
- 9.3.1 INCREASING AWARENESS ABOUT ASSET/STAFF SAFETY TO BOLSTER SEGMENTAL GROWTH
- 9.4 RETAIL
- 9.4.1 EMPHASIS ON ENHANCING CUSTOMER EXPERIENCE BY PROVIDING PERSONALIZED AND UNIQUE INTERFACES TO DRIVE MARKET
- 9.5 TRANSPORTATION & LOGISTICS
- 9.5.1 FOCUS ON OPTIMIZING SUPPLY CHAIN OPERATIONS THROUGH REAL-TIME TRACKING TO FOSTER SEGMENTAL GROWTH
- 9.6 GOVERNMENT
- 9.6.1 NEED FOR REAL-TIME VISIBILITY OF ASSETS TO ACCELERATE SEGMENTAL GROWTH
- 9.7 EDUCATION
- 9.7.1 INCREASING FOCUS ON RESEARCH DATA PROTECTION TO EXPEDITE SEGMENTAL GROWTH
- 9.8 OIL & GAS AND MINING
- 9.8.1 GROWING EMPHASIS ON ENSURING EFFICIENCY AND PERSONNEL SAFETY TO FOSTER SEGMENTAL GROWTH
- 9.9 SPORTS & ENTERTAINMENT
- 9.9.1 INCREASING FOCUS ON ON-FIELD PERFORMANCE AND ANALYTICS TO AUGMENT SEGMENTAL GROWTH
- 9.10 OTHER VERTICALS
10 RTLS MARKET, BY REGION
- 10.1 INTRODUCTION
- 10.2 NORTH AMERICA
- 10.2.1 MACROECONOMIC OUTLOOK FOR NORTH AMERICA
- 10.2.2 US
- 10.2.2.1 Mounting need for operational efficiency and precise asset tracking to bolster market growth
- 10.2.3 CANADA
- 10.2.3.1 Growing focus on tracking hospital staff and medical equipment to accelerate market growth
- 10.2.4 MEXICO
- 10.2.4.1 Rapid expansion of automotive business to contribute to market expansion
- 10.3 EUROPE
- 10.3.1 MACROECONOMIC OUTLOOK FOR EUROPE
- 10.3.2 GERMANY
- 10.3.2.1 Rising deployment of advanced manufacturing and information and communications technologies to boost market growth
- 10.3.3 UK
- 10.3.3.1 Growing emphasis on product and employee safety in services and manufacturing sectors to support market growth
- 10.3.4 FRANCE
- 10.3.4.1 Increasing focus on enhancing additive manufacturing capabilities to augment market growth
- 10.3.5 ITALY
- 10.3.5.1 Rising development of modern healthcare infrastructure to fuel market expansion
- 10.3.6 SPAIN
- 10.3.6.1 Government-led initiatives promoting digital transformation, smart infrastructure, and Industry 4.0 to drive market
- 10.3.7 REST OF EUROPE
- 10.4 ASIA PACIFIC
- 10.4.1 MACROECONOMIC OUTLOOK FOR ASIA PACIFIC
- 10.4.2 CHINA
- 10.4.2.1 Increasing investment in advanced location tracking and identification technologies to accelerate market growth
- 10.4.3 JAPAN
- 10.4.3.1 Rising adoption of smart healthcare technologies to foster market expansion
- 10.4.4 AUSTRALIA
- 10.4.4.1 Growing emphasis on enhancing technological capabilities and streamlining extensive operations to bolster market growth
- 10.4.5 SOUTH KOREA
- 10.4.5.1 Rising deployment of advanced technologies in industrial sectors to drive market
- 10.4.6 INDIA
- 10.4.6.1 Rapid digital transformation and focus on smart infrastructure to boost market growth
- 10.4.7 SINGAPORE
- 10.4.7.1 Growing development of intelligent transportation solutions to augment market growth
- 10.4.8 PHILIPPINES
- 10.4.8.1 Increasing investment in digital infrastructure and smart technologies to support market growth
- 10.4.9 MALAYSIA
- 10.4.9.1 Rising emphasis on efficient asset tracking and production optimization to contribute to market growth
- 10.4.10 REST OF ASIA PACIFIC
- 10.5 ROW
- 10.5.1 MACROECONOMIC OUTLOOK FOR ROW
- 10.5.2 MIDDLE EAST
- 10.5.2.1 Implementation of government-led safety mandates to accelerate market growth
- 10.5.2.2 GCC countries
- 10.5.2.3 Rest of Middle East
- 10.5.3 AFRICA
- 10.5.3.1 Mounting investment in digital transformation initiatives in mining sector to create market growth opportunities
- 10.5.4 SOUTH AMERICA
- 10.5.4.1 Rising adoption of advanced technologies to facilitate cost reduction in manufacturing sector to drive market
11 COMPETITIVE LANDSCAPE
- 11.1 OVERVIEW
- 11.2 KEY PLAYER STRATEGIES/RIGHT TO WIN, 2021-2025
- 11.3 REVENUE ANALYSIS, 2020-2024
- 11.4 MARKET SHARE ANALYSIS, 2024
- 11.5 COMPANY VALUATION AND FINANCIAL METRICS
- 11.6 BRAND/PRODUCT COMPARISON
- 11.7 COMPANY EVALUATION MATRIX: KEY PLAYERS, 2024
- 11.7.1 STARS
- 11.7.2 EMERGING LEADERS
- 11.7.3 PERVASIVE PLAYERS
- 11.7.4 PARTICIPANTS
- 11.7.5 COMPANY FOOTPRINT: KEY PLAYERS, 2024
- 11.7.5.1 Company footprint
- 11.7.5.2 Region footprint
- 11.7.5.3 Offering footprint
- 11.7.5.4 Vertical footprint
- 11.7.5.5 Technology footprint
- 11.8 COMPANY EVALUATION MATRIX: STARTUPS/SMES, 2024
- 11.8.1 PROGRESSIVE COMPANIES
- 11.8.2 RESPONSIVE COMPANIES
- 11.8.3 DYNAMIC COMPANIES
- 11.8.4 STARTING BLOCKS
- 11.8.5 COMPETITIVE BENCHMARKING: STARTUPS/SMES, 2024
- 11.8.5.1 Detailed list of key startups/SMEs
- 11.8.5.2 Competitive benchmarking of key startups/SMEs
- 11.9 COMPETITIVE SCENARIO
- 11.9.1 PRODUCT LAUNCHES
- 11.9.2 DEALS
12 COMPANY PROFILES
- 12.1 KEY PLAYERS
- 12.1.1 SECURITAS AB
- 12.1.1.1 Business overview
- 12.1.1.2 Products/Solutions/Services offered
- 12.1.1.3 Recent developments
- 12.1.1.3.1 Deals
- 12.1.1.4 MnM view
- 12.1.1.4.1 Key strengths/Right to win
- 12.1.1.4.2 Strategic choices
- 12.1.1.4.3 Weaknesses/Competitive threats
- 12.1.2 ZEBRA TECHNOLOGIES CORP.
- 12.1.2.1 Business overview
- 12.1.2.2 Products/Solutions/Services offered
- 12.1.2.3 Recent developments
- 12.1.2.3.1 Deals
- 12.1.2.4 MnM view
- 12.1.2.4.1 Key strengths/Right to win
- 12.1.2.4.2 Strategic choices
- 12.1.2.4.3 Weaknesses/Competitive threats
- 12.1.3 IMPINJ, INC.
- 12.1.3.1 Business overview
- 12.1.3.2 Products/Solutions/Services offered
- 12.1.3.3 Recent developments
- 12.1.3.3.1 Product launches
- 12.1.3.4 MnM view
- 12.1.3.4.1 Key strengths/Right to win
- 12.1.3.4.2 Strategic choices
- 12.1.3.4.3 Weaknesses/Competitive threats
- 12.1.4 SIEMENS
- 12.1.4.1 Business overview
- 12.1.4.2 Products/Solutions/Services offered
- 12.1.4.3 MnM view
- 12.1.4.3.1 Key strengths/Right to win
- 12.1.4.3.2 Strategic choices
- 12.1.4.3.3 Weaknesses/Competitive threats
- 12.1.5 CENTRAK, INC.
- 12.1.5.1 Business overview
- 12.1.5.2 Products/Solutions/Services offered
- 12.1.5.3 Recent developments
- 12.1.5.3.1 Product launches
- 12.1.5.3.2 Deals
- 12.1.5.4 MnM view
- 12.1.5.4.1 Key strengths/Right to win
- 12.1.5.4.2 Strategic choices
- 12.1.5.4.3 Weaknesses/Competitive threats
- 12.1.6 AIRISTA
- 12.1.6.1 Business overview
- 12.1.6.2 Products/Solutions/Services offered
- 12.1.6.3 Recent developments
- 12.1.6.3.1 Product launches
- 12.1.7 ALIEN TECHNOLOGY, LLC
- 12.1.7.1 Business overview
- 12.1.7.2 Products/Solutions/Services offered
- 12.1.8 GE HEALTHCARE
- 12.1.8.1 Business overview
- 12.1.8.2 Products/Solutions/Services offered
- 12.1.9 QUUPPA
- 12.1.9.1 Business overview
- 12.1.9.2 Products/Solutions/Services offered
- 12.1.9.3 Recent developments
- 12.1.9.3.1 Deals
- 12.1.10 QORVO, INC.
- 12.1.10.1 Business overview
- 12.1.10.2 Products/Solutions/Services offered
- 12.1.11 SONITOR TECHNOLOGIES
- 12.1.11.1 Business overview
- 12.1.11.2 Products/Solutions/Services offered
- 12.1.11.3 Recent developments
- 12.1.11.3.1 Product launches
- 12.1.11.3.2 Deals
- 12.1.12 TELETRACKING TECHNOLOGIES, INC.
- 12.1.12.1 Business overview
- 12.1.12.2 Products/Solutions/Services offered
- 12.1.12.3 Recent developments
- 12.1.12.3.1 Deals
- 12.1.13 UBISENSE
- 12.1.13.1 Business overview
- 12.1.13.2 Products/Solutions/Services offered
- 12.1.13.3 Recent developments
- 12.1.13.3.1 Product launches
- 12.1.13.3.2 Deals
- 12.1.1 SECURITAS AB
- 12.2 OTHER PLAYERS
- 12.2.1 BLUEIOT (BEIJING) TECHNOLOGY CO., LTD.
- 12.2.2 MIDMARK CORPORATION
- 12.2.3 LITUM
- 12.2.4 ELIKO
- 12.2.5 REDPOINT POSITIONING CORP.
- 12.2.6 LINK LABS
- 12.2.7 POZYX
- 12.2.8 SEWIO
- 12.2.9 TRACKTIO
- 12.2.10 VISIBLE ASSETS, INC.
- 12.2.11 BORDA TECHNOLOGY
- 12.2.12 MYSPHERA S.L.
- 12.2.13 SECURE CARE PRODUCTS, LLC
- 12.2.14 KONTAKT.IO
- 12.2.15 NAVIGINE
- 12.2.16 INPIXON
- 12.2.17 KINEXON
- 12.2.18 LEANTEGRA INC.
- 12.2.19 NANJING WOXU WIRELESS CO.,LTD
13 APPENDIX
- 13.1 INSIGHTS FROM INDUSTRY EXPERTS
- 13.2 DISCUSSION GUIDE
- 13.3 KNOWLEDGESTORE: MARKETSANDMARKETS' SUBSCRIPTION PORTAL
- 13.4 CUSTOMIZATION OPTIONS
- 13.5 RELATED REPORTS
- 13.6 AUTHOR DETAILS
List of Tables
- TABLE 1 RTLS MARKET: INCLUSIONS AND EXCLUSIONS
- TABLE 2 MAJOR SECONDARY SOURCES
- TABLE 3 PRIMARY INTERVIEW PARTICIPANTS
- TABLE 4 DATA CAPTURED FROM PRIMARY SOURCES
- TABLE 5 RTLS MARKET: RISK ANALYSIS
- TABLE 6 ROLE OF COMPANIES IN RTLS ECOSYSTEM
- TABLE 7 IMPORT DATA FOR HS CODE 853252-COMPLIANT PRODUCTS, BY COUNTRY, 2020-2024 (USD MILLION)
- TABLE 8 EXPORT DATA FOR HS CODE 853252-COMPLIANT PRODUCTS, BY COUNTRY, 2020-2024 (USD MILLION)
- TABLE 9 LIST OF KEY PATENTS, 2023-2025
- TABLE 10 LIST OF KEY CONFERENCES AND EVENTS, 2025-2026
- TABLE 11 NORTH AMERICA: LIST OF REGULATORY BODIES, GOVERNMENT AGENCIES, AND OTHER ORGANIZATIONS
- TABLE 12 EUROPE: LIST OF REGULATORY BODIES, GOVERNMENT AGENCIES, AND OTHER ORGANIZATIONS
- TABLE 13 ASIA PACIFIC: LIST OF REGULATORY BODIES, GOVERNMENT AGENCIES, AND OTHER ORGANIZATIONS
- TABLE 14 ROW: LIST OF REGULATORY BODIES, GOVERNMENT AGENCIES, AND OTHER ORGANIZATIONS
- TABLE 15 STANDARDS
- TABLE 16 IMPACT OF PORTER'S FIVE FORCES ANALYSIS
- TABLE 17 INFLUENCE OF STAKEHOLDERS ON BUYING PROCESS FOR TOP THREE VERTICALS (%)
- TABLE 18 KEY BUYING CRITERIA FOR TOP THREE VERTICALS
- TABLE 19 PRICING TREND OF RTLS TAGS/BADGES, 2021-2024 (USD)
- TABLE 20 PRICING RANGE OF RTLS TAGS/BADGES OFFERED BY KEY PLAYERS, 2024 (USD)
- TABLE 21 PRICING RANGE OF RTLS TAGS/BADGES, BY TECHNOLOGY, 2024 (USD)
- TABLE 22 AVERAGE SELLING PRICE TREND OF RTLS TAGS/BADGES, BY REGION, 2021-2024 (USD)
- TABLE 23 KEY COMPANIES IMPLEMENTING AI/GEN AI
- TABLE 24 US-ADJUSTED RECIPROCAL TARIFF RATES
- TABLE 25 RTLS MARKET, BY OFFERING, 2021-2024 (USD MILLION)
- TABLE 26 RTLS MARKET, BY OFFERING, 2025-2030 (USD MILLION)
- TABLE 27 HARDWARE: RTLS MARKET, BY TYPE, 2021-2024 (USD MILLION)
- TABLE 28 HARDWARE: RTLS MARKET, BY TYPE, 2025-2030 (USD MILLION)
- TABLE 29 HARDWARE: RTLS MARKET, BY TECHNOLOGY, 2021-2024 (USD MILLION)
- TABLE 30 HARDWARE: RTLS MARKET, BY TECHNOLOGY, 2025-2030 (USD MILLION)
- TABLE 31 TAGS/BADGES: RTLS MARKET, BY TECHNOLOGY, 2021-2024 (MILLION UNITS)
- TABLE 32 TAGS/BADGES: RTLS MARKET, BY TECHNOLOGY, 2025-2030 (MILLION UNITS)
- TABLE 33 SOFTWARE: RTLS MARKET, BY TECHNOLOGY, 2021-2024 (USD MILLION)
- TABLE 34 SOFTWARE: RTLS MARKET, BY TECHNOLOGY, 2025-2030 (USD MILLION)
- TABLE 35 SERVICES: RTLS MARKET, BY TYPE, 2021-2024 (USD MILLION)
- TABLE 36 SERVICES: RTLS MARKET, BY TYPE, 2025-2030 (USD MILLION)
- TABLE 37 SERVICES: RTLS MARKET, BY TECHNOLOGY, 2021-2024 (USD MILLION)
- TABLE 38 SERVICES: RTLS MARKET, BY TECHNOLOGY, 2025-2030 (USD MILLION)
- TABLE 39 RTLS MARKET, BY TECHNOLOGY, 2021-2024 (USD MILLION)
- TABLE 40 RTLS MARKET, BY TECHNOLOGY, 2025-2030 (USD MILLION)
- TABLE 41 RFID: RTLS MARKET, BY OFFERING, 2021-2024 (USD MILLION)
- TABLE 42 RFID: RTLS MARKET, BY OFFERING, 2025-2030 (USD MILLION)
- TABLE 43 RFID: RTLS MARKET, BY VERTICAL, 2021-2024 (USD MILLION)
- TABLE 44 RFID: RTLS MARKET, BY VERTICAL, 2025-2030 (USD MILLION)
- TABLE 45 RFID: RTLS MARKET, BY REGION, 2021-2024 (USD MILLION)
- TABLE 46 RFID: RTLS MARKET, BY REGION, 2025-2030 (USD MILLION)
- TABLE 47 WI-FI: RTLS MARKET, BY OFFERING, 2021-2024 (USD MILLION)
- TABLE 48 WI-FI: RTLS MARKET, BY OFFERING, 2025-2030 (USD MILLION)
- TABLE 49 WI-FI: RTLS MARKET, BY VERTICAL, 2021-2024 (USD MILLION)
- TABLE 50 WI-FI: RTLS MARKET, BY VERTICAL, 2025-2030 (USD MILLION)
- TABLE 51 WI-FI: RTLS MARKET, BY REGION, 2021-2024 (USD MILLION)
- TABLE 52 WI-FI: RTLS MARKET, BY REGION, 2025-2030 (USD MILLION)
- TABLE 53 UWB: RTLS MARKET, BY OFFERING, 2021-2024 (USD MILLION)
- TABLE 54 UWB: RTLS MARKET, BY OFFERING, 2025-2030 (USD MILLION)
- TABLE 55 UWB: RTLS MARKET, BY VERTICAL, 2021-2024 (USD MILLION)
- TABLE 56 UWB: RTLS MARKET, BY VERTICAL, 2025-2030 (USD MILLION)
- TABLE 57 UWB: RTLS MARKET, BY REGION, 2021-2024 (USD MILLION)
- TABLE 58 UWB: RTLS MARKET, BY REGION, 2025-2030 (USD MILLION)
- TABLE 59 BLE: RTLS MARKET, BY OFFERING, 2021-2024 (USD MILLION)
- TABLE 60 BLE: RTLS MARKET, BY OFFERING, 2025-2030 (USD MILLION)
- TABLE 61 BLE: RTLS MARKET, BY VERTICAL, 2021-2024 (USD MILLION)
- TABLE 62 BLE: RTLS MARKET, BY VERTICAL, 2025-2030 (USD MILLION)
- TABLE 63 BLE: RTLS MARKET, BY REGION, 2021-2024 (USD MILLION)
- TABLE 64 BLE: RTLS MARKET, BY REGION, 2025-2030 (USD MILLION)
- TABLE 65 ULTRASOUND: RTLS MARKET, BY OFFERING, 2021-2024 (USD MILLION)
- TABLE 66 ULTRASOUND: RTLS MARKET, BY OFFERING, 2025-2030 (USD MILLION)
- TABLE 67 ULTRASOUND: RTLS MARKET, BY VERTICAL, 2021-2024 (USD MILLION)
- TABLE 68 ULTRASOUND: RTLS MARKET, BY VERTICAL, 2025-2030 (USD MILLION)
- TABLE 69 ULTRASOUND: RTLS MARKET, BY REGION, 2021-2024 (USD MILLION)
- TABLE 70 ULTRASOUND: RTLS MARKET, BY REGION, 2025-2030 (USD MILLION)
- TABLE 71 INFRARED: RTLS MARKET, BY OFFERING, 2021-2024 (USD MILLION)
- TABLE 72 INFRARED: RTLS MARKET, BY OFFERING, 2025-2030 (USD MILLION)
- TABLE 73 INFRARED: RTLS MARKET, BY VERTICAL, 2021-2024 (USD MILLION)
- TABLE 74 INFRARED: RTLS MARKET, BY VERTICAL, 2025-2030 (USD MILLION)
- TABLE 75 INFRARED: RTLS MARKET, BY REGION, 2021-2024 (USD MILLION)
- TABLE 76 INFRARED: RTLS MARKET, BY REGION, 2025-2030 (USD MILLION)
- TABLE 77 OTHER TECHNOLOGIES: RTLS MARKET, BY OFFERING, 2021-2024 (USD MILLION)
- TABLE 78 OTHER TECHNOLOGIES: RTLS MARKET, BY OFFERING, 2025-2030 (USD MILLION)
- TABLE 79 OTHER TECHNOLOGIES: RTLS MARKET, BY VERTICAL, 2021-2024 (USD MILLION)
- TABLE 80 OTHER TECHNOLOGIES: RTLS MARKET, BY VERTICAL, 2025-2030 (USD MILLION)
- TABLE 81 OTHER TECHNOLOGIES: RTLS MARKET, BY REGION, 2021-2024 (USD MILLION)
- TABLE 82 OTHER TECHNOLOGIES: RTLS MARKET, BY REGION, 2025-2030 (USD MILLION)
- TABLE 83 RTLS MARKET, BY APPLICATION, 2021-2024 (USD MILLION)
- TABLE 84 RTLS MARKET, BY APPLICATION, 2025-2030 (USD MILLION)
- TABLE 85 INVENTORY/ASSET TRACKING & MANAGEMENT: RTLS MARKET, BY VERTICAL, 2021-2024 (USD MILLION)
- TABLE 86 INVENTORY/ASSET TRACKING & MANAGEMENT: RTLS MARKET, BY VERTICAL, 2025-2030 (USD MILLION)
- TABLE 87 PERSONNEL LOCATING & MONITORING: RTLS MARKET, BY VERTICAL, 2021-2024 (USD MILLION)
- TABLE 88 PERSONNEL LOCATING & MONITORING: RTLS MARKET, BY VERTICAL, 2025-2030 (USD MILLION)
- TABLE 89 ACCESS CONTROL & SECURITY: RTLS MARKET, BY VERTICAL, 2021-2024 (USD MILLION)
- TABLE 90 ACCESS CONTROL & SECURITY: RTLS MARKET, BY VERTICAL, 2025-2030 (USD MILLION)
- TABLE 91 ENVIRONMENTAL MONITORING: RTLS MARKET, BY VERTICAL, 2021-2024 (USD MILLION)
- TABLE 92 ENVIRONMENTAL MONITORING: RTLS MARKET, BY VERTICAL, 2025-2030 (USD MILLION)
- TABLE 93 YARD, DOCK, FLEET & WAREHOUSE MANAGEMENT & MONITORING: RTLS MARKET, BY VERTICAL, 2021-2024 (USD MILLION)
- TABLE 94 YARD, DOCK, FLEET & WAREHOUSE MANAGEMENT & MONITORING: RTLS MARKET, BY VERTICAL, 2025-2030 (USD MILLION)
- TABLE 95 SUPPLY CHAIN MANAGEMENT & AUTOMATION: RTLS MARKET, BY VERTICAL, 2021-2024 (USD MILLION)
- TABLE 96 SUPPLY CHAIN MANAGEMENT & AUTOMATION: RTLS MARKET, BY VERTICAL, 2025-2030 (USD MILLION)
- TABLE 97 OTHER APPLICATIONS: RTLS MARKET, BY VERTICAL, 2021-2024 (USD MILLION)
- TABLE 98 OTHER APPLICATIONS: RTLS MARKET, BY VERTICAL, 2025-2030 (USD MILLION)
- TABLE 99 RTLS MARKET, BY VERTICAL, 2021-2024 (USD MILLION)
- TABLE 100 RTLS MARKET, BY VERTICAL, 2025-2030 (USD MILLION)
- TABLE 101 HEALTHCARE: RTLS MARKET, BY APPLICATION, 2021-2024 (USD MILLION)
- TABLE 102 HEALTHCARE: RTLS MARKET, BY APPLICATION, 2025-2030 (USD MILLION)
- TABLE 103 HEALTHCARE: RTLS MARKET, BY REGION, 2021-2024 (USD MILLION)
- TABLE 104 HEALTHCARE: RTLS MARKET, BY REGION, 2025-2030 (USD MILLION)
- TABLE 105 MANUFACTURING & AUTOMOTIVE: RTLS MARKET, BY APPLICATION, 2021-2024 (USD MILLION)
- TABLE 106 MANUFACTURING & AUTOMOTIVE: RTLS MARKET, BY APPLICATION, 2025-2030 (USD MILLION)
- TABLE 107 MANUFACTURING & AUTOMOTIVE: RTLS MARKET, BY REGION, 2021-2024 (USD MILLION)
- TABLE 108 MANUFACTURING & AUTOMOTIVE: RTLS MARKET, BY REGION, 2025-2030 (USD MILLION)
- TABLE 109 RETAIL: RTLS MARKET, BY APPLICATION, 2021-2024 (USD MILLION)
- TABLE 110 RETAIL: RTLS MARKET, BY APPLICATION, 2025-2030 (USD MILLION)
- TABLE 111 RETAIL: RTLS MARKET, BY REGION, 2021-2024 (USD MILLION)
- TABLE 112 RETAIL: RTLS MARKET, BY REGION, 2025-2030 (USD MILLION)
- TABLE 113 TRANSPORTATION & LOGISTICS: RTLS MARKET, BY APPLICATION, 2021-2024 (USD MILLION)
- TABLE 114 TRANSPORTATION & LOGISTICS: RTLS MARKET, BY APPLICATION, 2025-2030 (USD MILLION)
- TABLE 115 TRANSPORTATION & LOGISTICS: RTLS MARKET, BY REGION, 2021-2024 (USD MILLION)
- TABLE 116 TRANSPORTATION & LOGISTICS: RTLS MARKET, BY REGION, 2025-2030 (USD MILLION)
- TABLE 117 GOVERNMENT: RTLS MARKET, BY APPLICATION, 2021-2024 (USD MILLION)
- TABLE 118 GOVERNMENT: RTLS MARKET, BY APPLICATION, 2025-2030 (USD MILLION)
- TABLE 119 GOVERNMENT: RTLS MARKET, BY REGION, 2021-2024 (USD MILLION)
- TABLE 120 GOVERNMENT: RTLS MARKET, BY REGION, 2025-2030 (USD MILLION)
- TABLE 121 EDUCATION: RTLS MARKET, BY APPLICATION, 2021-2024 (USD MILLION)
- TABLE 122 EDUCATION: RTLS MARKET, BY APPLICATION, 2025-2030 (USD MILLION)
- TABLE 123 EDUCATION: RTLS MARKET, BY REGION, 2021-2024 (USD MILLION)
- TABLE 124 EDUCATION: RTLS MARKET, BY REGION, 2025-2030 (USD MILLION)
- TABLE 125 OIL & GAS AND MINING: RTLS MARKET, BY APPLICATION, 2021-2024 (USD MILLION)
- TABLE 126 OIL & GAS AND MINING: RTLS MARKET, BY APPLICATION, 2025-2030 (USD MILLION)
- TABLE 127 OIL & GAS AND MINING: RTLS MARKET, BY REGION, 2021-2024 (USD MILLION)
- TABLE 128 OIL & GAS AND MINING: RTLS MARKET, BY REGION, 2025-2030 (USD MILLION)
- TABLE 129 SPORTS & ENTERTAINMENT: RTLS MARKET, BY APPLICATION, 2021-2024 (USD MILLION)
- TABLE 130 SPORTS & ENTERTAINMENT: RTLS MARKET, BY APPLICATION, 2025-2030 (USD MILLION)
- TABLE 131 SPORTS & ENTERTAINMENT: RTLS MARKET, BY REGION, 2021-2024 (USD MILLION)
- TABLE 132 SPORTS & ENTERTAINMENT: RTLS MARKET, BY REGION, 2025-2030 (USD MILLION)
- TABLE 133 OTHER VERTICALS: RTLS MARKET, BY APPLICATION, 2021-2024 (USD MILLION)
- TABLE 134 OTHER VERTICALS: RTLS MARKET, BY APPLICATION, 2025-2030 (USD MILLION)
- TABLE 135 OTHER VERTICALS: RTLS MARKET, BY REGION, 2021-2024 (USD MILLION)
- TABLE 136 OTHER VERTICALS: RTLS MARKET, BY REGION, 2025-2030 (USD MILLION)
- TABLE 137 RTLS MARKET, BY REGION, 2021-2024 (USD MILLION)
- TABLE 138 RTLS MARKET, BY REGION, 2025-2030 (USD MILLION)
- TABLE 139 NORTH AMERICA: RTLS MARKET, BY COUNTRY, 2021-2024 (USD MILLION)
- TABLE 140 NORTH AMERICA: RTLS MARKET, BY COUNTRY, 2025-2030 (USD MILLION)
- TABLE 141 NORTH AMERICA: RTLS MARKET, BY TECHNOLOGY, 2021-2024 (USD MILLION)
- TABLE 142 NORTH AMERICA: RTLS MARKET, BY TECHNOLOGY, 2025-2030 (USD MILLION)
- TABLE 143 NORTH AMERICA: RTLS MARKET, BY VERTICAL, 2021-2024 (USD MILLION)
- TABLE 144 NORTH AMERICA: RTLS MARKET, BY VERTICAL, 2025-2030 (USD MILLION)
- TABLE 145 EUROPE: RTLS MARKET, BY COUNTRY, 2021-2024 (USD MILLION)
- TABLE 146 EUROPE: RTLS MARKET, BY COUNTRY, 2025-2030 (USD MILLION)
- TABLE 147 EUROPE: RTLS MARKET, BY TECHNOLOGY, 2021-2024 (USD MILLION)
- TABLE 148 EUROPE: RTLS MARKET, BY TECHNOLOGY, 2025-2030 (USD MILLION)
- TABLE 149 EUROPE: RTLS MARKET, BY VERTICAL, 2021-2024 (USD MILLION)
- TABLE 150 EUROPE: RTLS MARKET, BY VERTICAL, 2025-2030 (USD MILLION)
- TABLE 151 ASIA PACIFIC: RTLS MARKET, BY COUNTRY, 2021-2024 (USD MILLION)
- TABLE 152 ASIA PACIFIC: RTLS MARKET, BY COUNTRY, 2025-2030 (USD MILLION)
- TABLE 153 ASIA PACIFIC: RTLS MARKET, BY TECHNOLOGY, 2021-2024 (USD MILLION)
- TABLE 154 ASIA PACIFIC: RTLS MARKET, BY TECHNOLOGY, 2025-2030 (USD MILLION)
- TABLE 155 ASIA PACIFIC: RTLS MARKET, BY VERTICAL, 2021-2024 (USD MILLION)
- TABLE 156 ASIA PACIFIC: RTLS MARKET, BY VERTICAL, 2025-2030 (USD MILLION)
- TABLE 157 ROW: RTLS MARKET, BY REGION, 2021-2024 (USD MILLION)
- TABLE 158 ROW: RTLS MARKET, BY REGION, 2025-2030 (USD MILLION)
- TABLE 159 ROW: RTLS MARKET, BY TECHNOLOGY, 2021-2024 (USD MILLION)
- TABLE 160 ROW: RTLS MARKET, BY TECHNOLOGY, 2025-2030 (USD MILLION)
- TABLE 161 ROW: RTLS MARKET, BY VERTICAL, 2021-2024 (USD MILLION)
- TABLE 162 ROW: RTLS MARKET, BY VERTICAL, 2025-2030 (USD MILLION)
- TABLE 163 MIDDLE EAST: RTLS MARKET, BY COUNTRY, 2021-2024 (USD MILLION)
- TABLE 164 MIDDLE EAST: RTLS MARKET, BY COUNTRY, 2025-2030 (USD MILLION)
- TABLE 165 RTLS MARKET: OVERVIEW OF STRATEGIES ADOPTED BY KEY PLAYERS, JUNE 2021-JULY 2025
- TABLE 166 RTLS MARKET: DEGREE OF COMPETITION, 2024
- TABLE 167 RTLS MARKET: REGION FOOTPRINT
- TABLE 168 RTLS MARKET: OFFERING FOOTPRINT
- TABLE 169 RTLS MARKET: VERTICAL FOOTPRINT
- TABLE 170 RTLS MARKET: TECHNOLOGY FOOTPRINT
- TABLE 171 RTLS MARKET: DETAILED LIST OF KEY STARTUPS/SMES
- TABLE 172 RTLS MARKET: COMPETITIVE BENCHMARKING OF KEY STARTUPS/SMES
- TABLE 173 RTLS MARKET: PRODUCT LAUNCHES, JUNE 2021-JULY 2025
- TABLE 174 RTLS MARKET: DEALS, JUNE 2021-JULY 2025
- TABLE 175 SECURITAS AB: COMPANY OVERVIEW
- TABLE 176 SECURITAS AB: PRODUCTS/SOLUTIONS/SERVICES OFFERED
- TABLE 177 SECURITAS AB: DEALS
- TABLE 178 ZEBRA TECHNOLOGIES CORP.: COMPANY OVERVIEW
- TABLE 179 ZEBRA TECHNOLOGIES CORP.: PRODUCTS/SOLUTIONS/SERVICES OFFERED
- TABLE 180 ZEBRA TECHNOLOGIES CORP.: DEALS
- TABLE 181 IMPINJ, INC.: COMPANY OVERVIEW
- TABLE 182 IMPINJ, INC.: PRODUCTS/SOLUTIONS/SERVICES OFFERED
- TABLE 183 IMPINJ, INC.: PRODUCT LAUNCHES
- TABLE 184 SIEMENS: COMPANY OVERVIEW
- TABLE 185 SIEMENS: PRODUCTS/SOLUTIONS/SERVICES OFFERED
- TABLE 186 CENTRAK, INC.: COMPANY OVERVIEW
- TABLE 187 CENTRAK, INC.: PRODUCTS/SOLUTIONS/SERVICES OFFERED
- TABLE 188 CENTRAK, INC.: PRODUCT LAUNCHES
- TABLE 189 CENTRAK, INC.: DEALS
- TABLE 190 AIRISTA: COMPANY OVERVIEW
- TABLE 191 AIRISTA: PRODUCTS/SOLUTIONS/SERVICES OFFERED
- TABLE 192 AIRISTA: PRODUCT LAUNCHES
- TABLE 193 ALIEN TECHNOLOGY, LLC: COMPANY OVERVIEW
- TABLE 194 ALIEN TECHNOLOGY, LLC: PRODUCTS/SOLUTIONS/SERVICES OFFERED
- TABLE 195 GE HEALTHCARE: COMPANY OVERVIEW
- TABLE 196 GE HEALTHCARE: PRODUCTS/SOLUTIONS/SERVICES OFFERED
- TABLE 197 QUUPPA: COMPANY OVERVIEW
- TABLE 198 QUUPPA: PRODUCTS/SOLUTIONS/SERVICES OFFERED
- TABLE 199 QUUPPA: DEALS
- TABLE 200 QORVO, INC.: COMPANY OVERVIEW
- TABLE 201 QORVO, INC.: PRODUCTS/SOLUTIONS/SERVICES OFFERED
- TABLE 202 SONITOR TECHNOLOGIES: COMPANY OVERVIEW
- TABLE 203 SONITOR TECHNOLOGIES: PRODUCTS/SOLUTIONS/SERVICES OFFERED
- TABLE 204 SONITOR TECHNOLOGIES: PRODUCT LAUNCHES
- TABLE 205 SONITOR TECHNOLOGIES: DEALS
- TABLE 206 TELETRACKING TECHNOLOGIES, INC.: COMPANY OVERVIEW
- TABLE 207 TELETRACKING TECHNOLOGIES, INC.: PRODUCTS/SOLUTIONS/SERVICES OFFERED
- TABLE 208 TELETRACKING TECHNOLOGIES, INC.: PRODUCT LAUNCHES
- TABLE 209 TELETRACKING TECHNOLOGIES, INC.: DEALS
- TABLE 210 UBISENSE: COMPANY OVERVIEW
- TABLE 211 UBISENSE: PRODUCTS/SOLUTIONS/SERVICES OFFERED
- TABLE 212 UBISENSE: PRODUCT LAUNCHES
- TABLE 213 UBISENSE: DEALS
List of Figures
- FIGURE 1 RTLS MARKET SEGMENTATION AND REGIONAL SCOPE
- FIGURE 2 RTLS MARKET: DURATION CONSIDERED
- FIGURE 3 RTLS MARKET: RESEARCH DESIGN
- FIGURE 4 RTLS MARKET: RESEARCH APPROACH
- FIGURE 5 DATA CAPTURED FROM SECONDARY SOURCES
- FIGURE 6 CORE FINDINGS FROM INDUSTRY EXPERTS
- FIGURE 7 BREAKDOWN OF PRIMARY INTERVIEWS, BY COMPANY TYPE, DESIGNATION, AND REGION
- FIGURE 8 RTLS MARKET: TOP-DOWN APPROACH
- FIGURE 9 RTLS MARKET: BOTTOM-UP APPROACH
- FIGURE 10 RTLS MARKET SIZE ESTIMATION METHODOLOGY
- FIGURE 11 RTLS MARKET: DATA TRIANGULATION
- FIGURE 12 RTLS MARKET: RESEARCH ASSUMPTIONS
- FIGURE 13 RTLS MARKET SIZE, 2021-2030
- FIGURE 14 SERVICES SEGMENT TO RECORD HIGHEST CAGR DURING FORECAST PERIOD
- FIGURE 15 WI-FI SEGMENT TO DOMINATE RTLS MARKET BETWEEN 2025 AND 2030
- FIGURE 16 HEALTHCARE SEGMENT TO HOLD LARGEST MARKET SHARE IN 2030
- FIGURE 17 NORTH AMERICA ACCOUNTED FOR LARGEST SHARE OF RTLS MARKET IN 2024
- FIGURE 18 INCREASING NEED TO ENSURE SAFETY AND SECURITY COMPLIANCE TO BOOST RTLS MARKET BETWEEN 2025 AND 2030
- FIGURE 19 WI-FI SEGMENT TO DOMINATE RTLS MARKET FROM 2025 TO 2030
- FIGURE 20 INVENTORY/ASSET TRACKING & MANAGEMENT SEGMENT TO CAPTURE LARGEST MARKET SHARE IN 2030
- FIGURE 21 HEALTHCARE AND US TO HOLD LARGEST SHARES OF NORTH AMERICAN RTLS MARKET IN 2030
- FIGURE 22 CHINA TO RECORD HIGHEST CAGR IN GLOBAL RTLS MARKET FROM 2025 TO 2030
- FIGURE 23 DRIVERS, RESTRAINTS, OPPORTUNITIES, AND CHALLENGES
- FIGURE 24 IMPACT ANALYSIS: DRIVERS
- FIGURE 25 IMPACT ANALYSIS: RESTRAINTS
- FIGURE 26 IMPACT ANALYSIS: OPPORTUNITIES
- FIGURE 27 IMPACT ANALYSIS: CHALLENGES
- FIGURE 28 TRENDS/DISRUPTIONS IMPACTING CUSTOMER BUSINESS
- FIGURE 29 VALUE CHAIN ANALYSIS
- FIGURE 30 RTLS ECOSYSTEM
- FIGURE 31 INVESTMENT AND FUNDING SCENARIO, 2020-2024
- FIGURE 32 IMPORT DATA FOR HS CODE 852352-COMPLIANT PRODUCTS FOR TOP FIVE COUNTRIES, 2020-2024
- FIGURE 33 EXPORT DATA FOR HS CODE 852352-COMPLIANT PRODUCTS FOR TOP FIVE COUNTRIES, 2020-2024
- FIGURE 34 PATENTS APPLIED AND GRANTED, 2015-2024
- FIGURE 35 PORTER'S FIVE FORCES ANALYSIS
- FIGURE 36 INFLUENCE OF STAKEHOLDERS ON BUYING PROCESS FOR TOP THREE VERTICALS
- FIGURE 37 KEY BUYING CRITERIA FOR TOP THREE VERTICALS
- FIGURE 38 PRICING TREND OF RTLS TAGS/BADGES, 2021-2024
- FIGURE 39 PRICING RANGE OF RTLS TAGS/BADGES OFFERED BY KEY PLAYERS, 2024
- FIGURE 40 AVERAGE SELLING PRICE TREND OF RTLS TAGS/BADGES, BY REGION, 2021-2024
- FIGURE 41 AI/GEN AI IN RTLS MARKET
- FIGURE 42 RTLS MARKET, BY OFFERING
- FIGURE 43 SERVICES SEGMENT TO REGISTER HIGHEST CAGR DURING FORECAST PERIOD
- FIGURE 44 RTLS MARKET, BY TECHNOLOGY
- FIGURE 45 WI-FI SEGMENT TO HOLD LARGEST MARKET SHARE IN 2030
- FIGURE 46 RTLS MARKET, BY APPLICATION
- FIGURE 47 INVENTORY/ASSET TRACKING & MANAGEMENT SEGMENT TO HOLD LARGEST MARKET SHARE IN 2030
- FIGURE 48 RTLS MARKET, BY VERTICAL
- FIGURE 49 HEALTHCARE VERTICAL TO CAPTURE LARGEST SHARE OF RTLS MARKET IN 2030
- FIGURE 50 RTLS MARKET, BY REGION
- FIGURE 51 CHINA TO EXHIBIT HIGHEST CAGR IN GLOBAL RTLS MARKET DURING FORECAST PERIOD
- FIGURE 52 NORTH AMERICA: RTLS MARKET SNAPSHOT
- FIGURE 53 US TO ACCOUNT FOR LARGEST SHARE OF NORTH AMERICAN RTLS MARKET IN 2025
- FIGURE 54 EUROPE: RTLS MARKET SNAPSHOT
- FIGURE 55 GERMANY TO REGISTER HIGHEST CAGR IN EUROPEAN RTLS MARKET DURING FORECAST PERIOD
- FIGURE 56 ASIA PACIFIC: RTLS MARKET SNAPSHOT
- FIGURE 57 CHINA TO RECORD HIGHEST CAGR DURING FORECAST PERIOD
- FIGURE 58 SOUTH AMERICA TO RECORD HIGHEST CAGR IN ROW RTLS MARKET DURING FORECAST PERIOD
- FIGURE 59 RTLS MARKET: REVENUE ANALYSIS OF FIVE KEY PLAYERS, 2020-2024
- FIGURE 60 MARKET SHARE ANALYSIS OF COMPANIES OFFERING REAL-TIME LOCATION SYSTEMS, 2024
- FIGURE 61 COMPANY VALUATION
- FIGURE 62 FINANCIAL METRICS (EV/EBITDA)
- FIGURE 63 BRAND/PRODUCT COMPARISON
- FIGURE 64 RTLS MARKET: COMPANY EVALUATION MATRIX (KEY PLAYERS), 2024
- FIGURE 65 RTLS MARKET: COMPANY FOOTPRINT
- FIGURE 66 RTLS MARKET: COMPANY EVALUATION MATRIX (STARTUPS/SMES), 2024
- FIGURE 67 SECURITAS AB: COMPANY SNAPSHOT
- FIGURE 68 ZEBRA TECHNOLOGIES CORP.: COMPANY SNAPSHOT
- FIGURE 69 IMPINJ, INC.: COMPANY SNAPSHOT
- FIGURE 70 SIEMENS: COMPANY SNAPSHOT
- FIGURE 71 GE HEALTHCARE: COMPANY SNAPSHOT
- FIGURE 72 QORVO, INC.: COMPANY SNAPSHOT

