
PUBLISHER: MarketsandMarkets | PRODUCT CODE: 1811763

PUBLISHER: MarketsandMarkets | PRODUCT CODE: 1811763
Printed Electronics Market by Printing Technology (Screen, Inkjet, Flexographic, Gravure Printing), Material (Inks, Substrates), Resolution (Below 100 Lines/CM, 100-200 Lines/CM, Above 200 Lines/CM) and Geography - Global Forecast to 2030
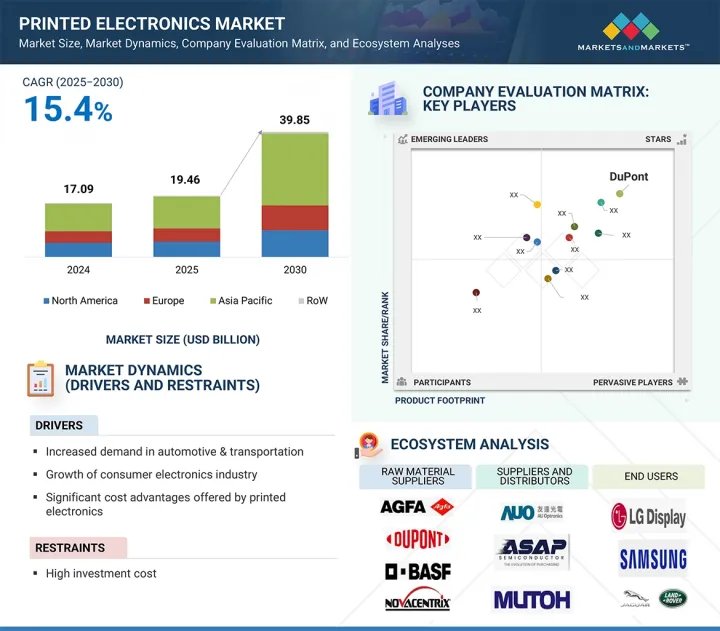
The global printed electronics market is expected to grow from USD 19.46 billion in 2025 to USD 39.85 billion by 2030, at a compound annual growth rate (CAGR) of 15.4% during the forecast period. Due to the rising preference for flexible, lightweight, and cost-efficient electronic components across industries. Printed electronics enable innovative applications such as flexible displays, wearable devices, smart packaging, and advanced sensors that traditional rigid electronics cannot support. Their ability to reduce material usage, lower production costs, and allow large-scale customization makes them highly attractive for manufacturers.
| Scope of the Report | |
|---|---|
| Years Considered for the Study | 2021-2030 |
| Base Year | 2024 |
| Forecast Period | 2025-2030 |
| Units Considered | Value (USD Billion) |
| Segments | By Printing Technology, Material, Resolution, Application, End-Use Industry, and Region |
| Regions covered | North America, Europe, APAC, RoW |
The rapid growth of the Internet of Things (IoT), electric vehicles, and consumer electronics is further amplifying their adoption. Additionally, advancements in printing technologies are enhancing performance and durability, making printed electronics a mainstream choice. This trend is expected to significantly boost market growth during the forecast period.
"Lighting application to register highest CAGR in printed electronics market during forecast period"
The lighting application segment is expected to grow at the highest CAGR in the printed electronics market during the forecast period. This growth is primarily driven by the increasing adoption of OLED lighting solutions in automotive, consumer electronics, and architectural applications. Printed lighting offers advantages such as flexibility, lightweight design, energy efficiency, and enhanced design freedom, making it ideal for modern, sustainable applications. The demand for innovative lighting in smart homes, wearable devices, and next-generation vehicles is further fueling this trend. Additionally, declining costs of materials and advancements in printing techniques are boosting large-scale deployment of printed lighting solutions, positioning this segment as a major growth driver in the market.
"Inkjet printing technology to grow at highest CAGR in printed electronics market during forecast period"
The growth of the inkjet printing technology is attributed to its high precision, material efficiency, and ability to print complex patterns without requiring masks or plates. Inkjet printing is widely used for prototyping and small-to-medium production runs, making it suitable for applications in flexible displays, sensors, RFID tags, and medical devices. Its compatibility with a wide range of substrates and conductive inks further enhances its adoption. Moreover, the increasing demand for cost-effective and customizable printing methods in consumer electronics, automotive, and healthcare industries is driving the rapid growth of this segment. Continuous advancements in ink formulations and printhead technologies are expected to further accelerate inkjet printing adoption in the printed electronics market.
"China to account for largest share of Asia Pacific printed electronics market by 2030"
China is expected to hold the largest share in the Asia Pacific printed electronics market during the forecast period. This dominance is driven by its strong electronics manufacturing base, large consumer demand, and extensive adoption of advanced technologies across industries. The country is a global hub for consumer electronics, automotive, and semiconductor production, which are key end users of printed electronics. Additionally, government initiatives supporting digitalization, renewable energy, and electric vehicle adoption are further boosting the demand. China also benefits from significant investments in R&D and local production capabilities, reducing reliance on imports. With its vast industrial ecosystem and expanding applications in IoT and smart devices, China is set to remain the leading market in the region.
Extensive primary interviews were conducted with key industry experts in the printed electronics market space to determine and verify the market size for various segments and subsegments gathered through secondary research. The breakup of primary participants for the report is shown below:
The study contains insights from various industry experts, from component suppliers to Tier 1 companies and OEMs. The breakup of the primaries is as follows:
- By Company Type: Tier 1 - 20%, Tier 2 - 55%, and Tier 3 - 25%
- By Designation: C-level Executives - 50%, Directors - 25%, and Others - 25%
- By Region: North America - 60%, Europe - 20%, Asia Pacific - 10%, and RoW - 10%
Notes: RoW includes the Middle East, Africa, and South America. Other designations include sales & marketing executives and researchers. The three tiers of the companies are defined based on their total revenue as of 2024; Tier 1: revenue more than or equal to USD 500 million, Tier 2: revenue between USD 100 million and USD 500 million, and Tier 3: revenue less than or equal to USD 100 million.
DuPont (US), BASF (Germany), Agfa-Gevaert Group (Belgium), Henkel AG & Co. KGaA (Germany), NovaCentrix (US), SAMSUNG (South Korea), LG DISPLAY CO., LTD. (South Korea), Molex (US), Nissha Co., Ltd (Japan), and E INK HOLDINGS INC. (Taiwan) are some key players in the printed electronics market.
The study includes an in-depth competitive analysis of these key players in the printed electronics market, with their company profiles, recent developments, and key market strategies.
Study Coverage:
This research report categorizes the printed electronics market based on printing technology (Inkjet printing, screen printing, flexographic printing, gravure printing, and others), material (Ink, substrate), resolution (below 100 lines/CM, 100 to 200 lines/CM, above 200 lines/CM), application (displays, RFID tags, batteries, photovoltaic cells, sensors, lighting, and other applications), End use industry (automotive & transportation, healthcare, consumer electronics, aerospace & defense, construction & architecture, retail & packaging, and other end use industries), and region (North America, Europe, Asia Pacific and RoW). The report describes the major drivers, restraints, challenges, and opportunities pertaining to the printed electronics market and forecasts the same till 2030. The report also consists of leadership mapping and analysis of all the companies included in the printed electronics ecosystem.
Key Benefits of Buying the Report
The report will help the market leaders/new entrants in this market by providing information on the closest approximations of the revenue numbers for the overall printed electronics market and the subsegments. This report will help stakeholders understand the competitive landscape and gain more insights to position their businesses better and plan suitable go-to-market strategies. The report also helps stakeholders understand the market pulse and provides information on key market drivers, restraints, challenges, and opportunities.
The report provides insights on the following pointers:
- Analysis of key drivers (Increased demand for printed electronic products in automotive & transportation, Growth of consumer electronics industry, Increased adoption of IoT by end-use industries, and Significant cost advantages offered by printed electronics) restraints (high investment cost), opportunities (Promising newer applications of printed electronics in healthcare, and smart packaging to create lucrative growth opportunities for printed electronics)and challenges (Inadequate knowledge of appropriate material and design selection for smart building applications) influencing the growth of the printed electronics market
- Product Development/Innovation: Detailed insights into upcoming technologies, research and development activities, and the latest product and service launches in the printed electronics market
- Market Development: Comprehensive information about lucrative markets - the report analyzes the printed electronics market across varied regions.
- Market Diversification: Exhaustive information about new products and services, untapped geographies, recent developments, and investments in the printed electronics market
- Competitive Assessment: In-depth assessment of market shares, growth strategies, and service offerings of leading players, such as DuPont (US), BASF (Germany), Agfa-Gevaert Group (Belgium), Henkel AG & Co. KGaA (Germany), and NovaCentrix (US) in the printed electronics market
TABLE OF CONTENTS
1 INTRODUCTION
- 1.1 STUDY OBJECTIVES
- 1.2 MARKET DEFINITION
- 1.2.1 INCLUSIONS AND EXCLUSIONS
- 1.3 STUDY SCOPE
- 1.3.1 MARKETS COVERED
- 1.3.2 REGIONAL SCOPE
- 1.3.3 YEARS CONSIDERED
- 1.4 CURRENCY
- 1.5 STAKEHOLDERS
- 1.6 SUMMARY OF CHANGES
2 RESEARCH METHODOLOGY
- 2.1 RESEARCH DATA
- 2.1.1 SECONDARY DATA
- 2.1.1.1 List of key secondary sources
- 2.1.1.2 Secondary sources
- 2.1.2 PRIMARY DATA
- 2.1.2.1 Breakdown of primaries
- 2.1.2.2 Key data from primary sources
- 2.1.2.3 Key industry insights
- 2.1.1 SECONDARY DATA
- 2.2 FACTOR ANALYSIS
- 2.3 MARKET SIZE ESTIMATION
- 2.3.1 BOTTOM-UP APPROACH
- 2.3.1.1 Approach for obtaining market share using bottom-up analysis (demand side)
- 2.3.2 TOP-DOWN APPROACH
- 2.3.2.1 Approach for obtaining market share using top-down analysis (supply side)
- 2.3.1 BOTTOM-UP APPROACH
- 2.4 MARKET BREAKDOWN AND DATA TRIANGULATION
- 2.5 RESEARCH ASSUMPTIONS AND LIMITATIONS
- 2.5.1 ASSUMPTIONS
- 2.5.2 LIMITATIONS
3 EXECUTIVE SUMMARY
4 PREMIUM INSIGHTS
- 4.1 ATTRACTIVE OPPORTUNITIES FOR PLAYERS IN PRINTED ELECTRONICS MARKET
- 4.2 PRINTED ELECTRONICS MARKET, BY REGION AND APPLICATION
- 4.3 PRINTED ELECTRONICS MARKET, BY END-USE INDUSTRY
- 4.4 PRINTED ELECTRONICS MARKET, BY MATERIAL
- 4.5 PRINTED ELECTRONICS MARKET, BY TECHNOLOGY
- 4.6 PRINTED ELECTRONICS MARKET, BY COUNTRY
5 MARKET OVERVIEW
- 5.1 INTRODUCTION
- 5.2 MARKET DYNAMICS
- 5.2.1 DRIVERS
- 5.2.1.1 Increased demand in automotive & transportation
- 5.2.1.2 Growth of consumer electronics industry
- 5.2.1.3 Increased adoption of IoT in various end-use industries
- 5.2.1.4 Significant cost advantages offered by printed electronics
- 5.2.2 RESTRAINTS
- 5.2.2.1 High investment cost
- 5.2.3 OPPORTUNITIES
- 5.2.3.1 Potential applications in healthcare sector
- 5.2.3.2 Increasing adoption of smart packaging
- 5.2.3.3 Use of printed electronics to reduce electromagnetic interference associated with 5G technology
- 5.2.4 CHALLENGES
- 5.2.4.1 Inadequate knowledge of appropriate material and design selection for smart building applications
- 5.2.1 DRIVERS
- 5.3 SUPPLY CHAIN ANALYSIS
- 5.4 TRENDS/DISRUPTIONS IMPACTING CUSTOMER BUSINESS
- 5.5 ECOSYSTEM ANALYSIS
- 5.6 PRICING ANALYSIS
- 5.6.1 AVERAGE SELLING PRICE ANALYSIS, BY MATERIAL
- 5.6.2 AVERAGE SELLING PRICE (ASP) TREND OF MATERIALS (INK), BY REGION
- 5.7 TECHNOLOGY ANALYSIS
- 5.7.1 KEY TECHNOLOGIES
- 5.7.1.1 Nanomaterials and inks
- 5.7.2 ADJACENT TECHNOLOGIES
- 5.7.2.1 Soft lithography
- 5.7.3 COMPLEMENTARY TECHNOLOGIES
- 5.7.3.1 Active-matrix organic light-emitting diodes (AMOLED)
- 5.7.1 KEY TECHNOLOGIES
- 5.8 PATENT ANALYSIS
- 5.9 TRADE ANALYSIS
- 5.9.1 IMPORT SCENARIO (HS CODE 853400)
- 5.9.2 EXPORT SCENARIO (HS CODE 853400)
- 5.10 KEY CONFERENCES AND EVENTS, 2025-2026
- 5.11 CASE STUDY
- 5.11.1 HUSHBRUSH APPROACHED CENTRE FOR PROCESS INNOVATION LIMITED (CPI) TO MANUFACTURE SENSORY BRUSH THAT SUPPORTS EARLY DEVELOPMENT AND CHILD WELLBEING
- 5.11.2 US DEPARTMENT OF ENERGY'S ADVANCED RESEARCH PROJECTS AGENCY-ENERGY (ARPA-E) PARTNERED WITH PARC TO DEVELOP LOW-COST SYSTEM FOR DETECTING METHANE LEAKS AT NATURAL GAS WELLS
- 5.11.3 CARBON NANOTUBE (CNT) HYBRID MATERIALS FROM CHASM ADVANCED MATERIALS, INC. HELP REDUCE LEAD TIMES AND MANUFACTURING COST
- 5.11.4 NOVARES COLLABORATED WITH FLEXENABLE TO INTEGRATE CURVED DISPLAYS IN ITS DEMO CAR
- 5.12 TARIFF AND REGULATORY LANDSCAPE
- 5.12.1 TARIFFS
- 5.12.2 REGULATORY COMPLIANCE
- 5.12.3 STANDARDS
- 5.12.4 PRINTED ELECTRONICS ASSOCIATIONS
- 5.13 PORTER FIVE FORCES ANALYSIS
- 5.13.1 INTENSITY OF COMPETITIVE RIVALRY
- 5.13.2 BARGAINING POWER OF SUPPLIERS
- 5.13.3 BARGAINING POWER OF BUYERS
- 5.13.4 THREAT OF SUBSTITUTES
- 5.13.5 THREAT OF NEW ENTRANTS
- 5.14 IMPACT OF AI/GEN AI ON PRINTED ELECTRONICS MARKET
- 5.14.1 INTRODUCTION
- 5.15 IMPACT OF 2025 US TARIFF ON PRINTED ELECTRONICS MARKET
- 5.15.1 INTRODUCTION
- 5.15.2 KEY TARIFF RATES
- 5.15.3 PRICE IMPACT ANALYSIS
- 5.15.4 IMPACT ON COUNTRIES/REGIONS
- 5.15.4.1 US
- 5.15.4.2 Europe
- 5.15.4.3 Asia Pacific
- 5.15.5 IMPACT ON APPLICATIONS
6 DIFFERENT SUBSTRATE TRANSPORT TECHNIQUES IN PRINTED ELECTRONICS
- 6.1 INTRODUCTION
- 6.2 ROLL-TO-ROLL
- 6.3 SHEET-TO-SHEET
- 6.4 SHEETS-ON-SHUTTLE
7 PRINTED ELECTRONICS MARKET, BY TECHNOLOGY
- 7.1 INTRODUCTION
- 7.2 SCREEN PRINTING
- 7.2.1 FLATBED SCREEN PRINTING
- 7.2.1.1 Application in development of products that require precise thickness of ink to drive market
- 7.2.2 ROTARY SCREEN PRINTING
- 7.2.2.1 Demand for high-durability printing technology to fuel market growth
- 7.2.1 FLATBED SCREEN PRINTING
- 7.3 INKJET PRINTING
- 7.3.1 CONTINUOUS INKJET PRINTING
- 7.3.1.1 Offers traceability data and complies with increasingly strict industry legislation
- 7.3.2 DROP-ON-DEMAND INKJET PRINTING
- 7.3.2.1 Thermal DoD inkjet printing
- 7.3.2.1.1 Demand for excellent print quality to drive market growth
- 7.3.2.2 Piezo DoD inkjet printing
- 7.3.2.2.1 Offers fast, advanced, and accurate technique for developing printed electronics
- 7.3.2.3 Electrostatic DoD inkjet printing
- 7.3.2.3.1 Growing demand in selected cost-effective applications to support market growth
- 7.3.2.1 Thermal DoD inkjet printing
- 7.3.1 CONTINUOUS INKJET PRINTING
- 7.4 FLEXOGRAPHIC PRINTING
- 7.4.1 DEMAND FOR HIGH-SPEED AND CONTINUOUS PATTERN PRINTING TO FUEL MARKET GROWTH
- 7.5 GRAVURE PRINTING
- 7.5.1 ADOPTION IN LONG-RUN PRINTING PROCESSES TO DRIVE DEMAND
- 7.6 OTHER PRINTING TECHNOLOGIES
- 7.6.1 3D PRINTING
- 7.6.2 OFFSET PRINTING
- 7.6.3 REEL-TO-REEL PRINTING
- 7.6.4 AEROSOL JET PRINTING
- 7.6.5 PNEUMATIC PRINTING
- 7.6.6 NANOIMPRINTING
8 PRINTED ELECTRONICS MARKET, BY MATERIAL
- 8.1 INTRODUCTION
- 8.2 INKS
- 8.2.1 CONDUCTIVE INKS
- 8.2.1.1 Offers high conductivity and cost-effectiveness
- 8.2.1.2 Conductive silver inks
- 8.2.1.3 Conductive copper inks
- 8.2.1.4 Transparent conductive inks
- 8.2.1.5 Silver copper inks
- 8.2.1.6 Carbon inks
- 8.2.2 DIELECTRIC INKS
- 8.2.2.1 Use of dielectric inks enables circuitry crossover and multilayer applications
- 8.2.3 OTHER INKS
- 8.2.3.1 Carbon nanotubes
- 8.2.3.2 Graphene inks
- 8.2.1 CONDUCTIVE INKS
- 8.3 SUBSTRATES
- 8.3.1 ORGANIC SUBSTRATES
- 8.3.1.1 Polymers
- 8.3.1.1.1 Offers low-cost printing of electronic components on flexible substrates
- 8.3.1.1.2 Polyimides
- 8.3.1.1.3 Polyethylene naphthalate
- 8.3.1.1.4 Polyethylene terephthalate
- 8.3.1.2 Paper
- 8.3.1.2.1 Offers flexibility, cost-effectiveness, and printing sustainability
- 8.3.1.2.2 Polyacrylate
- 8.3.1.2.3 Polystyrene
- 8.3.1.2.4 Polyvinylpyrrolidone
- 8.3.1.2.5 Polyvinyl alcohol
- 8.3.1.3 Other organic substrates
- 8.3.1.1 Polymers
- 8.3.2 INORGANIC SUBSTRATES
- 8.3.2.1 Glass
- 8.3.2.1.1 Increased demand for flexible glass substrates to support market growth
- 8.3.2.2 Other inorganic substrates
- 8.3.2.2.1 Silicon
- 8.3.2.2.2 Metal oxides
- 8.3.2.2.2.1 Silicon dioxide
- 8.3.2.2.2.2 Aluminum oxide
- 8.3.2.2.2.3 Titanium oxide
- 8.3.2.1 Glass
- 8.3.1 ORGANIC SUBSTRATES
9 PRINTED ELECTRONICS MARKET, BY RESOLUTION
- 9.1 INTRODUCTION
- 9.2 BELOW 100 LINES/CM
- 9.2.1 RISING DEMAND FOR COST-EFFECTIVE, SCALABLE MANUFACTURING FUELING ADOPTION
- 9.3 100-200 LINES/CM
- 9.3.1 INKJET PRINTING TO BE MOST WIDELY USED TECHNOLOGY FOR 100-200 LINES/CM SEGMENT
- 9.4 ABOVE 200 LINES/CM
- 9.4.1 NEED FOR HIGH-PERFORMANCE CIRCUIT FUNCTIONALITIES TO DRIVE MARKET GROWTH
10 PRINTED ELECTRONICS MARKET, BY APPLICATION
- 10.1 INTRODUCTION
- 10.2 DISPLAYS
- 10.2.1 E-PAPER DISPLAYS
- 10.2.1.1 Electrochromic displays
- 10.2.1.1.1 Increasing global adoption of electrochromic displays owing to their consistent performance and flexibility
- 10.2.1.2 Electrophoretic displays
- 10.2.1.2.1 Rising use in e-readers contributing to market growth
- 10.2.1.3 Other e-paper displays
- 10.2.1.1 Electrochromic displays
- 10.2.2 ELECTROLUMINESCENT DISPLAYS
- 10.2.2.1 OLED displays
- 10.2.2.1.1 Use of printed electronics increasing for developing thinner, rollable, and more efficient OLED displays
- 10.2.2.2 Flexible OLED displays
- 10.2.2.2.1 Prevailing trend of flexible consumer electronic devices to drive market
- 10.2.2.3 LCDs
- 10.2.2.3.1 Highly suited to television and automotive applications
- 10.2.2.1 OLED displays
- 10.2.1 E-PAPER DISPLAYS
- 10.3 PHOTOVOLTAIC CELLS
- 10.3.1 USE OF PRINTED PV CELLS RISING TO ENHANCE EFFICIENCY OF SOLAR CONVERSION DEVICES
- 10.4 RFID TAGS
- 10.4.1 GROWING ADOPTION OF PRINTED RFID TAGS OVER SILICON CHIPS OWING TO THEIR COST-EFFICIENCY
- 10.5 LIGHTING
- 10.5.1 ELECTROLUMINESCENT LIGHTING
- 10.5.1.1 Offers high flexibility and thin form factor
- 10.5.2 ORGANIC LIGHT-EMITTING DIODE LIGHTING
- 10.5.2.1 Growing awareness of green building to increase demand for printed OLED lighting
- 10.5.1 ELECTROLUMINESCENT LIGHTING
- 10.6 SENSORS
- 10.6.1 TOUCH SENSORS
- 10.6.1.1 Increasing demand for touch-enabled electronic devices to drive market
- 10.6.2 GAS SENSORS
- 10.6.2.1 Growing concern for indoor and outdoor air quality to fuel market growth
- 10.6.3 HUMIDITY SENSORS
- 10.6.3.1 Adoption in environment control systems to drive growth
- 10.6.4 PRESSURE SENSORS
- 10.6.4.1 Technological advancements in printed pressure sensors fueling adoption in healthcare applications
- 10.6.5 IMAGE SENSORS
- 10.6.5.1 Easy scalability into larger areas and high-pixel densities to increase adoption
- 10.6.6 TEMPERATURE SENSORS
- 10.6.6.1 Rising demand for reliable, high-performance, and low-cost temperature sensors fueling market growth
- 10.6.7 OTHER SENSORS
- 10.6.1 TOUCH SENSORS
- 10.7 BATTERIES
- 10.7.1 DEMAND FOR PRINTED BATTERIES IN HEALTHCARE APPLICATIONS TO DRIVE MARKET GROWTH
- 10.8 OTHER APPLICATIONS
11 PRINTED ELECTRONICS MARKET, BY END-USE INDUSTRY
- 11.1 INTRODUCTION
- 11.2 AUTOMOTIVE & TRANSPORTATION
- 11.2.1 INCREASING ADOPTION OF INTERACTIVE DASHBOARDS AND FLEXIBLE PRINTED DISPLAYS TO DRIVE MARKET
- 11.3 CONSUMER ELECTRONICS
- 11.3.1 INCREASED DEMAND FOR COMPACT ELECTRONIC DEVICES FUELING MARKET GROWTH
- 11.4 HEALTHCARE
- 11.4.1 INCREASING ADOPTION OF BIOSENSORS TO DRIVE MARKET GROWTH
- 11.5 RETAIL & PACKAGING
- 11.5.1 EMERGING APPLICATIONS OF PRINTED ELECTRONICS TO PROPEL MARKET GROWTH
- 11.6 AEROSPACE & DEFENSE
- 11.6.1 NEED TO REDUCE SIZE AND WEIGHT OF AEROSPACE & DEFENSE COMMUNICATION SYSTEMS TO DRIVE MARKET
- 11.7 CONSTRUCTION & ARCHITECTURE
- 11.7.1 GROWING TREND OF SMART BUILDINGS TO FUEL MARKET GROWTH
- 11.8 OTHER END-USE INDUSTRIES
12 PRINTED ELECTRONICS MARKET, BY REGION
- 12.1 INTRODUCTION
- 12.2 NORTH AMERICA
- 12.2.1 MACROECONOMIC OUTLOOK FOR NORTH AMERICA
- 12.2.1.1 US
- 12.2.1.1.1 Presence of major companies to fuel market growth
- 12.2.1.2 Canada
- 12.2.1.2.1 Numerous initiatives taken by government and non-government institutions to support market growth
- 12.2.1.3 Mexico
- 12.2.1.3.1 Increase in automotive production and export to fuel demand for printed electronic devices
- 12.2.1.1 US
- 12.2.1 MACROECONOMIC OUTLOOK FOR NORTH AMERICA
- 12.3 EUROPE
- 12.3.1 MACROECONOMIC OUTLOOK FOR EUROPE
- 12.3.2 GERMANY
- 12.3.2.1 Technological innovations related to automotive industry driving market growth
- 12.3.3 FRANCE
- 12.3.3.1 Surging demand for electric vehicles to spur market growth
- 12.3.4 UK
- 12.3.4.1 Robust economy and significant funding from public and private bodies fueling market growth
- 12.3.5 REST OF EUROPE
- 12.4 ASIA PACIFIC
- 12.4.1 MACROECONOMIC OUTLOOK FOR ASIA PACIFIC
- 12.4.2 CHINA
- 12.4.2.1 Growth in automotive and consumer electronics industries to propel demand
- 12.4.3 AUSTRALIA
- 12.4.3.1 Increased R&D activities in printed electronics to boost market growth
- 12.4.4 JAPAN
- 12.4.4.1 Presence of numerous printed electronics consumers supporting market growth
- 12.4.5 SOUTH KOREA
- 12.4.5.1 Flourishing consumer electronics industry and presence of key manufacturers of printed electronics fueling market growth
- 12.4.6 REST OF ASIA PACIFIC
- 12.5 ROW
- 12.5.1 MACROECONOMIC OUTLOOK FOR ROW
- 12.5.2 MIDDLE EAST & AFRICA
- 12.5.2.1 Increased customer awareness, adoption of innovative technologies, and production of electronic components to fuel growth
- 12.5.2.2 GCC
- 12.5.2.3 Rest of Middle East & Africa
- 12.5.3 SOUTH AMERICA
- 12.5.3.1 Increasing demand in automotive and transportation applications to creates market opportunities
13 COMPETITIVE LANDSCAPE
- 13.1 OVERVIEW
- 13.2 KEY PLAYER STRATEGIES/RIGHT TO WIN, 2021-2025
- 13.3 REVENUE ANALYSIS, 2022-2024
- 13.4 MARKET SHARE ANALYSIS, 2024
- 13.5 COMPANY VALUATION AND FINANCIAL METRICS
- 13.6 BRAND COMPARISON
- 13.7 COMPANY EVALUATION MATRIX: KEY PLAYERS, 2024
- 13.7.1 STARS
- 13.7.2 EMERGING LEADERS
- 13.7.3 PERVASIVE PLAYERS
- 13.7.4 PARTICIPANTS
- 13.7.5 COMPANY FOOTPRINT: KEY PLAYERS, 2024
- 13.7.5.1 Company footprint
- 13.7.5.2 Region footprint
- 13.7.5.3 Material footprint
- 13.7.5.4 Application footprint
- 13.7.5.5 End-use industry footprint
- 13.8 COMPANY EVALUATION MATRIX: STARTUPS/SMES, 2024
- 13.8.1 PROGRESSIVE COMPANIES
- 13.8.2 RESPONSIVE COMPANIES
- 13.8.3 DYNAMIC COMPANIES
- 13.8.4 STARTING BLOCKS
- 13.8.5 COMPETITIVE BENCHMARKING: STARTUPS/SMES, 2024
- 13.8.5.1 Detailed list of key startups/SMEs
- 13.8.5.2 Competitive benchmarking of key startups/SMEs
- 13.9 COMPETITIVE SCENARIO
- 13.9.1 PRODUCT LAUNCHES
- 13.9.2 DEALS
- 13.9.3 EXPANSIONS
14 COMPANY PROFILES
- 14.1 KEY PLAYERS
- 14.1.1 DUPONT
- 14.1.1.1 Business overview
- 14.1.1.2 Products/solutions offered
- 14.1.1.3 Recent developments
- 14.1.1.3.1 Deals
- 14.1.1.3.2 Expansions
- 14.1.1.4 MnM view
- 14.1.1.4.1 Key strengths
- 14.1.1.4.2 Strategic choices
- 14.1.1.4.3 Weaknesses and competitive threats
- 14.1.2 BASF
- 14.1.2.1 Business overview
- 14.1.2.2 Products/solutions offered
- 14.1.2.3 MnM view
- 14.1.2.3.1 Key strengths
- 14.1.2.3.2 Strategic choices
- 14.1.2.3.3 Weaknesses and competitive threats
- 14.1.3 NOVACENTRIX
- 14.1.3.1 Business overview
- 14.1.3.2 Products/solutions offered
- 14.1.3.3 Recent developments
- 14.1.3.3.1 Product launches
- 14.1.3.3.2 Deals
- 14.1.3.4 MnM view
- 14.1.3.4.1 Key strengths
- 14.1.3.4.2 Strategic choices
- 14.1.3.4.3 Weaknesses and competitive threats
- 14.1.4 AGFA-GEVAERT GROUP
- 14.1.4.1 Business overview
- 14.1.4.2 Products/solutions offered
- 14.1.4.3 Recent developments
- 14.1.4.3.1 Deals
- 14.1.4.4 MnM view
- 14.1.4.4.1 Key strengths
- 14.1.4.4.2 Strategic choices
- 14.1.4.4.3 Weaknesses and competitive threats
- 14.1.5 HENKEL AG & CO. KGAA
- 14.1.5.1 Business overview
- 14.1.5.2 Products/solutions offered
- 14.1.5.3 Recent developments
- 14.1.5.3.1 Other developments
- 14.1.5.4 MnM view
- 14.1.5.4.1 Key strengths
- 14.1.5.4.2 Strategic choices
- 14.1.5.4.3 Weaknesses and competitive threats
- 14.1.6 SAMSUNG
- 14.1.6.1 Business overview
- 14.1.6.2 Products/solutions offered
- 14.1.6.3 Recent developments
- 14.1.6.3.1 Product launches
- 14.1.6.3.2 Deals
- 14.1.7 LG DISPLAY CO., LTD.
- 14.1.7.1 Business overview
- 14.1.7.2 Products/solutions offered
- 14.1.7.3 Recent developments
- 14.1.7.3.1 Product launches
- 14.1.7.3.2 Deals
- 14.1.8 MOLEX
- 14.1.8.1 Business overview
- 14.1.8.2 Products/solutions offered
- 14.1.8.3 Recent developments
- 14.1.8.3.1 Product launches
- 14.1.9 PALO ALTO RESEARCH CENTER INCORPORATED (PARC)
- 14.1.9.1 Business overview
- 14.1.9.2 Products/solutions offered
- 14.1.9.3 Recent developments
- 14.1.9.3.1 Product launches
- 14.1.10 NISSHA CO., LTD.
- 14.1.10.1 Business overview
- 14.1.10.2 Products/solutions offered
- 14.1.10.3 Recent developments
- 14.1.10.3.1 Product launches
- 14.1.10.3.2 Deals
- 14.1.11 E INK HOLDINGS INC.
- 14.1.11.1 Business overview
- 14.1.11.2 Products/solutions offered
- 14.1.11.3 Recent developments
- 14.1.11.3.1 Product launches
- 14.1.11.3.2 Deals
- 14.1.1 DUPONT
- 14.2 OTHER KEY PLAYERS
- 14.2.1 SUN CHEMICAL
- 14.2.2 TORAY INDUSTRIES, INC.
- 14.2.3 YNVISIBLE INTERACTIVE INC.
- 14.2.4 JABIL INC.
- 14.2.5 OPTOMEC, INC.
- 14.2.6 CAMBRIDGE DISPLAY TECHNOLOGY, LTD.
- 14.2.7 PRINTED ELECTRONICS LIMITED
- 14.2.8 ENFUCELL
- 14.2.9 ENSURGE MICROPOWER ASA
- 14.2.10 VORBECK MATERIALS CORP.
- 14.2.11 GRAPHENICALAB SL
- 14.2.12 HERAEUS GROUP
- 14.2.13 GENESINK
- 14.2.14 ELECTRONINKS
- 14.2.15 APPLIED INK SOLUTIONS
15 APPENDIX
- 15.1 DISCUSSION GUIDE
- 15.2 KNOWLEDGESTORE: MARKETSANDMARKETS' SUBSCRIPTION PORTAL
- 15.3 CUSTOMIZATION OPTIONS
- 15.4 RELATED REPORTS
- 15.5 AUTHOR DETAILS
List of Tables
- TABLE 1 PRINTED ELECTRONICS MARKET: ROLE OF PLAYERS IN ECOSYSTEM
- TABLE 2 AVERAGE SELLING PRICE OF PRINTED ELECTRONICS MATERIALS
- TABLE 3 AVERAGE SELLING PRICE TREND OF MATERIALS (INK), BY REGION, 2021-2024 (USD)
- TABLE 4 LIST OF PATENTS, 2024-2025
- TABLE 5 IMPORT DATA FOR HS CODE 853400-COMPLIANT PRODUCTS, BY COUNTRY, 2020-2024 (USD THOUSAND)
- TABLE 6 EXPORT DATA FOR HS CODE 853400-COMPLIANT PRODUCTS, BY COUNTRY, 2019-2023 (USD THOUSAND)
- TABLE 7 LIST OF KEY CONFERENCES AND EVENTS, 2025-2026
- TABLE 8 PRINTED ELECTRONICS MARKET: IMPACT OF PORTER'S FIVE FORCES
- TABLE 9 US-ADJUSTED RECIPROCAL TARIFF RATES
- TABLE 10 PRINTED ELECTRONICS MARKET, BY PRINTING TECHNOLOGY, 2021-2024 (USD MILLION)
- TABLE 11 PRINTED ELECTRONICS MARKET, BY PRINTING TECHNOLOGY, 2025-2030 (USD MILLION)
- TABLE 12 PRINTED ELECTRONICS MARKET FOR SCREEN PRINTING, BY APPLICATION, 2021-2024 (USD MILLION)
- TABLE 13 PRINTED ELECTRONICS MARKET FOR SCREEN PRINTING, BY APPLICATION, 2025-2030 (USD MILLION)
- TABLE 14 PRINTED ELECTRONICS MARKET FOR INKJET PRINTING, BY APPLICATION, 2021-2024 (USD MILLION)
- TABLE 15 PRINTED ELECTRONICS MARKET FOR INKJET PRINTING, BY APPLICATION, 2025-2030 (USD MILLION)
- TABLE 16 PRINTED ELECTRONICS MARKET FOR INKJET PRINTING, BY RESOLUTION, 2021-2024 (USD MILLION)
- TABLE 17 PRINTED ELECTRONICS MARKET FOR INKJET PRINTING, BY RESOLUTION, 2025-2030 (USD MILLION)
- TABLE 18 PRINTED ELECTRONICS MARKET FOR FLEXOGRAPHIC PRINTING, BY APPLICATION, 2021-2024 (USD MILLION)
- TABLE 19 PRINTED ELECTRONICS MARKET FOR FLEXOGRAPHIC PRINTING, BY APPLICATION, 2025-2030 (USD MILLION)
- TABLE 20 PRINTED ELECTRONICS MARKET FOR GRAVURE PRINTING, BY APPLICATION, 2021-2024 (USD MILLION)
- TABLE 21 PRINTED ELECTRONICS MARKET FOR GRAVURE PRINTING, BY APPLICATION, 2025-2030 (USD MILLION)
- TABLE 22 PRINTED ELECTRONICS MARKET FOR OTHER PRINTING TECHNOLOGIES, BY APPLICATION, 2021-2024 (USD MILLION)
- TABLE 23 PRINTED ELECTRONICS MARKET FOR OTHER PRINTING TECHNOLOGIES, BY APPLICATION, 2025-2030 (USD MILLION)
- TABLE 24 PRINTED ELECTRONICS MARKET FOR OTHER PRINTING TECHNOLOGIES, BY RESOLUTION, 2021-2024 (USD MILLION)
- TABLE 25 PRINTED ELECTRONICS MARKET FOR OTHER PRINTING TECHNOLOGIES, BY RESOLUTION, 2025-2030 (USD MILLION)
- TABLE 26 PRINTED ELECTRONICS MARKET, BY MATERIAL, 2021-2024 (USD MILLION)
- TABLE 27 PRINTED ELECTRONICS MARKET, BY MATERIAL, 2025-2030 (USD MILLION)
- TABLE 28 PRINTED ELECTRONICS MARKET, IN TERMS OF VOLUME, 2021-2024 (TONNES)
- TABLE 29 PRINTED ELECTRONICS MARKET, IN TERMS OF VOLUME, 2025-2030 (TONNES)
- TABLE 30 PRINTED ELECTRONICS MARKET FOR INKS, BY TYPE, 2021-2024 (USD MILLION)
- TABLE 31 PRINTED ELECTRONICS MARKET FOR INKS, BY TYPE, 2025-2030 (USD MILLION)
- TABLE 32 PRINTED ELECTRONICS MARKET FOR SUBSTRATES, BY TYPE, 2021-2024 (USD MILLION)
- TABLE 33 PRINTED ELECTRONICS MARKET FOR SUBSTRATES, BY TYPE, 2025-2030 (USD MILLION)
- TABLE 34 PRINTED ELECTRONICS MARKET FOR ORGANIC AND INORGANIC SUBSTRATES, BY TYPE, 2021-2024 (USD MILLION)
- TABLE 35 PRINTED ELECTRONICS MARKET FOR ORGANIC AND INORGANIC SUBSTRATES, BY TYPE, 2025-2030 (USD MILLION)
- TABLE 36 BENEFITS AND APPLICATIONS OF POLYETHYLENE NAPHTHALENE (PEN)
- TABLE 37 BENEFITS AND APPLICATIONS OF POLYETHYLENE TEREPHTHALATE (PET)
- TABLE 38 PRINTED ELECTRONICS MARKET, BY RESOLUTION, 2021-2024 (USD MILLION)
- TABLE 39 PRINTED ELECTRONICS MARKET, BY RESOLUTION, 2025-2030 (USD MILLION)
- TABLE 40 BELOW 100 LINES/CM PRINTED ELECTRONICS MARKET, BY PRINTING TECHNOLOGY, 2021-2024 (USD MILLION)
- TABLE 41 BELOW 100 LINES/CM PRINTED ELECTRONICS MARKET, BY PRINTING TECHNOLOGY, 2025-2030 (USD MILLION)
- TABLE 42 100-200 LINES/CM PRINTED ELECTRONICS MARKET, BY PRINTING TECHNOLOGY, 2021-2024 (USD MILLION)
- TABLE 43 100-200 LINES/CM PRINTED ELECTRONICS MARKET, BY PRINTING TECHNOLOGY, 2025-2030 (USD MILLION)
- TABLE 44 ABOVE 200 LINES/CM PRINTED ELECTRONICS MARKET, BY PRINTING TECHNOLOGY, 2021-2024 (USD MILLION)
- TABLE 45 ABOVE 200 LINES/CM PRINTED ELECTRONICS MARKET, BY PRINTING TECHNOLOGY, 2025-2030 (USD MILLION)
- TABLE 46 PRINTED ELECTRONICS MARKET, BY APPLICATION, 2021-2024 (USD MILLION)
- TABLE 47 PRINTED ELECTRONICS MARKET, BY APPLICATION, 2025-2030 (USD MILLION)
- TABLE 48 PRINTED ELECTRONICS MARKET IN DISPLAYS, BY TYPE, 2021-2024 (USD MILLION)
- TABLE 49 PRINTED ELECTRONICS MARKET IN DISPLAYS, BY TYPE, 2025-2030 (USD MILLION)
- TABLE 50 PRINTED ELECTRONICS MARKET IN DISPLAYS, BY PRINTING TECHNOLOGY, 2021-2024 (USD MILLION)
- TABLE 51 PRINTED ELECTRONICS MARKET IN DISPLAYS, BY PRINTING TECHNOLOGY, 2025-2030 (USD MILLION)
- TABLE 52 PRINTED ELECTRONICS MARKET IN DISPLAYS, BY REGION, 2021-2024 (USD MILLION)
- TABLE 53 PRINTED ELECTRONICS MARKET IN DISPLAYS, BY REGION, 2025-2030 (USD MILLION)
- TABLE 54 PRINTED ELECTRONICS MARKET IN E-PAPER DISPLAYS, BY TYPE, 2021-2024 (USD MILLION)
- TABLE 55 PRINTED ELECTRONICS MARKET IN E-PAPER DISPLAYS, BY TYPE, 2025-2030 (USD MILLION)
- TABLE 56 PRINTED ELECTRONICS MARKET IN PV CELLS, BY PRINTING TECHNOLOGY, 2021-2024 (USD MILLION)
- TABLE 57 PRINTED ELECTRONICS MARKET IN PV CELLS, BY PRINTING TECHNOLOGY, 2025-2030 (USD MILLION)
- TABLE 58 PRINTED ELECTRONICS MARKET IN PV CELLS, BY REGION, 2021-2024 (USD MILLION)
- TABLE 59 PRINTED ELECTRONICS MARKET IN PV CELLS, BY REGION, 2025-2030 (USD MILLION)
- TABLE 60 PRINTED ELECTRONICS MARKET IN RFID TAGS, BY PRINTING TECHNOLOGY, 2021-2024 (USD MILLION)
- TABLE 61 PRINTED ELECTRONICS MARKET IN RFID TAGS, BY PRINTING TECHNOLOGY, 2025-2030 (USD MILLION)
- TABLE 62 PRINTED ELECTRONICS MARKET IN RFID TAGS, BY REGION, 2021-2024 (USD MILLION)
- TABLE 63 PRINTED ELECTRONICS MARKET IN RFID TAGS, BY REGION, 2025-2030 (USD MILLION)
- TABLE 64 PRINTED ELECTRONICS MARKET IN LIGHTING, BY TYPE, 2021-2024 (USD MILLION)
- TABLE 65 PRINTED ELECTRONICS MARKET IN LIGHTING, BY TYPE, 2025-2030 (USD MILLION)
- TABLE 66 PRINTED ELECTRONICS MARKET IN LIGHTING, BY PRINTING TECHNOLOGY, 2021-2024 (USD MILLION)
- TABLE 67 PRINTED ELECTRONICS MARKET IN LIGHTING, BY PRINTING TECHNOLOGY, 2025-2030 (USD MILLION)
- TABLE 68 PRINTED ELECTRONICS MARKET IN LIGHTING, BY REGION, 2021-2024 (USD MILLION)
- TABLE 69 PRINTED ELECTRONICS MARKET IN LIGHTING, BY REGION, 2025-2030 (USD MILLION)
- TABLE 70 PRINTED ELECTRONICS MARKET IN SENSORS, BY TYPE, 2021-2024 (USD MILLION)
- TABLE 71 PRINTED ELECTRONICS MARKET IN SENSORS, BY TYPE, 2025-2030 (USD MILLION)
- TABLE 72 PRINTED ELECTRONICS MARKET IN SENSORS, BY PRINTING TECHNOLOGY, 2021-2024 (USD MILLION)
- TABLE 73 PRINTED ELECTRONICS MARKET IN SENSORS, BY PRINTING TECHNOLOGY, 2025-2030 (USD MILLION)
- TABLE 74 PRINTED ELECTRONICS MARKET IN SENSORS, BY REGION, 2021-2024 (USD MILLION)
- TABLE 75 PRINTED ELECTRONICS MARKET IN SENSORS, BY REGION, 2025-2030 (USD MILLION)
- TABLE 76 PRINTED ELECTRONICS MARKET IN BATTERIES, BY PRINTING TECHNOLOGY, 2021-2024 (USD MILLION)
- TABLE 77 PRINTED ELECTRONICS MARKET IN BATTERIES, BY PRINTING TECHNOLOGY, 2025-2030 (USD MILLION)
- TABLE 78 PRINTED ELECTRONICS MARKET IN BATTERIES, BY REGION, 2021-2024 (USD MILLION)
- TABLE 79 PRINTED ELECTRONICS MARKET IN BATTERIES, BY REGION, 2025-2030 (USD MILLION)
- TABLE 80 PRINTED ELECTRONICS MARKET IN BATTERIES, BY VOLTAGE, 2021-2024 (USD MILLION)
- TABLE 81 PRINTED ELECTRONICS MARKET IN BATTERIES, BY VOLTAGE, 2025-2030 (USD MILLION)
- TABLE 82 PRINTED ELECTRONICS MARKET IN OTHER APPLICATIONS, BY PRINTING TECHNOLOGY, 2021-2024 (USD MILLION)
- TABLE 83 PRINTED ELECTRONICS MARKET IN OTHER APPLICATIONS, BY PRINTING TECHNOLOGY, 2025-2030 (USD MILLION)
- TABLE 84 PRINTED ELECTRONICS MARKET IN OTHER APPLICATIONS, BY REGION, 2021-2024 (USD MILLION)
- TABLE 85 PRINTED ELECTRONICS MARKET IN OTHER APPLICATIONS, BY REGION, 2025-2030 (USD MILLION)
- TABLE 86 PRINTED ELECTRONICS MARKET, BY END-USE INDUSTRY, 2021-2024 (USD MILLION)
- TABLE 87 PRINTED ELECTRONICS MARKET, BY END-USE INDUSTRY, 2025-2030 (USD MILLION)
- TABLE 88 PRINTED ELECTRONICS MARKET IN AUTOMOTIVE & TRANSPORTATION, BY REGION, 2021-2024 (USD MILLION)
- TABLE 89 PRINTED ELECTRONICS MARKET IN AUTOMOTIVE & TRANSPORTATION, BY REGION, 2025-2030 (USD MILLION)
- TABLE 90 PRINTED ELECTRONICS MARKET IN CONSUMER ELECTRONICS, BY REGION, 2021-2024 (USD MILLION)
- TABLE 91 PRINTED ELECTRONICS MARKET IN CONSUMER ELECTRONICS, BY REGION, 2025-2030 (USD MILLION)
- TABLE 92 PRINTED ELECTRONICS MARKET IN HEALTHCARE, BY REGION, 2021-2024 (USD MILLION)
- TABLE 93 PRINTED ELECTRONICS MARKET IN HEALTHCARE, BY REGION, 2025-2030 (USD MILLION)
- TABLE 94 PRINTED ELECTRONICS MARKET IN RETAIL & PACKAGING, BY REGION, 2021-2024 (USD MILLION)
- TABLE 95 PRINTED ELECTRONICS MARKET IN RETAIL & PACKAGING, BY REGION, 2025-2030 (USD MILLION)
- TABLE 96 PRINTED ELECTRONICS MARKET IN AEROSPACE & DEFENSE, BY REGION, 2021-2024 (USD MILLION)
- TABLE 97 PRINTED ELECTRONICS MARKET IN AEROSPACE & DEFENSE, BY REGION, 2025-2030 (USD MILLION)
- TABLE 98 PRINTED ELECTRONICS MARKET IN CONSTRUCTION & ARCHITECTURE, BY REGION, 2021-2024 (USD MILLION)
- TABLE 99 PRINTED ELECTRONICS MARKET IN CONSTRUCTION & ARCHITECTURE, BY REGION, 2025-2030 (USD MILLION)
- TABLE 100 PRINTED ELECTRONICS MARKET IN OTHER END-USE INDUSTRIES, BY REGION, 2021-2024 (USD MILLION)
- TABLE 101 PRINTED ELECTRONICS MARKET IN OTHER END-USE INDUSTRIES, BY REGION, 2025-2030 (USD MILLION)
- TABLE 102 PRINTED ELECTRONICS MARKET, BY REGION, 2021-2024 (USD MILLION)
- TABLE 103 PRINTED ELECTRONICS MARKET, BY REGION, 2025-2030 (USD MILLION)
- TABLE 104 NORTH AMERICA: PRINTED ELECTRONICS MARKET, BY APPLICATION, 2021-2024 (USD MILLION)
- TABLE 105 NORTH AMERICA: PRINTED ELECTRONICS MARKET, BY APPLICATION, 2025-2030 (USD MILLION)
- TABLE 106 NORTH AMERICA: PRINTED ELECTRONICS MARKET, BY END-USE INDUSTRY, 2021-2024 (USD MILLION)
- TABLE 107 NORTH AMERICA: PRINTED ELECTRONICS MARKET, BY END-USE INDUSTRY, 2025-2030 (USD MILLION)
- TABLE 108 NORTH AMERICA: PRINTED ELECTRONICS MARKET FOR SENSORS, BY COUNTRY, 2021-2024 (USD MILLION)
- TABLE 109 NORTH AMERICA: PRINTED ELECTRONICS MARKET FOR SENSORS, BY COUNTRY, 2025-2030 (USD MILLION)
- TABLE 110 EUROPE: PRINTED ELECTRONICS MARKET, BY APPLICATION, 2021-2024 (USD MILLION)
- TABLE 111 EUROPE: PRINTED ELECTRONICS MARKET, BY APPLICATION, 2025-2030 (USD MILLION)
- TABLE 112 EUROPE: PRINTED ELECTRONICS MARKET, BY END-USE INDUSTRY, 2021-2024 (USD MILLION)
- TABLE 113 EUROPE: PRINTED ELECTRONICS MARKET, BY END-USE INDUSTRY, 2025-2030 (USD MILLION)
- TABLE 114 EUROPE: PRINTED ELECTRONICS MARKET, BY COUNTRY, 2021-2024 (USD MILLION)
- TABLE 115 EUROPE: PRINTED ELECTRONICS MARKET, BY COUNTRY, 2025-2030 (USD MILLION)
- TABLE 116 ASIA PACIFIC: PRINTED ELECTRONICS MARKET, BY APPLICATION, 2021-2024 (USD MILLION)
- TABLE 117 ASIA PACIFIC: PRINTED ELECTRONICS MARKET, BY APPLICATION, 2025-2030 (USD MILLION)
- TABLE 118 ASIA PACIFIC: PRINTED ELECTRONICS MARKET, BY END-USE INDUSTRY, 2021-2024 (USD MILLION)
- TABLE 119 ASIA PACIFIC: PRINTED ELECTRONICS MARKET, BY END-USE INDUSTRY, 2025-2030 (USD MILLION)
- TABLE 120 ASIA PACIFIC PRINTED ELECTRONICS MARKET, BY COUNTRY, 2021-2024 (USD MILLION)
- TABLE 121 ASIA PACIFIC: PRINTED ELECTRONICS MARKET, BY COUNTRY, 2025-2030 (USD MILLION)
- TABLE 122 ROW: PRINTED ELECTRONICS MARKET, BY APPLICATION, 2021-2024 (USD MILLION)
- TABLE 123 ROW: PRINTED ELECTRONICS MARKET, BY APPLICATION, 2025-2030 (USD MILLION)
- TABLE 124 ROW: PRINTED ELECTRONICS MARKET, BY END-USE INDUSTRY, 2021-2024 (USD MILLION)
- TABLE 125 ROW: PRINTED ELECTRONICS MARKET, BY END-USE INDUSTRY, 2025-2030 (USD MILLION)
- TABLE 126 ROW: PRINTED ELECTRONICS MARKET, BY REGION, 2021-2024 (USD MILLION)
- TABLE 127 ROW: PRINTED ELECTRONICS MARKET, BY REGION, 2025-2030 (USD MILLION)
- TABLE 128 MIDDLE EAST & AFRICA: PRINTED ELECTRONICS MARKET, BY REGION, 2021-2024 (USD MILLION)
- TABLE 129 MIDDLE EAST & AFRICA: PRINTED ELECTRONICS MARKET, BY REGION, 2025-2030 (USD MILLION)
- TABLE 130 PRINTED ELECTRONICS MARKET: OVERVIEW OF STRATEGIES ADOPTED BY KEY PLAYERS, JANUARY 2021 AND AUGUST 2025
- TABLE 131 PRINTED ELECTRONICS MARKET: DEGREE OF COMPETITION, 2024
- TABLE 132 PRINTED ELECTRONICS MARKET: REGION FOOTPRINT
- TABLE 133 PRINTED ELECTRONICS MARKET: MATERIAL FOOTPRINT
- TABLE 134 PRINTED ELECTRONICS MARKET: APPLICATION FOOTPRINT
- TABLE 135 PRINTED ELECTRONICS MARKET: END-USE INDUSTRY FOOTPRINT
- TABLE 136 PRINTED ELECTRONICS MARKET: DETAILED LIST OF KEY STARTUPS/SMES
- TABLE 137 PRINTED ELECTRONICS MARKET: COMPETITIVE BENCHMARKING OF KEY STARTUPS/SMES
- TABLE 138 PRINTED ELECTRONICS MARKET: PRODUCT LAUNCHES, JANUARY 2021-AUGUST 2025
- TABLE 139 PRINTED ELECTRONICS MARKET: DEALS, JANUARY 2021-AUGUST 2025
- TABLE 140 PRINTED ELECTRONICS MARKET: EXPANSIONS, JANUARY 2021-AUGUST 2025
- TABLE 141 DUPONT: COMPANY OVERVIEW
- TABLE 142 DUPONT: PRODUCTS/SOLUTIONS OFFERED
- TABLE 143 DUPONT: DEALS
- TABLE 144 DUPONT: EXPANSIONS
- TABLE 145 BASF: COMPANY OVERVIEW
- TABLE 146 BASF: PRODUCTS/SOLUTIONS OFFERED
- TABLE 147 NOVACENTRIX: COMPANY OVERVIEW
- TABLE 148 NOVACENTRIX: PRODUCTS/SOLUTIONS OFFERED
- TABLE 149 NOVACENTRIX: PRODUCT LAUNCHES
- TABLE 150 NOVACENTRIX: DEALS
- TABLE 151 AGFA-GEVAERT GROUP: COMPANY OVERVIEW
- TABLE 152 AGFA-GEVAERT GROUP: PRODUCTS/SOLUTIONS OFFERED
- TABLE 153 AGFA-GEVAERT GROUP: DEALS
- TABLE 154 HENKEL AG & CO. KGAA: COMPANY OVERVIEW
- TABLE 155 HENKEL AG & CO. KGAA: PRODUCTS/SOLUTIONS OFFERED
- TABLE 156 HENKEL AG & CO. KGAA: OTHER DEVELOPMENTS
- TABLE 157 SAMSUNG: COMPANY OVERVIEW
- TABLE 158 SAMSUNG ELECTRONICS CO. LTD.: PRODUCTS/SOLUTIONS OFFERED
- TABLE 159 SAMSUNG: PRODUCT LAUNCHES
- TABLE 160 SAMSUNG: DEALS
- TABLE 161 LG DISPLAY CO., LTD.: COMPANY OVERVIEW
- TABLE 162 LG DISPLAY CO., LTD.: PRODUCTS/SOLUTIONS OFFERED
- TABLE 163 LG DISPLAY CO., LTD.: PRODUCT LAUNCHES
- TABLE 164 LG DISPLAY CO., LTD.: DEALS
- TABLE 165 MOLEX: COMPANY OVERVIEW
- TABLE 166 MOLEX: PRODUCTS/SOLUTIONS OFFERED
- TABLE 167 MOLEX: PRODUCT LAUNCHES
- TABLE 168 PALO ALTO RESEARCH CENTER INCORPORATED: COMPANY OVERVIEW
- TABLE 169 PALO ALTO RESEARCH CENTER INCORPORATED: PRODUCTS/SOLUTIONS OFFERED
- TABLE 170 PALO ALTO RESEARCH CENTER INCORPORATED: PRODUCT LAUNCHES
- TABLE 171 NISSHA CO., LTD.: COMPANY OVERVIEW
- TABLE 172 NISSHA CO., LTD.: PRODUCTS/SOLUTIONS OFFERED
- TABLE 173 NISSHA CO., LTD.: PRODUCT LAUNCHES
- TABLE 174 NISSHA CO., LTD.: DEALS
- TABLE 175 E INK HOLDINGS INC.: COMPANY OVERVIEW
- TABLE 176 E INK HOLDINGS INC.: PRODUCTS/SOLUTIONS OFFERED
- TABLE 177 E INK HOLDINGS INC.: PRODUCT LAUNCHES
- TABLE 178 E INK HOLDINGS INC.: DEALS
List of Figures
- FIGURE 1 PRINTED ELECTRONICS MARKET SEGMENTATION
- FIGURE 2 PRINTED ELECTRONICS MARKET: RESEARCH DESIGN
- FIGURE 3 MARKET SIZE ESTIMATION METHODOLOGY - APPROACH 1: TOP-DOWN (SUPPLY-SIDE)-REVENUES GENERATED BY COMPANIES FROM SALES OF PRINTED ELECTRONICS
- FIGURE 4 MARKET SIZE ESTIMATION METHODOLOGY: BOTTOM-UP APPROACH
- FIGURE 5 MARKET SIZE ESTIMATION METHODOLOGY: TOP-DOWN APPROACH
- FIGURE 6 DATA TRIANGULATION: PRINTED ELECTRONICS MARKET
- FIGURE 7 SCREEN PRINTING TO DOMINATE PRINTED ELECTRONICS MARKET DURING FORECAST PERIOD
- FIGURE 8 INKS SEGMENT TO LEAD PRINTED ELECTRONICS MARKET DURING FORECAST PERIOD
- FIGURE 9 DISPLAYS APPLICATION TO ACCOUNT FOR LARGEST SHARE OF PRINTED ELECTRONICS MARKET FROM 2025 TO 2030
- FIGURE 10 AEROSPACE & DEFENSE SEGMENT TO REGISTER HIGHEST CAGR DURING FORECAST PERIOD
- FIGURE 11 ASIA PACIFIC TO ACCOUNT FOR LARGEST SHARE OF PRINTED ELECTRONICS MARKET IN 2030
- FIGURE 12 INCREASED ADOPTION IN IOT APPLICATIONS TO FUEL MARKET GROWTH FROM 2025 TO 2030
- FIGURE 13 ASIA PACIFIC TO CAPTURE LARGEST SHARE OF PRINTED ELECTRONICS MARKET IN 2025
- FIGURE 14 AUTOMOTIVE & TRANSPORTATION TO ACCOUNT FOR LARGEST MARKET SHARE IN 2030
- FIGURE 15 INKS SEGMENT HELD LARGEST MARKET SHARE IN 2024
- FIGURE 16 INKJET PRINTING TO WITNESS HIGHEST CAGR DURING FORECAST PERIOD
- FIGURE 17 CHINA TO RECORD HIGHEST CAGR IN GLOBAL PRINTED ELECTRONICS MARKET DURING FORECAST PERIOD
- FIGURE 18 DRIVERS, RESTRAINTS, OPPORTUNITIES, AND CHALLENGES
- FIGURE 19 IMPACT ANALYSIS: DRIVERS
- FIGURE 20 IMPACT ANALYSIS OF RESTRAINTS
- FIGURE 21 IMPACT ANALYSIS OF OPPORTUNITIES
- FIGURE 22 IMPACT ANALYSIS OF CHALLENGES
- FIGURE 23 PRINTED ELECTRONICS MARKET: SUPPLY CHAIN ANALYSIS
- FIGURE 24 REVENUE SHIFT IN PRINTED ELECTRONICS MARKET
- FIGURE 25 PRINTED ELECTRONICS MARKET: ECOSYSTEM ANALYSIS
- FIGURE 26 AVERAGE SELLING PRICE (ASP) TREND OF MATERIALS (INK), BY REGION, 2021-2024
- FIGURE 27 PATENTS APPLIED AND GRANTED, 2015-2024
- FIGURE 28 IMPORT SCENARIO FOR HS CODE 853400-COMPLIANT PRODUCTS FOR TOP FIVE COUNTRIES, 2020-2024
- FIGURE 29 EXPORT SCENARIO FOR HS CODE 853400-COMPLIANT PRODUCTS FOR TOP FIVE COUNTRIES, 2020-2024
- FIGURE 30 PORTER'S FIVE FORCES ANALYSIS: PRINTED ELECTRONICS MARKET
- FIGURE 31 IMPACT OF AI/GEN AI ON PRINTED ELECTRONICS MARKET
- FIGURE 32 PRINTED ELECTRONICS MARKET, BY PRINTING TECHNOLOGY
- FIGURE 33 SCREEN PRINTING TO ACCOUNT FOR LARGEST SHARE OF PRINTED ELECTRONICS MARKET IN 2025
- FIGURE 34 PRINTED ELECTRONICS MARKET, BY MATERIAL
- FIGURE 35 INKS TO ACCOUNT FOR LARGER SHARE OF PRINTED ELECTRONICS MARKET DURING FORECAST PERIOD
- FIGURE 36 PRINTED ELECTRONICS MARKET, BY RESOLUTION
- FIGURE 37 BELOW 100 LINES/CM TO DOMINATE PRINTED ELECTRONICS MARKET DURING FORECAST PERIOD
- FIGURE 38 PRINTED ELECTRONICS MARKET, BY APPLICATION
- FIGURE 39 DISPLAYS SEGMENT TO CAPTURE LARGEST SHARE OF PRINTED ELECTRONICS MARKET
- FIGURE 40 TRADITIONAL SENSOR MANUFACTURING PROCESS
- FIGURE 41 PRINTED SENSOR MANUFACTURING PROCESS
- FIGURE 42 PRINTED ELECTRONICS MARKET, BY END-USE INDUSTRY
- FIGURE 43 AUTOMOTIVE & TRANSPORTATION TO ACCOUNT FOR LARGEST SHARE OF PRINTED ELECTRONICS MARKET IN 2025
- FIGURE 44 ASIA PACIFIC TO REGISTER HIGHEST CAGR IN PRINTED ELECTRONICS MARKET DURING FORECAST PERIOD
- FIGURE 45 NORTH AMERICA: PRINTED ELECTRONICS MARKET SNAPSHOT
- FIGURE 46 EUROPE: PRINTED ELECTRONICS MARKET SNAPSHOT
- FIGURE 47 ASIA PACIFIC: PRINTED ELECTRONICS MARKET SNAPSHOT
- FIGURE 48 PRINTED ELECTRONICS MARKET: REVENUE ANALYSIS OF FIVE KEY PLAYERS, 2022-2024
- FIGURE 49 MARKET SHARE ANALYSIS OF COMPANIES OFFERING PRINTED ELECTRONICS, 2024
- FIGURE 50 COMPANY VALUATION, 2025
- FIGURE 51 FINANCIAL METRICS (EV/EBITDA), 2025
- FIGURE 52 BRAND COMPARISON
- FIGURE 53 PRINTED ELECTRONICS MARKET: COMPANY EVALUATION MATRIX (KEY PLAYERS), 2024
- FIGURE 54 PRINTED ELECTRONICS MARKET: COMPANY FOOTPRINT
- FIGURE 55 PRINTED ELECTRONICS MARKET: COMPANY EVALUATION MATRIX (STARTUPS/SMES), 2024
- FIGURE 56 DUPONT: COMPANY SNAPSHOT
- FIGURE 57 BASF: COMPANY SNAPSHOT
- FIGURE 58 AGFA-GEVAERT GROUP: COMPANY SNAPSHOT
- FIGURE 59 HENKEL AG & CO. KGAA: COMPANY SNAPSHOT
- FIGURE 60 SAMSUNG ELECTRONICS CO. LTD.: COMPANY SNAPSHOT
- FIGURE 61 LG DISPLAY CO., LTD.: COMPANY SNAPSHOT
- FIGURE 62 NISSHA CO., LTD.: COMPANY SNAPSHOT
- FIGURE 63 E INK HOLDINGS INC.: COMPANY SNAPSHOT

