
PUBLISHER: MarketsandMarkets | PRODUCT CODE: 1812630
PUBLISHER: MarketsandMarkets | PRODUCT CODE: 1812630
Automotive Test Equipment Market by Equipment (Dynamometer, Vehicle Emission Test, Wheel Alignment, Battery Test System), Propulsion (ICE, EV), Vehicle Type (PC, CV), End Market, Application, Advanced Technology, and Region - Global Forecast to 2032
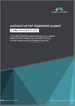
The automotive test equipment market is projected to reach USD 4.79 billion by 2032 from USD 3.66 billion in 2025 at a CAGR of 3.9%. Rising vehicle electronics and software complexity have driven strong demand for integrated HiL and SiL testing solutions, while stricter global emission norms have accelerated the adoption of advanced fuel injection and emission testing systems. Leading test equipment providers, including Horiba Ltd., AVL, National Instruments, Siemens AG, and ATS Korea, are addressing these trends by delivering cost-efficient, portable solutions for emerging markets, building comprehensive platforms spanning ECU, battery, and ADAS testing, and strengthening industry-academia collaborations to validate next-generation automotive technologies.
| Scope of the Report | |
|---|---|
| Years Considered for the Study | 2021-2032 |
| Base Year | 2024 |
| Forecast Period | 2025-2032 |
| Units Considered | Value (USD Million/Billion) |
| Segments | Application, Equipment, Vehicle Type, End Market, Propulsion, Advanced Technology, and Region |
| Regions covered | Asia Pacific, Europe, North America, and Rest of the World |
National Instruments, in July 2024, enhanced its LabVIEW-based testing software with advanced PC-based simulation for faster EV powertrain validation, and Keysight, in March 2025, integrated AI-driven analytics into its PathWave platform to improve ADAS and EV system fault detection. The high cost and rapid obsolescence of advanced test systems pose barriers, particularly for smaller suppliers having to upgrade often to align with diverse and evolving regulatory frameworks. However, these same trends create opportunities for modular, AI-driven, and cloud-enabled test equipment that supports automated diagnostics, predictive analytics, and global harmonization, which enables a faster and more cost-effective validation across OEMs and suppliers.
"Transmission dynamometer is the fastest-growing test equipment type during the forecast period."
With the rise of multi-speed EV gearboxes, hybrid e-axles, and advanced dual-clutch transmissions (DCTs), the demand for precise efficiency, durability, and NVH (noise, vibration, harshness) testing is increasing sharply. Unlike engine or chassis dynamometers, transmission dynamometers enable validation under higher torque densities and varying load profiles, including the ability to simulate regenerative braking loads central to EV operation. Moreover, next-generation transmissions integrate motors, power electronics, and cooling systems, creating complex electro-mechanical interactions that only transmission dynamometers can accurately replicate. At the same time, tightening fuel economy and CO2 regulations are compelling OEMs to target transmission losses below 1%, which in turn requires more advanced and frequent efficiency testing. For instance, in September 2024, AVL introduced a highly integrated multi-speed e-axle for heavy-duty trucks-delivering 400 kW continuous and 540 kW peak power with shifting capability that avoids torque loss-demonstrating the type of system that transmission dynamometers must now validate under real operating conditions. Together, these factors position transmission dynamometers as a critical enabler of innovation in EV and hybrid powertrains, making them the most dynamic growth segment within the automotive test equipment market.
"Battery test equipment is expected to be the largest segment of the market during the forecast period."
The battery test equipment segment is projected to showcase significant growth of all EV test equipment during the forecast period. These systems are designed to evaluate battery cells, modules, and packs across wide operating ranges, typically spanning 5V to 1,000V and currents up to 1,200A, with high precision levels of +-0.02% for voltage and +-0.05% for current. Advanced configurations support bi-directional power flow up to 300 kW per channel, are scalable to multi-megawatt levels, and offer multi-channel capacity that often exceeds 256 channels for simultaneous testing, thereby enhancing R&D throughput. Integration with thermal chambers enables simulation of extreme environmental conditions (-40°C to +80°C), while built-in safety systems guard against overvoltage, short circuits, and thermal runaway. Battery testing equipment is witnessing strong global growth, primarily driven by rapid EV adoption, stricter safety and performance regulations, and rising demand for longer-range and durable batteries. Regulatory compliance is a key driver, as equipment ensures adherence to standards like UNECE R100 and ISO 12405, certifying safety, lifecycle durability, and performance under real-world driving conditions. These systems are critical across the value chain from R&D labs supporting chemistry innovation and drive cycle simulations, to production lines enabling end-of-line validation, and service centers performing diagnostics. Leading providers in this space include Intertek and AVL, who deliver advanced solutions for both OEMs and suppliers. Stringent global regulations and extended warranty obligations are compelling OEMs and suppliers to invest in advanced lifecycle, durability, and abuse testing systems to ensure long-term battery reliability. The advent of next-generation chemistries, including solid-state batteries, is further accelerating demand for specialized testing equipment such as impedance spectroscopy analyzers and dendrite detection systems, which are critical for validating safety and scalability. In parallel, growing emphasis on end-of-life and second-life applications is driving adoption of automated grading and rapid diagnostic tools, enabling efficient battery repurposing and recycling. Leading providers of battery testing equipment and services include Intertek, AVL, TUV Rheinland, Keysight, Dewesoft, HORIBA, SGS, National Instruments, Softing, Durr Group, and Arbin Instruments. These companies offer comprehensive testing solutions such as cell/module/pack-level testing, charge/discharge cycles, and battery lifecycle simulations.
"The Rest of the World is expected to be the second fastest-growing market during the forecast period."
The Rest of the World is the second fastest-growing region during the forecast period. Among the Rest of the World countries, Brazil has established itself as the leading mobility hub, advancing faster than its peers through a dual push of OEM assembly plant expansion and testing facility growth. BYD accelerated localization with three factories in Bahia, including EV, battery, and bus chassis plants, alongside a new Flex 1.5L plug-in engine facility at the Camacari complex in March 2025. GWM began hybrid SUV production in Iracemapolis, while Stellantis introduced Bio-Hybrid technology in Pernambuco, integrating ethanol with electrification for cost-effective solutions. OEMs are investing in testing the hybrid and alternative fuel vehicles in the country. For instance, Volkswagen and Toyota strengthened hybrid flex-fuel programs, and Hyundai advanced ethanol-hybrid R&D at Piracicaba, positioning Brazil as a global testbed for renewable energy vehicles. In commercial transport, Scania rolled out ethanol-hybrid trucks aligned with Brazil's low-carbon policies. Additionally, in June 2025, Marelli inaugurated an INMETRO-accredited EV lab in Hortolandia, enhancing local validation and homologation capacity. This convergence of industrial scale-up and advanced testing positioned Brazil as the fastest-growing market outside the global triad, anchoring its leadership in the evolving mobility landscape.
In Russia, the government and industry players are intensifying efforts to build a domestic automotive ecosystem, with a strong emphasis on testing and R&D. In February 2025, the Ministry of Industry and Trade, the Government of Tatarstan, and RUSNANO Group signed a trilateral agreement to establish an automotive component development center at the Idea Technopark in Kazan, focused on body and chassis components, power electronics, and traction batteries for passenger cars and trucks. The initiative also includes a modern testing laboratory and a training hub for engineering and technical specialists, reinforcing Russia's push for technological self-reliance. Complementing this, Atom announced in December 2024 that its upcoming EV will undergo 48 crash tests, along with aerodynamic, torsional rigidity, climatic, and corrosion durability evaluations, ahead of serial production in 2025. Together, these developments underscore Russia's accelerated push to strengthen its domestic testing infrastructure, enhance EV readiness, and reduce reliance on imports.
In-depth interviews were conducted with CEOs, marketing directors, other innovation and technology directors, and executives from various key organizations operating in this market.
- By Company Type: OEMs - 30%, Tier I & Tier II - 50%, and Others - 20%,
- By Designation: CXOs - 35%, Managers - 25%, and Executives - 40%
- By Region: North America - 30%, Europe - 20%, Asia Pacific - 50%, and Rest of the World - 15%
The automotive test equipment market is dominated by established players such as AVL (Austria), Horiba, Ltd.(Japan), Robert Bosch GmbH (Germany), Phinia Inc.(US), and Illinois Tool Works Inc. (US). These companies actively manufacture and develop new and advanced connectors. They have set up R&D facilities and offer best-in-class products to their customers.
Research Coverage:
The market study covers the automotive test equipment market by product type (engine dynamometer, chassis dynamometer, vehicle emission test system, wheel alignment tester, Fuel injection pump tester, transmission dynamometer), application (mobile/tablet-based equipment, PC/Laptop-based equipment), equipment type (inverter test, electric propulsion test, e-axle test, battery test equipment, on-board charger ATS, motor test equipment, EV drivetrain test), end market (OEM assembly plant, R&D/Technical center, authorized service center), vehicle type (commercial vehicle, passenger car), EV type (battery electric vehicle, plug-in hybrid electric vehicle, and hybrid electric vehicle), advanced technology, and region (North America, Europe, Asia Pacific, and Rest of the World). It also covers the competitive landscape and company profiles of the major players in the automotive test equipment market.
Key Benefits of Purchasing this Report
The study offers a detailed competitive analysis of the key players in the market, including their company profiles, important insights into product and business offerings, recent developments, and main market strategies. The report will assist market leaders and new entrants with estimates of revenue figures for the overall automotive test equipment market and its subsegments. It helps stakeholders understand the competitive landscape and gain additional insights to better position their businesses and develop effective go-to-market strategies. Additionally, the report provides information on key market drivers, restraints, challenges, and opportunities, helping stakeholders keep track of market dynamics.
The report provides insights into the following points:
- Analysis of key drivers (Increasing demand for specialized test systems for hybrid and EV platforms, stringent regulatory standards for automotive testing, shift toward advanced automotive testing technologies), restraints (capital-intensive infrastructure for test equipment manufacturers, in-house capability preference for automotive testing), opportunities (Test-as-a-Service and cloud-integrated virtual labs, convergence toward X-in-the-Loop (XiL) technology, localized, compact test benches for Tier-2 and mid-sized suppliers), and challenges (heterogeneous validation needs across OEMs, high complexity in ADAS and ECU co-validation, lack of standardization in battery testing protocols) influencing the growth of the automotive test equipment market
- Product Development/Innovation: Detailed insights into upcoming technologies, R&D activities, and product launches in the automotive test equipment market
- Market Development: Comprehensive information about lucrative markets (the report analyzes the automotive test equipment across various regions)
- Market Diversification: Exhaustive information about new products, untapped geographies, recent developments, and investments in the automotive test equipment market
- Competitive Assessment: In-depth assessment of market shares, growth strategies, and service offerings of leading players like AVL (Austria), Horiba, Ltd. (Japan), Robert Bosch GmbH (Germany), Phinia Inc. (US), and Illinois Tool Works Inc. (US) in the automotive test equipment market
TABLE OF CONTENTS
1 INTRODUCTION
- 1.1 STUDY OBJECTIVES
- 1.2 MARKET DEFINITION
- 1.3 STUDY SCOPE
- 1.3.1 MARKET SEGMENTATION AND REGIONAL SCOPE
- 1.3.2 INCLUSIONS AND EXCLUSIONS
- 1.4 YEARS CONSIDERED
- 1.5 CURRENCY CONSIDERED
- 1.6 STAKEHOLDERS
- 1.7 SUMMARY OF CHANGES
2 EXECUTIVE SUMMARY
3 PREMIUM INSIGHTS
- 3.1 ATTRACTIVE OPPORTUNITIES FOR PLAYERS IN AUTOMOTIVE TEST EQUIPMENT MARKET
- 3.2 AUTOMOTIVE TEST EQUIPMENT MARKET, BY EQUIPMENT
- 3.3 AUTOMOTIVE TEST EQUIPMENT MARKET, BY PROPULSION
- 3.4 AUTOMOTIVE TEST EQUIPMENT MARKET, BY VEHICLE TYPE
- 3.5 AUTOMOTIVE TEST EQUIPMENT MARKET, BY END MARKET
- 3.6 AUTOMOTIVE TEST EQUIPMENT MARKET, BY APPLICATION
- 3.7 AUTOMOTIVE TEST EQUIPMENT MARKET, BY REGION
4 MARKET OVERVIEW
- 4.1 INTRODUCTION
- 4.2 MARKET DYNAMICS
- 4.2.1 DRIVERS
- 4.2.1.1 Increasing demand for specialized test systems for hybrid and EV platforms
- 4.2.1.2 Stringent regulatory standards for automotive testing
- 4.2.1.3 Shift toward advanced automotive testing technologies
- 4.2.2 RESTRAINTS
- 4.2.2.1 Capital-intensive infrastructure for test equipment manufacturers
- 4.2.2.2 In-house capability preference for automotive testing
- 4.2.3 OPPORTUNITIES
- 4.2.3.1 Popularity of test-as-a-service and cloud-integrated virtual labs
- 4.2.3.2 Convergence toward X-in-the-Loop (XiL) technology
- 4.2.3.3 Localized, compact test benches for tier-2 and mid-sized suppliers
- 4.2.4 CHALLENGES
- 4.2.4.1 Heterogeneous validation needs across OEMs
- 4.2.4.2 High complexity in ADAS and ECU co-validation
- 4.2.4.3 Lack of standardization in battery testing protocols
- 4.2.1 DRIVERS
5 INDUSTRY TRENDS
- 5.1 SUPPLY CHAIN ANALYSIS
- 5.2 ECOSYSTEM ANALYSIS
- 5.2.1 RAW MATERIAL/COMPONENT SUPPLIERS
- 5.2.2 TEST EQUIPMENT MANUFACTURERS
- 5.2.3 TESTING SOFTWARE & SIMULATION TOOL PROVIDERS
- 5.2.4 THIRD-PARTY TESTING SERVICE PROVIDERS
- 5.2.5 END USERS
- 5.3 PRICING ANALYSIS
- 5.3.1 BY VEHICLE TYPE
- 5.3.2 BY EQUIPMENT & REGION
- 5.4 TRADE ANALYSIS
- 5.4.1 EXPORT SCENARIO (HS CODE 90318000)
- 5.4.2 IMPORT SCENARIO (HS CODE 90318000)
- 5.5 TRENDS & DISRUPTIONS IMPACTING CUSTOMER BUSINESS
- 5.6 CASE STUDY ANALYSIS
- 5.6.1 NOVELIC DEVELOPED HIGHLY PROGRAMMABLE AND CONFIGURABLE HIGH-SPEED DATA LOGGER PLATFORM TO ENABLE LOW-LATENCY DATA STREAMING
- 5.6.2 BRIGGS & STRATTON UTILIZED SIEMENS' FLEXIBLE AND INTUITIVE SIMCENTER TESTLAB SOFTWARE TO INTEGRATE SOFTWARE AND HARDWARE TESTING INTO SEAMLESS WORKFLOW
- 5.6.3 MAN TRUCK & BUS DEPLOYED VECTOR INDIGO TO OPTIMIZE DIAGNOSTIC VALIDATION AND TESTING PROCESSES
- 5.7 KEY CONFERENCES & EVENTS, 2025-2026
- 5.8 INVESTMENT & FUNDING SCENARIO
6 STRATEGIC DISRUPTION THROUGH TECHNOLOGY, PATENTS, DIGITAL, AND AI ADOPTIONS
- 6.1 TECHNOLOGY ANALYSIS
- 6.1.1 KEY TECHNOLOGIES
- 6.1.1.1 E-motor test benches
- 6.1.1.2 Battery test systems
- 6.1.2 COMPLEMENTARY TECHNOLOGIES
- 6.1.2.1 Simulation and modeling software
- 6.1.2.2 Data acquisition and analytics (DAQ & analytics)
- 6.1.3 ADJACENT TECHNOLOGIES
- 6.1.3.1 Cybersecurity testing tools
- 6.1.3.2 Autonomous driving test ecosystem
- 6.1.1 KEY TECHNOLOGIES
- 6.2 PATENT ANALYSIS
- 6.3 IMPACT OF AI/GEN AI ON AUTOMOTIVE TEST EQUIPMENT MARKET
- 6.4 AUTOMOTIVE TESTING STRATEGIES ADOPTED BY OEMS
- 6.4.1 IN-HOUSE VS. OUTSOURCED TESTING
- 6.4.2 TESTING INFRASTRUCTURE DIGITIZATION
- 6.4.3 END-OF-LINE (EOL) AUTOMATION
- 6.4.4 MODULAR AND SCALABLE TEST PLATFORMS
- 6.4.5 SOFTWARE-DEFINED VEHICLE (SDV) AND CYBERSECURITY TESTING
- 6.4.6 GLOBAL R&D-MANUFACTURING NETWORK INTEGRATION
- 6.4.7 STANDARDIZATION AND REGULATORY READINESS
- 6.4.8 PARTNERSHIP WITH TEST EQUIPMENT SUPPLIERS
- 6.4.9 SUSTAINABILITY AND ENERGY-EFFICIENT TESTING
- 6.4.10 ARTIFICIAL INTELLIGENCE (AI) AND PREDICTIVE TESTING MODELS
- 6.5 STARTUP AND SME INNOVATIONS IN AUTOMOTIVE TESTING
- 6.6 REGIONAL INVESTMENT HOTSPOTS: LOCALIZED TESTING CAPABILITIES & COST ADVANTAGES
- 6.7 CAPEX OPTIMIZATION FOR OEMS AND TIER-1 SUPPLIERS ( IN-HOUSE VS. OUTSOURCED)
- 6.8 COMPETITIVE COMPARISON MATRIX: OEM STRATEGIES IN AUTOMOTIVE TESTING
7 SUSTAINABILITY AND REGULATORY LANDSCAPE
- 7.1 REGULATORY LANDSCAPE
- 7.1.1 REGULATORY BODIES, GOVERNMENT AGENCIES, AND OTHER ORGANIZATIONS
- 7.1.2 KEY REGULATIONS, BY REGION
- 7.2 IMPACT OF GLOBAL EMISSION AND SAFETY REGULATIONS ON AUTOMOTIVE TEST EQUIPMENT
- 7.2.1 EU7, US EPA, CHINA 6: INFLUENCE ON CHASSIS DYNOS, EMISSION TESTERS, AND HOMOLOGATION EQUIPMENT
- 7.2.2 ISO 26262, UNECE R155/R156 COMPLIANCE VIA TEST EQUIPMENT
- 7.3 REQUIREMENTS FOR REGULATORY TESTING
8 CUSTOMER LANDSCAPE & BUYER BEHAVIOR
- 8.1 KEY STAKEHOLDERS AND BUYING CRITERIA
- 8.1.1 KEY STAKEHOLDERS IN BUYING PROCESS
- 8.1.2 BUYING CRITERIA
9 AUTOMOTIVE TEST EQUIPMENT MARKET, BY EQUIPMENT
- 9.1 INTRODUCTION
- 9.2 ENGINE DYNAMOMETER
- 9.2.1 RISING DEMAND FOR HIGH-PERFORMANCE ENGINES, FUEL-EFFICIENCY REGULATIONS, AND TECHNOLOGICAL ADVANCEMENTS IN HYBRID POWERTRAINS TO DRIVE MARKET
- 9.3 CHASSIS DYNAMOMETER
- 9.3.1 EXPANSION OF AUTOMOTIVE INDUSTRY IN DEVELOPING ECONOMIES TO DRIVE MARKET
- 9.4 VEHICLE EMISSION TEST SYSTEM
- 9.4.1 STRINGENT REGULATIONS, AIR QUALITY FOCUS, AND HYBRID VEHICLE ADOPTION TO DRIVE MARKET
- 9.5 WHEEL ALIGNMENT TESTER
- 9.5.1 INCREASING ADOPTION OF AUTOMATED VEHICLES AND PRECISION DRIVETRAIN TESTING TO DRIVE MARKET
- 9.6 TRANSMISSION DYNAMOMETER
- 9.6.1 HIGH VEHICLE PARC, OEM SERVICE EXPANSION, AND POWERTRAIN SHIFT TO DRIVE MARKET
- 9.7 FUEL INJECTION PUMP TESTER
- 9.7.1 ALTERNATIVE FUELS AND DIAGNOSTIC INFRASTRUCTURE IN ICE-DOMINANT REGIONS TO DRIVE MARKET
- 9.8 BATTERY TEST EQUIPMENT
- 9.8.1 ADVANCED TECHNOLOGIES AND HIGH-VOLTAGE VALIDATION TO DRIVE MARKET
- 9.9 E-MOTOR TEST EQUIPMENT
- 9.9.1 EV ADOPTION AND HIGH-VOLTAGE MOTOR ARCHITECTURES TO DRIVE MARKET
- 9.10 E-AXLE TESTING
- 9.10.1 GROWING DEMAND FOR LIFECYCLE TESTING OF E-AXLES IN FLEET AND SHARED MOBILITY EVS TO DRIVE MARKET
- 9.11 EV DRIVETRAIN TESTING
- 9.11.1 NEXT-GEN VALIDATION IN EV DRIVETRAINS TO DRIVE MARKET
- 9.12 HARDWARE-IN-THE-LOOP TESTING
- 9.12.1 FOCUS ON REAL-TIME INTERACTION BETWEEN PHYSICAL ECUS AND SIMULATED VEHICLE ENVIRONMENTS TO DRIVE MARKET
- 9.13 VEHICLE CHARGING & HIGH-VOLTAGE TEST SYSTEMS
- 9.13.1 HIGH-VOLTAGE BATTERY PACKS AND V2G CAPABILITIES IN EVS TO DRIVE MARKET
- 9.14 OTHERS
- 9.15 KEY PRIMARY INSIGHTS
10 AUTOMOTIVE TEST EQUIPMENT MARKET, BY APPLICATION
- 10.1 INTRODUCTION
- 10.2 MOBILE/TABLET-BASED EQUIPMENT
- 10.2.1 INCREASING DEMAND FOR CONNECTED VEHICLES AND EV ADOPTION IN MOBILE/TABLET-BASED TESTING TO DRIVE MARKET
- 10.3 PC/LAPTOP-BASED EQUIPMENT
- 10.3.1 HIGH COMPUTATIONAL POWER AND MULTI-SYSTEM INTEGRATION TO DRIVE MARKET
- 10.4 KEY PRIMARY INSIGHTS
11 AUTOMOTIVE TEST EQUIPMENT MARKET, BY VEHICLE TYPE
- 11.1 INTRODUCTION
- 11.1.1 COMPARISON OF TEST EQUIPMENT SPECIFICATIONS IN PASSENGER CAR AND COMMERCIAL VEHICLE
- 11.2 PASSENGER CAR
- 11.2.1 ADVANCEMENTS IN ADAS AND AUTONOMOUS DRIVING TECHNOLOGIES TO DRIVE MARKET
- 11.3 COMMERCIAL VEHICLE
- 11.3.1 INCREASING DEMAND FOR HEAVY-DUTY CHASSIS AND ENGINE DYNAMOMETERS TO DRIVE MARKET
- 11.3.2 LIGHT COMMERCIAL VEHICLE
- 11.3.3 HEAVY COMMERCIAL VEHICLE
- 11.4 KEY PRIMARY INSIGHTS
12 AUTOMOTIVE TEST EQUIPMENT MARKET, BY PROPULSION
- 12.1 INTRODUCTION
- 12.2 ICE
- 12.2.1 ADVANCEMENTS IN ENGINE TECHNOLOGIES AND STRICT EMISSION REGULATIONS TO DRIVE MARKET
- 12.3 EV
- 12.3.1 INCREASING DEMAND FOR ADVANCED BATTERY TESTING TO DRIVE MARKET
- 12.4 KEY PRIMARY INSIGHTS
13 AUTOMOTIVE TEST EQUIPMENT MARKET, BY END MARKET
- 13.1 INTRODUCTION
- 13.2 AUTHORIZED SERVICE CENTER
- 13.2.1 RISING DEMAND FOR WHEEL ALIGNMENT TESTERS TO DRIVE MARKET
- 13.3 OEM ASSEMBLY PLANT
- 13.3.1 END-OF-LINE TESTING AND OPTIMIZATION OF FACILITIES BY OEMS TO DRIVE MARKET
- 13.4 R&D/TECHNICAL CENTER
- 13.4.1 DEMAND FOR ADVANCED ADAS AND AUTONOMOUS SYSTEM TESTING TECHNOLOGIES TO DRIVE MARKET
- 13.5 KEY PRIMARY INSIGHTS
14 AUTOMOTIVE TEST EQUIPMENT MARKET, BY ADVANCED TECHNOLOGY
- 14.1 INTRODUCTION
- 14.2 ADAS TESTING
- 14.3 ECU TESTING
- 14.4 DATA LOGGER
- 14.5 SIMULATION TESTING
- 14.5.1 CRASH IMPACT SIMULATION
- 14.5.2 AUTONOMOUS DRIVING SIMULATOR
- 14.6 SENSOR TESTING
- 14.7 PERCEPTION SYSTEM TESTING
- 14.8 EDGE COMPUTING
- 14.9 V2X TESTING
15 AUTOMOTIVE TEST EQUIPMENT MARKET, BY REGION
- 15.1 INTRODUCTION
- 15.2 ASIA PACIFIC
- 15.2.1 ASIA PACIFIC: AUTOMOTIVE TEST EQUIPMENT MARKET DRIVERS
- 15.2.2 ASIA PACIFIC: MACROECONOMIC OUTLOOK
- 15.2.3 CHINA
- 15.2.3.1 Adoption of expansion strategy by OEMs to drive market
- 15.2.4 INDIA
- 15.2.4.1 Rapid expansion of authorized service centers to foster growth
- 15.2.5 JAPAN
- 15.2.5.1 Assembly plant growth and rise in R&D investments to drive market
- 15.2.6 SOUTH KOREA
- 15.2.6.1 Heavy investments in advanced battery test equipment to boost market
- 15.2.7 REST OF ASIA PACIFIC
- 15.3 EUROPE
- 15.3.1 EUROPE: AUTOMOTIVE TEST EQUIPMENT MARKET DRIVERS
- 15.3.2 EUROPE: MACROECONOMIC OUTLOOK
- 15.3.3 FRANCE
- 15.3.3.1 EV adoption, regulatory compliance, and strategic R&D investments to drive market
- 15.3.4 GERMANY
- 15.3.4.1 Investment and collaborative R&D in autonomous driving and ADAS technologies to spur demand
- 15.3.5 ITALY
- 15.3.5.1 Hybridization and export-oriented production to drive market
- 15.3.6 SPAIN
- 15.3.6.1 Emphasis on developing robust testing and quality assurance infrastructure to boost market
- 15.3.7 UK
- 15.3.7.1 Demand for electrification and R&D-driven EV testing to drive market
- 15.3.8 REST OF EUROPE
- 15.4 NORTH AMERICA
- 15.4.1 NORTH AMERICA: AUTOMOTIVE TEST EQUIPMENT MARKET DRIVERS
- 15.4.2 NORTH AMERICA: MACROECONOMIC OUTLOOK
- 15.4.3 CANADA
- 15.4.3.1 Rise in investments for connected and autonomous vehicle development to drive market
- 15.4.4 MEXICO
- 15.4.4.1 Expansion of EV manufacturing to drive market
- 15.4.5 US
- 15.4.5.1 Focus on innovation, technology, and development of high-performance, fuel-efficient vehicles to drive market
- 15.5 REST OF THE WORLD
- 15.5.1 REST OF THE WORLD: MACROECONOMIC OUTLOOK
- 15.5.2 BRAZIL
- 15.5.2.1 Heavy investments by OEMs to drive market
- 15.5.3 RUSSIA
- 15.5.3.1 Focus on developing local manufacturing centers to drive market
- 15.5.4 OTHERS
16 COMPETITIVE LANDSCAPE
- 16.1 INTRODUCTION
- 16.2 KEY PLAYER STRATEGIES/RIGHT TO WIN, 2021-2025
- 16.3 MARKET SHARE ANALYSIS, 2024
- 16.4 REVENUE ANALYSIS, 2020-2024
- 16.5 COMPANY VALUATION AND FINANCIAL METRICS
- 16.6 BRAND/PRODUCT COMPARISON
- 16.7 PRODUCTION CAPABILITIES OF AUTOMOTIVE TEST EQUIPMENT MANUFACTURERS
- 16.7.1 PHINIA INC.
- 16.7.1.1 PHINIA Inc.: Upcoming centers
- 16.7.2 SOFTING AG
- 16.7.2.1 Softing AG: Upcoming centers
- 16.7.3 ROBERT BOSCH GMBH
- 16.7.3.1 Robert Bosch GmbH: Upcoming centers
- 16.7.4 HORIBA, LTD.
- 16.7.4.1 HORIBA, Ltd.: Upcoming centers
- 16.7.5 AVL
- 16.7.5.1 AVL: Upcoming centers
- 16.7.6 SIEMENS AG
- 16.7.6.1 Siemens AG: Upcoming centers
- 16.7.7 SCHAEFFLER AG
- 16.7.7.1 Schaeffler AG: Upcoming centers
- 16.7.1 PHINIA INC.
- 16.8 COMPANY EVALUATION MATRIX: KEY PLAYERS, 2024
- 16.8.1 STARS
- 16.8.2 EMERGING LEADERS
- 16.8.3 PERVASIVE PLAYERS
- 16.8.4 PARTICIPANTS
- 16.8.5 COMPANY FOOTPRINT
- 16.8.5.1 Company footprint
- 16.8.5.2 Region footprint
- 16.8.5.3 Equipment footprint
- 16.8.5.4 Vehicle type footprint
- 16.9 COMPANY EVALUATION MATRIX: STARTUPS/SMES, 2024
- 16.9.1 PROGRESSIVE COMPANIES
- 16.9.2 RESPONSIVE COMPANIES
- 16.9.3 DYNAMIC COMPANIES
- 16.9.4 STARTING BLOCKS
- 16.9.5 COMPETITIVE BENCHMARKING
- 16.9.5.1 List of startups/SMEs
- 16.9.5.2 Competitive benchmarking of startups/SMEs
- 16.10 COMPETITIVE SCENARIO
- 16.10.1 PRODUCT LAUNCHES/DEVELOPMENTS
- 16.10.2 DEALS
- 16.10.3 EXPANSION
- 16.10.4 OTHER DEVELOPMENTS
17 COMPANY PROFILES
- 17.1 KEY PLAYERS
- 17.1.1 PHINIA INC.
- 17.1.1.1 Business overview
- 17.1.1.2 Products offered
- 17.1.1.3 Recent developments
- 17.1.1.3.1 Product launches/developments
- 17.1.1.3.2 Deals
- 17.1.1.3.3 Other developments
- 17.1.1.4 MnM view
- 17.1.1.4.1 Key strengths
- 17.1.1.4.2 Strategic choices
- 17.1.1.4.3 Weaknesses and competitive threats
- 17.1.2 ROBERT BOSCH GMBH
- 17.1.2.1 Business overview
- 17.1.2.2 Products offered
- 17.1.2.3 Recent developments
- 17.1.2.3.1 Product launches/developments
- 17.1.2.4 MnM view
- 17.1.2.4.1 Key strengths
- 17.1.2.4.2 Strategic choices
- 17.1.2.4.3 Weaknesses and competitive threats
- 17.1.3 HORIBA GROUP
- 17.1.3.1 Business overview
- 17.1.3.2 Products offered
- 17.1.3.3 Recent developments
- 17.1.3.3.1 Product launches/developments
- 17.1.3.3.2 Deals
- 17.1.3.3.3 Expansion
- 17.1.3.4 MnM view
- 17.1.3.4.1 Key strengths
- 17.1.3.4.2 Strategic choices
- 17.1.3.4.3 Weaknesses and competitive threats
- 17.1.4 AVL
- 17.1.4.1 Business overview
- 17.1.4.2 Products offered
- 17.1.4.3 Recent developments
- 17.1.4.3.1 Product launches/developments
- 17.1.4.3.2 Deals
- 17.1.4.3.3 Expansion
- 17.1.4.4 MnM view
- 17.1.4.4.1 Key strengths
- 17.1.4.4.2 Strategic choices
- 17.1.4.4.3 Weaknesses and competitive threats
- 17.1.5 ILLINOIS TOOL WORKS INC.
- 17.1.5.1 Business overview
- 17.1.5.2 Products offered
- 17.1.5.3 Recent developments
- 17.1.5.3.1 Deals
- 17.1.5.3.2 Other developments
- 17.1.5.4 MnM view
- 17.1.5.4.1 Key strengths
- 17.1.5.4.2 Strategic choices
- 17.1.5.4.3 Weaknesses and competitive threats
- 17.1.6 SIEMENS
- 17.1.6.1 Business overview
- 17.1.6.2 Products offered
- 17.1.6.3 Recent developments
- 17.1.6.3.1 Product launches/developments
- 17.1.6.3.2 Deals
- 17.1.7 DURR GROUP
- 17.1.7.1 Business overview
- 17.1.7.2 Products offered
- 17.1.7.3 Recent developments
- 17.1.7.3.1 Deals
- 17.1.7.3.2 Expansion
- 17.1.7.3.3 Other developments
- 17.1.8 CONTINENTAL AG
- 17.1.8.1 Business overview
- 17.1.8.2 Products offered
- 17.1.8.3 Recent developments
- 17.1.8.3.1 Product launches/developments
- 17.1.8.3.2 Deals
- 17.1.8.3.3 Expansion
- 17.1.8.3.4 Other developments
- 17.1.9 VECTOR INFORMATIK GMBH
- 17.1.9.1 Business overview
- 17.1.9.2 Products offered
- 17.1.9.3 Recent developments
- 17.1.9.3.1 Product launches/developments
- 17.1.9.3.2 Deals
- 17.1.10 SOFTING AG
- 17.1.10.1 Business overview
- 17.1.10.2 Products offered
- 17.1.10.3 Recent developments
- 17.1.10.3.1 Other developments
- 17.1.11 MUSTANG ADVANCED ENGINEERING
- 17.1.11.1 Business overview
- 17.1.11.2 Products offered
- 17.1.11.3 Recent developments
- 17.1.11.3.1 Product launches/developments
- 17.1.11.3.2 Deals
- 17.1.11.3.3 Expansion
- 17.1.11.3.4 Other developments
- 17.1.12 SCHAEFFLER AG
- 17.1.12.1 Business overview
- 17.1.12.2 Products offered
- 17.1.12.3 Recent developments
- 17.1.12.3.1 Other developments
- 17.1.13 MAHA MASCHINENBAU HALDENWANG GMBH & CO. KG
- 17.1.13.1 Business overview
- 17.1.13.2 Products offered
- 17.1.13.3 Recent developments
- 17.1.13.3.1 Deals
- 17.1.13.3.2 Other developments
- 17.1.14 MULLER AUTOMOTIVE
- 17.1.14.1 Business overview
- 17.1.14.2 Products offered
- 17.1.1 PHINIA INC.
- 17.2 OTHER PLAYERS
- 17.2.1 INTERTEK GROUP PLC
- 17.2.2 TUV SUD
- 17.2.3 ROHDE & SCHWARZ
- 17.2.4 SINFONIA TECHNOLOGY CO., LTD.
- 17.2.5 AMPRO TESTING MACHINES
- 17.2.6 AMETEK CTS
- 17.2.7 AUTEL INTELLIGENT TECHNOLOGY CORP., LTD.
- 17.2.8 NSM INDUSTRIAL SOLUTIONS PVT LTD
- 17.2.9 DSA DATEN- UND SYSTEMTECHNIK GMBH
- 17.2.10 IPETRONIK GMBH & CO.KG
- 17.2.11 HUFF TECHNOLOGIES
- 17.2.12 DYNO ONE INC.
- 17.2.13 DRIVE SYSTEM DESIGN
- 17.2.14 ANTHONY BEST DYNAMICS LIMITED
- 17.2.15 SAJ TEST PLANT PVT. LTD.
- 17.2.16 MAXEYE TECHNOLOGIES
- 17.2.17 NATIONAL INSTRUMENTS CORP.
18 RECOMMENDATIONS BY MARKETSANDMARKETS
- 18.1 ASIA PACIFIC TO BE LEADING GROWTH HUB FOR AUTOMOTIVE TEST EQUIPMENT
- 18.2 OEMS TO FOCUS ON IMPROVING SAFETY AND EFFICIENCY WITH MODULAR BATTERY TESTING
- 18.3 TEST EQUIPMENT MANUFACTURERS TO FOCUS ON SERVICE NETWORK MODERNIZATION
- 18.4 STRATEGIC INVESTMENTS FOR DEVELOPING EV AND AUTONOMOUS VEHICLE TESTING CAPABILITIES
- 18.5 CONCLUSION
19 APPENDIX
- 19.1 RESEARCH METHODOLOGY
- 19.1.1 RESEARCH DATA
- 19.1.2 SECONDARY DATA
- 19.1.2.1 List of secondary sources
- 19.1.2.2 Key data from secondary sources
- 19.1.3 PRIMARY DATA
- 19.1.3.1 List of primary participants
- 19.1.3.2 Primary interviewees from demand and supply sides
- 19.1.3.3 Breakdown of primary interviews
- 19.2 MARKET SIZE ESTIMATION
- 19.2.1 BOTTOM-UP APPROACH
- 19.2.2 TOP-DOWN APPROACH
- 19.3 DATA TRIANGULATION
- 19.4 FACTOR ANALYSIS
- 19.5 RISK & IMPACT ASSESSMENT
- 19.6 RESEARCH LIMITATIONS
- 19.7 DISCUSSION GUIDE
- 19.8 KNOWLEDGESTORE: MARKETSANDMARKETS' SUBSCRIPTION PORTAL
- 19.9 CUSTOMIZATION OPTIONS
- 19.10 RELATED REPORTS
- 19.11 AUTHOR DETAILS
List of Tables
- TABLE 1 MARKET DEFINITION, BY EQUIPMENT
- TABLE 2 MARKET DEFINITION, BY APPLICATION
- TABLE 3 MARKET DEFINITION, BY PROPULSION
- TABLE 4 MARKET DEFINITION, BY VEHICLE TYPE
- TABLE 5 MARKET DEFINITION, BY END MARKET
- TABLE 6 CURRENCY EXCHANGE RATES, BY COUNTRY, 2019-2024
- TABLE 7 EV TEST EQUIPMENT OFFERED BY AUTOMOTIVE TEST MANUFACTURERS
- TABLE 8 TEST EQUIPMENT REQUIRED BY REGULATORY STANDARDS
- TABLE 9 MARKET DYNAMICS: IMPACT ANALYSIS
- TABLE 10 ROLE OF COMPANIES IN MARKET ECOSYSTEM
- TABLE 11 AVERAGE SELLING PRICE OF AUTOMOTIVE TEST EQUIPMENT, BY VEHICLE TYPE, 2024
- TABLE 12 AVERAGE SELLING PRICE OF AUTOMOTIVE TEST EQUIPMENT, BY REGION, 2024
- TABLE 13 AUTOMOTIVE TEST EQUIPMENT EXPORTS, BY COUNTRY, 2020-2024 (USD MILLION)
- TABLE 14 AUTOMOTIVE TEST EQUIPMENT IMPORTS, BY COUNTRY, 2020-2024 (USD MILLION)
- TABLE 15 KEY CONFERENCES & EVENTS, 2025-2026
- TABLE 16 FUNDING DATA, BY USE CASE, 2021-2025
- TABLE 17 PATENT ANALYSIS
- TABLE 18 COMPARISON OF TESTING STRATEGIES BY OEMS
- TABLE 19 STARTUP AND SME INNOVATIONS IN AUTOMOTIVE TESTING
- TABLE 20 REGIONAL INVESTMENT HOTSPOTS: LOCALIZED TESTING CAPABILITIES & COST ADVANTAGES
- TABLE 21 CAPEX OPTIMIZATION FOR OEMS AND TIER-1 SUPPLIERS: IN-HOUSE VS. OUTSOURCED
- TABLE 22 COMPETITIVE COMPARISON MATRIX: OEM STRATEGIES IN AUTOMOTIVE TESTING
- TABLE 23 NORTH AMERICA: REGULATORY BODIES, GOVERNMENT AGENCIES, AND OTHER ORGANIZATIONS
- TABLE 24 EUROPE: REGULATORY BODIES, GOVERNMENT AGENCIES, AND OTHER ORGANIZATIONS
- TABLE 25 ASIA PACIFIC: REGULATORY BODIES, GOVERNMENT AGENCIES, AND OTHER ORGANIZATIONS
- TABLE 26 REGULATIONS/VOLUNTARY PROCEDURES FOR EV BATTERY PERFORMANCE
- TABLE 27 REGULATIONS/VOLUNTARY PROCEDURES FOR EV BATTERY DURABILITY
- TABLE 28 REGULATIONS/VOLUNTARY PROCEDURES FOR EV BATTERY SAFETY
- TABLE 29 VEHICLE TESTING REGULATIONS
- TABLE 30 ENGINE TESTING REGULATIONS
- TABLE 31 REQUIREMENTS FOR REGULATORY TESTING, BY REGION
- TABLE 32 INFLUENCE OF STAKEHOLDERS ON BUYING PROCESS FOR APPLICATIONS (%)
- TABLE 33 KEY BUYING CRITERIA, BY APPLICATION
- TABLE 34 AUTOMOTIVE TEST EQUIPMENT MARKET, BY EQUIPMENT, 2021-2024 (USD MILLION)
- TABLE 35 AUTOMOTIVE TEST EQUIPMENT MARKET, BY EQUIPMENT, 2025-2032 (USD MILLION)
- TABLE 36 ENGINE DYNAMOMETER MARKET, BY REGION, 2021-2024 (USD MILLION)
- TABLE 37 ENGINE DYNAMOMETER MARKET, BY REGION, 2025-2032 (USD MILLION)
- TABLE 38 CHASSIS DYNAMOMETER MARKET, BY REGION, 2021-2024 (USD MILLION)
- TABLE 39 CHASSIS DYNAMOMETER MARKET, BY REGION, 2025-2032 (USD MILLION)
- TABLE 40 VEHICLE EMISSION TEST SYSTEM MARKET, BY REGION, 2021-2024 (USD MILLION)
- TABLE 41 VEHICLE EMISSION TEST SYSTEM MARKET, BY REGION, 2025-2032 (USD MILLION)
- TABLE 42 WHEEL ALIGNMENT TESTER MARKET, BY REGION, 2021-2024 (USD MILLION)
- TABLE 43 WHEEL ALIGNMENT TESTER MARKET, BY REGION, 2025-2032 (USD MILLION)
- TABLE 44 TRANSMISSION DYNAMOMETER MARKET, BY REGION, 2021-2024 (USD MILLION)
- TABLE 45 TRANSMISSION DYNAMOMETER MARKET, BY REGION, 2025-2032 (USD MILLION)
- TABLE 46 FUEL INJECTOR PUMP TESTER MARKET, BY REGION, 2021-2024 (USD MILLION)
- TABLE 47 FUEL INJECTOR PUMP TESTER MARKET, BY REGION, 2025-2032 (USD MILLION)
- TABLE 48 BATTERY TEST EQUIPMENT MARKET, BY REGION, 2021-2024 (USD MILLION)
- TABLE 49 BATTERY TEST EQUIPMENT MARKET, BY REGION, 2025-2032 (USD MILLION)
- TABLE 50 E-MOTOR TEST EQUIPMENT MARKET, BY REGION, 2021-2024 (USD MILLION)
- TABLE 51 E-MOTOR TEST EQUIPMENT MARKET, BY REGION, 2025-2032 (USD MILLION)
- TABLE 52 E-AXLE TESTING EQUIPMENT MARKET, BY REGION, 2021-2024 (USD MILLION)
- TABLE 53 E-AXLE TESTING EQUIPMENT MARKET, BY REGION, 2025-2032 (USD MILLION)
- TABLE 54 EV DRIVETRAIN TEST EQUIPMENT MARKET, BY REGION, 2021-2024 (USD MILLION)
- TABLE 55 EV DRIVETRAIN TEST EQUIPMENT MARKET, BY REGION, 2025-2032 (USD MILLION)
- TABLE 56 HARDWARE-IN-THE-LOOP TEST EQUIPMENT MARKET, BY REGION, 2021-2024 (USD MILLION)
- TABLE 57 HARDWARE-IN-THE-LOOP TEST EQUIPMENT MARKET, BY REGION, 2025-2032 (USD MILLION)
- TABLE 58 VEHICLE CHARGING & HIGH-VOLTAGE TEST EQUIPMENT MARKET, BY REGION, 2021-2024 (USD MILLION)
- TABLE 59 VEHICLE CHARGING & HIGH-VOLTAGE TEST EQUIPMENT MARKET, BY REGION, 2025-2032 (USD MILLION)
- TABLE 60 OTHER AUTOMOTIVE TEST EQUIPMENT MARKET, BY REGION, 2021-2024 (USD MILLION)
- TABLE 61 OTHER AUTOMOTIVE TEST EQUIPMENT MARKET, BY REGION, 2025-2032 (USD MILLION)
- TABLE 62 AUTOMOTIVE TEST EQUIPMENT MARKET, BY APPLICATION, 2021-2024 (USD MILLION)
- TABLE 63 AUTOMOTIVE TEST EQUIPMENT MARKET, BY APPLICATION, 2025-2032 (USD MILLION)
- TABLE 64 MOBILE/TABLET-BASED EQUIPMENT, BY REGION, 2021-2024 (USD MILLION)
- TABLE 65 MOBILE/TABLET-BASED EQUIPMENT, BY REGION, 2025-2032 (USD MILLION)
- TABLE 66 PC/LAPTOP-BASED EQUIPMENT, BY REGION, 2021-2024 (USD MILLION)
- TABLE 67 PC/LAPTOP-BASED EQUIPMENT, BY REGION, 2025-2032 (USD MILLION)
- TABLE 68 TEST EQUIPMENT SPECIFICATIONS: PASSENGER CAR VS. COMMERCIAL VEHICLE
- TABLE 69 AUTOMOTIVE TEST EQUIPMENT MARKET, BY VEHICLE TYPE, 2021-2024 (USD MILLION)
- TABLE 70 AUTOMOTIVE TEST EQUIPMENT MARKET, BY VEHICLE TYPE, 2025-2032 (USD MILLION)
- TABLE 71 PASSENGER CAR TEST EQUIPMENT MARKET, BY REGION, 2021-2024 (USD MILLION)
- TABLE 72 PASSENGER CAR TEST EQUIPMENT MARKET, BY REGION, 2025-2032 (USD MILLION)
- TABLE 73 COMMERCIAL VEHICLE TEST EQUIPMENT MARKET, BY REGION, 2021-2024 (USD MILLION)
- TABLE 74 COMMERCIAL VEHICLE TEST EQUIPMENT MARKET, BY REGION, 2025-2032 (USD MILLION)
- TABLE 75 AUTOMOTIVE TEST EQUIPMENT MARKET, BY PROPULSION, 2021-2024 (USD MILLION)
- TABLE 76 AUTOMOTIVE TEST EQUIPMENT MARKET, BY PROPULSION, 2025-2032 (USD MILLION)
- TABLE 77 ICE TEST EQUIPMENT MARKET, BY REGION, 2021-2024 (USD MILLION)
- TABLE 78 ICE TEST EQUIPMENT MARKET, BY REGION, 2025-2032 (USD MILLION)
- TABLE 79 EV TEST EQUIPMENT MARKET, BY REGION, 2021-2024 (USD MILLION)
- TABLE 80 EV TEST EQUIPMENT MARKET, BY REGION, 2025-2032 (USD MILLION)
- TABLE 81 AUTOMOTIVE TEST EQUIPMENT MARKET, BY END MARKET, 2021-2024 (USD MILLION)
- TABLE 82 AUTOMOTIVE TEST EQUIPMENT MARKET, BY END MARKET, 2025-2032 (USD MILLION)
- TABLE 83 AUTHORIZED SERVICE CENTER: AUTOMOTIVE TEST EQUIPMENT MARKET, BY REGION, 2021-2024 (USD MILLION)
- TABLE 84 AUTHORIZED SERVICE CENTER: AUTOMOTIVE TEST EQUIPMENT MARKET, BY REGION, 2025-2032 (USD MILLION)
- TABLE 85 OEM ASSEMBLY PLANT: AUTOMOTIVE TEST EQUIPMENT MARKET, BY REGION, 2021-2024 (USD MILLION)
- TABLE 86 OEM ASSEMBLY PLANT: AUTOMOTIVE TEST EQUIPMENT MARKET, BY REGION, 2025-2032 (USD MILLION)
- TABLE 87 R&D/TECHNICAL CENTER: AUTOMOTIVE TEST EQUIPMENT MARKET, BY REGION, 2021-2024 (USD MILLION)
- TABLE 88 R&D/TECHNICAL CENTER: AUTOMOTIVE TEST EQUIPMENT MARKET, BY REGION, 2025-2032 (USD MILLION)
- TABLE 89 AUTOMOTIVE TEST EQUIPMENT MARKET, BY REGION, 2021-2024 (USD MILLION)
- TABLE 90 AUTOMOTIVE TEST EQUIPMENT MARKET, BY REGION, 2025-2032 (USD MILLION)
- TABLE 91 ASIA PACIFIC: AUTOMOTIVE TEST EQUIPMENT MARKET, BY COUNTRY/REGION, 2021-2024 (USD MILLION)
- TABLE 92 ASIA PACIFIC: AUTOMOTIVE TEST EQUIPMENT MARKET, BY COUNTRY/REGION, 2025-2032 (USD MILLION)
- TABLE 93 ASIA PACIFIC: AUTOMOTIVE TEST EQUIPMENT MARKET, BY PROPULSION, 2021-2024 (USD MILLION)
- TABLE 94 ASIA PACIFIC: AUTOMOTIVE TEST EQUIPMENT MARKET, BY PROPULSION, 2025-2032 (USD MILLION)
- TABLE 95 CHINA: AUTOMOTIVE TEST EQUIPMENT MARKET, BY PROPULSION, 2021-2024 (USD MILLION)
- TABLE 96 CHINA: AUTOMOTIVE TEST EQUIPMENT MARKET, BY PROPULSION, 2025-2032 (USD MILLION)
- TABLE 97 INDIA: AUTOMOTIVE TEST EQUIPMENT MARKET, BY PROPULSION, 2021-2024 (USD MILLION)
- TABLE 98 INDIA: AUTOMOTIVE TEST EQUIPMENT MARKET, BY PROPULSION, 2025-2032 (USD MILLION)
- TABLE 99 JAPAN: AUTOMOTIVE TEST EQUIPMENT MARKET, BY PROPULSION, 2021-2024 (USD MILLION)
- TABLE 100 JAPAN: AUTOMOTIVE TEST EQUIPMENT MARKET, BY PROPULSION, 2025-2032 (USD MILLION)
- TABLE 101 SOUTH KOREA: AUTOMOTIVE TEST EQUIPMENT MARKET, BY PROPULSION, 2021-2024 (USD MILLION)
- TABLE 102 SOUTH KOREA: AUTOMOTIVE TEST EQUIPMENT MARKET, BY PROPULSION, 2025-2032 (USD MILLION)
- TABLE 103 REST OF ASIA PACIFIC: AUTOMOTIVE TEST EQUIPMENT MARKET, BY PROPULSION, 2021-2024 (USD MILLION)
- TABLE 104 REST OF ASIA PACIFIC: AUTOMOTIVE TEST EQUIPMENT MARKET, BY PROPULSION, 2025-2032 (USD MILLION)
- TABLE 105 EUROPE: AUTOMOTIVE TEST EQUIPMENT MARKET, BY COUNTRY/REGION, 2021-2024 (USD MILLION)
- TABLE 106 EUROPE: AUTOMOTIVE TEST EQUIPMENT MARKET, BY COUNTRY/REGION, 2025-2032 (USD MILLION)
- TABLE 107 EUROPE: AUTOMOTIVE TEST EQUIPMENT MARKET, BY PROPULSION, 2021-2024 (USD MILLION)
- TABLE 108 EUROPE: AUTOMOTIVE TEST EQUIPMENT MARKET, BY PROPULSION, 2025-2032 (USD MILLION)
- TABLE 109 FRANCE: AUTOMOTIVE TEST EQUIPMENT MARKET, BY PROPULSION, 2021-2024 (USD MILLION)
- TABLE 110 FRANCE: AUTOMOTIVE TEST EQUIPMENT MARKET, BY PROPULSION, 2025-2032 (USD MILLION)
- TABLE 111 GERMANY: AUTOMOTIVE TEST EQUIPMENT MARKET, BY PROPULSION, 2021-2024 (USD MILLION)
- TABLE 112 GERMANY: AUTOMOTIVE TEST EQUIPMENT MARKET, BY PROPULSION, 2025-2032 (USD MILLION)
- TABLE 113 ITALY: AUTOMOTIVE TEST EQUIPMENT MARKET, BY PROPULSION, 2021-2024 (USD MILLION)
- TABLE 114 ITALY: AUTOMOTIVE TEST EQUIPMENT MARKET, BY PROPULSION, 2025-2032 (USD MILLION)
- TABLE 115 SPAIN: AUTOMOTIVE TEST EQUIPMENT MARKET, BY PROPULSION, 2021-2024 (USD MILLION)
- TABLE 116 SPAIN: AUTOMOTIVE TEST EQUIPMENT MARKET, BY PROPULSION, 2025-2032 (USD MILLION)
- TABLE 117 UK: AUTOMOTIVE TEST EQUIPMENT MARKET, BY PROPULSION, 2021-2024 (USD MILLION)
- TABLE 118 UK: AUTOMOTIVE TEST EQUIPMENT MARKET, BY PROPULSION, 2025-2032 (USD MILLION)
- TABLE 119 REST OF EUROPE: AUTOMOTIVE TEST EQUIPMENT MARKET, BY PROPULSION, 2021-2024 (USD MILLION)
- TABLE 120 REST OF EUROPE: AUTOMOTIVE TEST EQUIPMENT MARKET, BY PROPULSION, 2025-2032 (USD MILLION)
- TABLE 121 NORTH AMERICA: AUTOMOTIVE TEST EQUIPMENT MARKET, BY COUNTRY, 2021-2024 (USD MILLION)
- TABLE 122 NORTH AMERICA: AUTOMOTIVE TEST EQUIPMENT MARKET, BY COUNTRY, 2025-2032 (USD MILLION)
- TABLE 123 NORTH AMERICA: AUTOMOTIVE TEST EQUIPMENT MARKET, BY PROPULSION, 2021-2024 (USD MILLION)
- TABLE 124 NORTH AMERICA: AUTOMOTIVE TEST EQUIPMENT MARKET, BY PROPULSION, 2025-2032 (USD MILLION)
- TABLE 125 CANADA: AUTOMOTIVE TEST EQUIPMENT MARKET, BY PROPULSION, 2021-2024 (USD MILLION)
- TABLE 126 CANADA: AUTOMOTIVE TEST EQUIPMENT MARKET, BY PROPULSION, 2025-2032 (USD MILLION)
- TABLE 127 MEXICO: AUTOMOTIVE TEST EQUIPMENT MARKET, BY PROPULSION, 2021-2024 (USD MILLION)
- TABLE 128 MEXICO: AUTOMOTIVE TEST EQUIPMENT MARKET, BY PROPULSION, 2025-2032 (USD MILLION)
- TABLE 129 US: AUTOMOTIVE TEST EQUIPMENT MARKET, BY PROPULSION, 2021-2024 (USD MILLION)
- TABLE 130 US: AUTOMOTIVE TEST EQUIPMENT MARKET, BY PROPULSION, 2025-2032 (USD MILLION)
- TABLE 131 REST OF THE WORLD: AUTOMOTIVE TEST EQUIPMENT MARKET, BY COUNTRY, 2021-2024 (USD MILLION)
- TABLE 132 REST OF THE WORLD: AUTOMOTIVE TEST EQUIPMENT MARKET, BY COUNTRY, 2025-2032 (USD MILLION)
- TABLE 133 BRAZIL: AUTOMOTIVE TEST EQUIPMENT MARKET, BY PROPULSION, 2021-2024 (USD MILLION)
- TABLE 134 BRAZIL: AUTOMOTIVE TEST EQUIPMENT MARKET, BY PROPULSION, 2025-2032 (USD MILLION)
- TABLE 135 RUSSIA: AUTOMOTIVE TEST EQUIPMENT MARKET, BY PROPULSION, 2021-2024 (USD MILLION)
- TABLE 136 RUSSIA: AUTOMOTIVE TEST EQUIPMENT MARKET, BY PROPULSION, 2025-2032 (USD MILLION)
- TABLE 137 OTHERS: AUTOMOTIVE TEST EQUIPMENT MARKET, BY PROPULSION, 2021-2024 (USD MILLION)
- TABLE 138 OTHERS: AUTOMOTIVE TEST EQUIPMENT MARKET, BY PROPULSION, 2025-2032 (USD MILLION)
- TABLE 139 KEY PLAYER STRATEGIES/RIGHT TO WIN, 2021-2025
- TABLE 140 AUTOMOTIVE TEST EQUIPMENT (MANUFACTURERS) MARKET: DEGREE OF COMPETITION, 2024
- TABLE 141 PHINIA INC.: END MARKETS (OEM ASSEMBLY PLANT, R&D/TECHNICAL CENTER, AUTHORIZED SERVICE CENTER)
- TABLE 142 SOFTING AG: END MARKETS (OEM ASSEMBLY PLANT, R&D/TECHNICAL CENTER, AUTHORIZED SERVICE CENTER)
- TABLE 143 ROBERT BOSCH GMBH: END MARKETS (OEM ASSEMBLY PLANT, R&D/TECHNICAL CENTER, AUTHORIZED SERVICE CENTER)
- TABLE 144 HORIBA, LTD.: END MARKETS (OEM ASSEMBLY PLANT, R&D/TECHNICAL CENTER, AUTHORIZED SERVICE CENTER)
- TABLE 145 AVL: END MARKETS (OEM ASSEMBLY PLANT, R&D/TECHNICAL CENTER, AUTHORIZED SERVICE CENTER)
- TABLE 146 SIEMENS AG: END MARKETS (OEM ASSEMBLY PLANT, R&D/TECHNICAL CENTER, AUTHORIZED SERVICE CENTER)
- TABLE 147 SCHAEFFLER AG: END MARKETS (OEM ASSEMBLY PLANT, R&D/TECHNICAL CENTER, AUTHORIZED SERVICE CENTER)
- TABLE 148 AUTOMOTIVE TEST EQUIPMENT MARKET: REGION FOOTPRINT
- TABLE 149 AUTOMOTIVE TEST EQUIPMENT MARKET: EQUIPMENT FOOTPRINT
- TABLE 150 AUTOMOTIVE TEST EQUIPMENT MARKET: VEHICLE TYPE FOOTPRINT
- TABLE 151 AUTOMOTIVE TEST EQUIPMENT MARKET: KEY STARTUPS/SMES
- TABLE 152 AUTOMOTIVE TEST EQUIPMENT MARKET: COMPETITIVE BENCHMARKING OF KEY STARTUPS/SMES
- TABLE 153 AUTOMOTIVE TEST EQUIPMENT MARKET: PRODUCT LAUNCHES/ DEVELOPMENTS JANUARY 2021-JULY 2025
- TABLE 154 AUTOMOTIVE TEST EQUIPMENT MARKET: DEALS, JANUARY 2021-JULY 2025
- TABLE 155 AUTOMOTIVE TEST EQUIPMENT MARKET: EXPANSION, JANUARY 2021-JULY 2025
- TABLE 156 AUTOMOTIVE TEST EQUIPMENT MARKET: OTHER DEVELOPMENTS, JANUARY 2021-JULY 2025
- TABLE 157 PHINIA INC.: COMPANY OVERVIEW
- TABLE 158 PHINIA INC.: PRODUCTS OFFERED
- TABLE 159 PHINIA INC.: PRODUCT LAUNCHES/DEVELOPMENTS
- TABLE 160 PHINIA INC.: DEALS
- TABLE 161 PHINIA INC.: OTHER DEVELOPMENTS
- TABLE 162 ROBERT BOSCH GMBH: COMPANY OVERVIEW
- TABLE 163 ROBERT BOSCH GMBH: PRODUCTS OFFERED
- TABLE 164 ROBERT BOSCH GMBH: PRODUCT LAUNCHES/DEVELOPMENTS
- TABLE 165 HORIBA GROUP: COMPANY OVERVIEW
- TABLE 166 HORIBA GROUP: PRODUCTS OFFERED
- TABLE 167 HORIBA GROUP: PRODUCT LAUNCHES/DEVELOPMENTS
- TABLE 168 HORIBA GROUP: DEALS
- TABLE 169 HORIBA GROUP: EXPANSION
- TABLE 170 AVL: COMPANY OVERVIEW
- TABLE 171 AVL: PRODUCTS OFFERED
- TABLE 172 AVL: PRODUCT LAUNCHES/DEVELOPMENTS
- TABLE 173 AVL: DEALS
- TABLE 174 AVL: EXPANSION
- TABLE 175 ILLINOIS TOOL WORKS INC.: COMPANY OVERVIEW
- TABLE 176 ILLINOIS TOOL WORKS INC.: PRODUCTS OFFERED
- TABLE 177 ILLINOIS TOOL WORKS INC.: DEALS
- TABLE 178 ILLINOIS TOOL WORKS INC.: OTHER DEVELOPMENTS
- TABLE 179 SIEMENS: COMPANY OVERVIEW
- TABLE 180 SIEMENS: PRODUCTS OFFERED
- TABLE 181 SIEMENS: PRODUCT LAUNCHES/DEVELOPMENTS
- TABLE 182 SIEMENS: DEALS
- TABLE 183 DURR GROUP: COMPANY OVERVIEW
- TABLE 184 DURR GROUP: PRODUCTS OFFERED
- TABLE 185 DURR GROUP: DEALS
- TABLE 186 DURR GROUP: EXPANSION
- TABLE 187 DURR GROUP: OTHER DEVELOPMENTS
- TABLE 188 CONTINENTAL AG: COMPANY OVERVIEW
- TABLE 189 CONTINENTAL AG: PRODUCTS OFFERED
- TABLE 190 CONTINENTAL AG: PRODUCT LAUNCHES/DEVELOPMENTS
- TABLE 191 CONTINENTAL AG: DEALS
- TABLE 192 CONTINENTAL AG: EXPANSION
- TABLE 193 CONTINENTAL AG: OTHER DEVELOPMENTS
- TABLE 194 VECTOR INFORMATIK GMBH: COMPANY OVERVIEW
- TABLE 195 VECTOR INFORMATIK GMBH: PRODUCTS OFFERED
- TABLE 196 VECTOR INFORMATIK GMBH: PRODUCT LAUNCHES/DEVELOPMENTS
- TABLE 197 VECTOR INFORMATIK GMBH: DEALS
- TABLE 198 SOFTING AG: COMPANY OVERVIEW
- TABLE 199 SOFTING AG: PRODUCTS OFFERED
- TABLE 200 SOFTING AG: OTHER DEVELOPMENTS
- TABLE 201 MUSTANG ADVANCED ENGINEERING: COMPANY OVERVIEW
- TABLE 202 MUSTANG ADVANCED ENGINEERING: PRODUCTS OFFERED
- TABLE 203 MUSTANG ADVANCED ENGINEERING: PRODUCT LAUNCHES/DEVELOPMENTS
- TABLE 204 MUSTANG ADVANCED ENGINEERING: DEALS
- TABLE 205 MUSTANG ADVANCED ENGINEERING: EXPANSION
- TABLE 206 MUSTANG ADVANCED ENGINEERING: OTHER DEVELOPMENTS
- TABLE 207 SCHAEFFLER AG: COMPANY OVERVIEW
- TABLE 208 SCHAEFFLER AG: PRODUCTS OFFERED
- TABLE 209 SCHAEFFLER AG: OTHER DEVELOPMENTS
- TABLE 210 MAHA MASCHINENBAU HALDENWANG GMBH & CO. KG: COMPANY OVERVIEW
- TABLE 211 MAHA MASCHINENBAU HALDENWANG GMBH & CO. KG: PRODUCTS OFFERED
- TABLE 212 MAHA MASCHINENBAU HALDENWANG GMBH & CO. KG: DEALS
- TABLE 213 MAHA MASCHINENBAU HALDENWANG GMBH & CO. KG: OTHER DEVELOPMENTS
- TABLE 214 MULLER AUTOMOTIVE: COMPANY OVERVIEW
- TABLE 215 MULLER AUTOMOTIVE: PRODUCTS OFFERED
- TABLE 216 INTERTEK GROUP PLC: COMPANY OVERVIEW
- TABLE 217 TUV SUD: COMPANY OVERVIEW
- TABLE 218 ROHDE & SCHWARZ: COMPANY OVERVIEW
- TABLE 219 SINFONIA TECHNOLOGY CO., LTD.: COMPANY OVERVIEW
- TABLE 220 AMPRO TESTING MACHINES: COMPANY OVERVIEW
- TABLE 221 AMETEK CTS: COMPANY OVERVIEW
- TABLE 222 AUTEL INTELLIGENT TECHNOLOGY CORP., LTD.: COMPANY OVERVIEW
- TABLE 223 NSM INDUSTRIAL SOLUTIONS PVT LTD: COMPANY OVERVIEW
- TABLE 224 DSA DATEN- UND SYSTEMTECHNIK GMBH: COMPANY OVERVIEW
- TABLE 225 IPETRONIK GMBH & CO.KG: COMPANY OVERVIEW
- TABLE 226 HUFF TECHNOLOGIES: COMPANY OVERVIEW
- TABLE 227 DYNO ONE INC.: COMPANY OVERVIEW
- TABLE 228 DRIVE SYSTEM DESIGN: COMPANY OVERVIEW
- TABLE 229 ANTHONY BEST DYNAMICS LIMITED: COMPANY OVERVIEW
- TABLE 230 SAJ TEST PLANT PVT. LTD.: COMPANY OVERVIEW
- TABLE 231 MAXEYE TECHNOLOGIES: COMPANY OVERVIEW
- TABLE 232 NATIONAL INSTRUMENTS CORP.: COMPANY OVERVIEW
- TABLE 233 RISK & IMPACT ASSESSMENT
List of Figures
- FIGURE 1 AUTOMOTIVE TEST EQUIPMENT MARKET OVERVIEW
- FIGURE 2 AUTOMOTIVE TEST EQUIPMENT MARKET, BY PROPULSION, 2025 VS. 2032 (USD MILLION)
- FIGURE 3 AUTOMOTIVE TEST EQUIPMENT MARKET, BY REGION, 2025 VS. 2032 (USD MILLION)
- FIGURE 4 AUTOMOTIVE TEST EQUIPMENT MARKET, BY EQUIPMENT,
025 VS. 2032 (USD MILLION)
- FIGURE 5 KEY PLAYERS IN AUTOMOTIVE TEST EQUIPMENT MARKET
- FIGURE 6 RISING INTEGRATION OF ADVANCED TESTING TECHNOLOGIES INTO EVS TO DRIVE MARKET
- FIGURE 7 WHEEL ALIGNMENT TESTER SEGMENT TO LEAD MARKET DURING FORECAST PERIOD
- FIGURE 8 ICE SEGMENT TO LEAD MARKET DURING FORECAST PERIOD
- FIGURE 9 PASSENGER CAR SEGMENT TO LEAD MARKET DURING FORECAST PERIOD
- FIGURE 10 R&D/TECHNICAL CENTER SEGMENT TO ACHIEVE HIGHEST GROWTH DURING FORECAST PERIOD
- FIGURE 11 PC/LAPTOP-BASED EQUIPMENT SEGMENT TO LEAD MARKET DURING FORECAST PERIOD
- FIGURE 12 ASIA PACIFIC TO BE LARGEST MARKET FOR AUTOMOTIVE TEST EQUIPMENT DURING FORECAST PERIOD
- FIGURE 13 AUTOMOTIVE TEST EQUIPMENT: DRIVERS, RESTRAINTS, OPPORTUNITIES, AND CHALLENGES
- FIGURE 14 SUPPLY CHAIN ANALYSIS
- FIGURE 15 ECOSYSTEM ANALYSIS
- FIGURE 16 AUTOMOTIVE TEST EQUIPMENT EXPORTS, BY COUNTRY, 2020-2024 (USD MILLION)
- FIGURE 17 AUTOMOTIVE TEST EQUIPMENT IMPORTS, BY COUNTRY, 2020-2024 (USD MILLION)
- FIGURE 18 TRENDS & DISRUPTIONS IMPACTING CUSTOMER BUSINESS
- FIGURE 19 INVESTMENT SCENARIO, 2021-2025
- FIGURE 20 PATENT APPLICANTS, 2015-2024
- FIGURE 21 INFLUENCE OF STAKEHOLDERS ON BUYING PROCESS FOR APPLICATIONS
- FIGURE 22 KEY BUYING CRITERIA, BY APPLICATION
- FIGURE 23 AUTOMOTIVE TEST EQUIPMENT MARKET, BY EQUIPMENT, 2025 VS. 2032 (USD MILLION)
- FIGURE 24 AUTOMOTIVE TEST EQUIPMENT MARKET, BY APPLICATION, 2025 VS. 2032 (USD MILLION)
- FIGURE 25 AUTOMOTIVE TEST EQUIPMENT MARKET, BY VEHICLE TYPE, 2025 VS. 2032 (USD MILLION)
- FIGURE 26 AUTOMOTIVE TEST EQUIPMENT MARKET, BY PROPULSION, 2025 VS. 2032 (USD MILLION)
- FIGURE 27 AUTOMOTIVE TEST EQUIPMENT MARKET, BY END MARKET, 2025 VS. 2032 (USD MILLION)
- FIGURE 28 AUTOMOTIVE TEST EQUIPMENT MARKET, BY REGION, 2025 VS. 2032 (USD MILLION)
- FIGURE 29 ASIA PACIFIC: AUTOMOTIVE TEST EQUIPMENT MARKET SNAPSHOT
- FIGURE 30 ASIA PACIFIC: REAL GDP GROWTH RATE, BY COUNTRY, 2024-2026
- FIGURE 31 ASIA PACIFIC: GDP PER CAPITA, BY COUNTRY, 2024-2026
- FIGURE 32 ASIA PACIFIC: INFLATION RATE AVERAGE CONSUMER PRICES, BY COUNTRY, 2024-2026
- FIGURE 33 ASIA PACIFIC: MANUFACTURING INDUSTRY'S CONTRIBUTION TO GDP, 2024 (USD TRILLION)
- FIGURE 34 EUROPE: AUTOMOTIVE TEST EQUIPMENT MARKET, 2025 VS. 2032 (USD MILLION)
- FIGURE 35 EUROPE: REAL GDP GROWTH RATE, BY COUNTRY, 2024-2026
- FIGURE 36 EUROPE: GDP PER CAPITA, BY COUNTRY, 2024-2026
- FIGURE 37 EUROPE: INFLATION RATE AVERAGE CONSUMER PRICES, BY COUNTRY, 2024-2026
- FIGURE 38 EUROPE: MANUFACTURING INDUSTRY'S CONTRIBUTION TO GDP, 2024 (USD TRILLION)
- FIGURE 39 NORTH AMERICA: AUTOMOTIVE TEST EQUIPMENT MARKET SNAPSHOT
- FIGURE 40 NORTH AMERICA: REAL GDP GROWTH RATE, BY COUNTRY, 2024-2026
- FIGURE 41 NORTH AMERICA: GDP PER CAPITA, BY COUNTRY, 2024-2026
- FIGURE 42 NORTH AMERICA: INFLATION RATE AVERAGE CONSUMER PRICES, BY COUNTRY, 2023-2026
- FIGURE 43 NORTH AMERICA MANUFACTURING INDUSTRY'S CONTRIBUTION TO GDP, 2024 (USD TRILLION)
- FIGURE 44 REST OF THE WORLD: AUTOMOTIVE TEST EQUIPMENT MARKET, BY COUNTRY, 2025 VS. 2032 (USD MILLION)
- FIGURE 45 REST OF THE WORLD: REAL GDP GROWTH RATE, 2025-2026
- FIGURE 46 REST OF THE WORLD: GDP PER CAPITA, 2024-2026
- FIGURE 47 REST OF THE WORLD: INFLATION RATE AVERAGE CONSUMER PRICES, 2024-2026
- FIGURE 48 REST OF THE WORLD: MANUFACTURING INDUSTRY'S CONTRIBUTION TO GDP (USD TRILLION)
- FIGURE 49 AUTOMOTIVE TEST EQUIPMENT (MANUFACTURERS) MARKET: DEGREE OF COMPETITION, 2024
- FIGURE 50 REVENUE ANALYSIS OF KEY PLAYERS, 2020-2024 (USD BILLION)
- FIGURE 51 COMPANY VALUATION OF KEY PLAYERS, 2024
- FIGURE 52 FINANCIAL METRICS OF KEY PLAYERS, 2024
- FIGURE 53 BRAND/PRODUCT COMPARISON
- FIGURE 54 AUTOMOTIVE TEST EQUIPMENT MARKET: COMPANY EVALUATION MATRIX (KEY PLAYERS), 2024
- FIGURE 55 AUTOMOTIVE TEST EQUIPMENT MARKET: COMPANY FOOTPRINT
- FIGURE 56 AUTOMOTIVE TEST EQUIPMENT MARKET: COMPANY EVALUATION MATRIX (STARTUPS/SMES), 2024
- FIGURE 57 PHINIA INC.: COMPANY SNAPSHOT
- FIGURE 58 ROBERT BOSCH GMBH: COMPANY SNAPSHOT
- FIGURE 59 HORIBA GROUP: COMPANY SNAPSHOT
- FIGURE 60 ILLINOIS TOOL WORKS INC.: COMPANY SNAPSHOT
- FIGURE 61 SIEMENS: COMPANY SNAPSHOT
- FIGURE 62 DURR GROUP: COMPANY SNAPSHOT
- FIGURE 63 CONTINENTAL AG: COMPANY SNAPSHOT
- FIGURE 64 SOFTING AG: COMPANY SNAPSHOT
- FIGURE 65 SCHAEFFLER AG: COMPANY SNAPSHOT
- FIGURE 66 RESEARCH DESIGN
- FIGURE 67 RESEARCH DESIGN MODEL
- FIGURE 68 INSIGHTS FROM INDUSTRY EXPERTS
- FIGURE 69 BREAKDOWN OF PRIMARY INTERVIEWS
- FIGURE 70 MARKET SIZE ESTIMATION METHODOLOGY: BOTTOM-UP APPROACH
- FIGURE 71 MARKET SIZE ESTIMATION METHODOLOGY: TOP-DOWN APPROACH
- FIGURE 72 DATA TRIANGULATION
- FIGURE 73 FACTOR ANALYSIS FOR MARKET SIZING: DEMAND AND SUPPLY SIDES

