
PUBLISHER: MarketsandMarkets | PRODUCT CODE: 1863601

PUBLISHER: MarketsandMarkets | PRODUCT CODE: 1863601
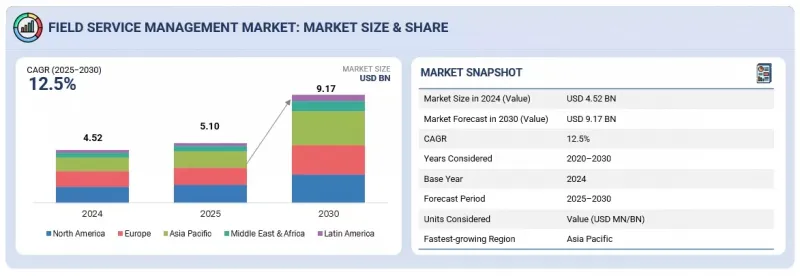
Field Service Management Market by Solutions, Deployment mode, Organization Size, Vertical and Region - Global Forecast to 2030
The field service management market is expanding rapidly, with a projected market size anticipated to rise from about USD 5.10 billion in 2025 to USD 9.17 billion by 2030, featuring a CAGR of 12.5%. The market is expanding rapidly, driven by companies prioritizing operational efficiency, customer satisfaction, and digital transformation across the telecom, manufacturing, and logistics industries.
| Scope of the Report | |
|---|---|
| Years Considered for the Study | 2020-2030 |
| Base Year | 2024 |
| Forecast Period | 2025-2030 |
| Units Considered | USD Billion |
| Segments | By Offering, By Deployment Mode, By Organization Size, By Vertical |
| Regions covered | North America, Europe, Asia Pacific, Middle East & Africa, Latin America |
Modern FSM platforms optimize workforce efficiency, enhance customer experience, and enable seamless integration with cloud, AI, and IoT technologies to support end-to-end service excellence. Key factors include the adoption of cloud-based platforms and automation, real-time tracking, predictive maintenance, and mobile workforce management, which collectively improve scheduling, asset utilization, and service quality.
The integration of advanced technologies, such as AI, IoT, and analytics, enables improved technician productivity and data-driven decision-making, while regulatory compliance and rising customer expectations further accelerate the adoption of field service management solutions. However, the market faces significant restraints, including persistent workforce skill shortages, integration issues with legacy infrastructure, and data security concerns within cloud environments. These challenges increase training and onboarding costs and may slow the pace of technology adoption for some organizations, requiring sustained focus on workforce development and secure digital transformation.
"In deployment mode, Cloud is expected to account for the fastest growth rate during the forecast period"
Cloud technology is a key driver behind the rapid growth of the field service management market due to its inherent scalability, flexibility, and ability to provide real-time data access. Cloud-based FSM solutions enable seamless collaboration among technicians, customers, and back-office teams regardless of location, optimizing scheduling, dispatching, and inventory management through centralized digital platforms. Cloud facilitates integration with complementary enterprise systems such as ERP and CRM, enhancing operational efficiency and ensuring a cohesive workflow.
Additionally, advancements in IoT, AI, and mobile connectivity supported by cloud infrastructure empower predictive maintenance and intelligent resource allocation, reducing downtime and improving first-time fix rates. Cloud FSM platforms also enhance customer experience by supporting self-service portals and real-time service tracking. Security and compliance features are critical components, ensuring the protection of sensitive data across distributed environments. Cloud technology supports continuous innovation and adaptability in FSM, providing organizations with a competitive advantage as they streamline operations and respond to evolving customer expectations in a cost-effective manner.
"By offering, solutions segment is expected to hold the largest market share during the forecast period"
By offering, solutions that hold the largest market share are known for simplifying and improving how companies manage on-field operations. These solutions help schedule jobs, track technicians, manage inventories, and automate service requests efficiently. Oracle, Microsoft, Salesforce, and SAP provide cloud-based platforms that are easy to access and scale. They also integrate well with other business tools such as CRM and ERP systems to keep workflows smooth and data consistent.
Additionally, these solutions use smart technologies such as artificial intelligence and IoT to predict issues and optimize work, which enhances service speed and quality. Their user-friendly interfaces and robust security features cater to the diverse needs of various industries, making them reliable choices. Companies offering flexible pricing and customizable features support businesses in adapting FSM to their specific needs.
"North America leads the field service management market with strong adoption of cloud-based solutions, while Asia Pacific is the fastest-growing region driven by rapid digital transformation"
North America is expected to dominate the field service management market, driven by the growing enterprise demand for real-time visibility, automation, and enhanced customer engagement. The region's advanced digital infrastructure and early adoption of AI, IoT, and analytics-based FSM platforms enable organizations to optimize scheduling, dispatch, and predictive maintenance operations. For solution providers, this creates opportunities to deliver scalable and integrated platforms across various industries, including utilities, manufacturing, telecommunications, and healthcare.
In contrast, Asia Pacific is witnessing accelerated FSM growth due to the increasing adoption of cloud-based deployment models, expanding mobile connectivity, and government programs supporting digital service modernization. Strategic collaborations between technology vendors and regional enterprises are fostering efficient field operations, data-driven decision-making, and improved service delivery models. Capitalizing on these advancements enables FSM providers to enhance workforce productivity, reduce operational costs, and meet the evolving expectations of customers across diverse industries.
Breakdown of Primaries
In-depth interviews were conducted with Chief Executive Officers (CEOs), innovation and technology directors, system integrators, and executives from various key organizations operating in the field service management market.
- By Company: Tier I - 46%, Tier II - 16%, and Tier III - 38%
- By Designation: C-Level Executives - 32%, D-Level Executives -42%, and Others - 26%
- By Region: North America - 40%, Europe - 33%, Asia Pacific - 17%, and Rest of the world - 10%
The report includes a study of key players offering field service management. It profiles major vendors in the field service management market. The major market players include Oracle (US), Microsoft (US), Salesforce (US), IFS (Sweden), SAP SE (Germany), Infor (US), Trimble (US), Comarch (Poland), Syncron (Sweden), PTC (US), ServicePower (UK), OverIT (Italy), FieldAware (US), Zinier (US), Accruent (US), Praxedo (France), Fielde (US), FieldEdge (US), Jobber (Canada), ServiceM8 (Australia), Kickserv(US), Pegasystems (US), Skedulo(US), Service Fusion(US), Husky Intelligence (Finland), FieldPulse (US), Dassault Systems (France), and Workiz(US).
Research Coverage
This research report categorizes the field service management market based on based on Offering (solutions (scheduling, dispatch, & route optimization, work order management, customer management, reporting & analytics, inventory management , Service Contract Management and Other Solutions), Services (consulting, integration & implementation, training & support), Deployment Mode (on-premises and cloud), Organization Size (large enterprises and SMEs), Vertical (manufacturing, transportation & logistics, construction & real estate, healthcare & life sciences, energy & utilities, telecom, IT & ITES, oil & gas, other verticals and Region (North America, Europe, Asia Pacific, Middle East & Africa, and Latin America). The report's scope encompasses detailed information regarding the major factors, including drivers, restraints, challenges, and opportunities, that influence the growth of the field service management market. A detailed analysis of key industry players was conducted to provide insights into their business overview, solutions, and services, as well as key strategies, contracts, partnerships, agreements, new product & service launches, mergers and acquisitions, and recent developments associated with the field service management market. This report also includes a competitive analysis of emerging startups in the field service management market ecosystem.
Reason to Buy this Report
The report would provide market leaders and new entrants with information on the closest approximations of the revenue numbers for the overall field service management market and its subsegments. It would help stakeholders understand the competitive landscape and gain more insights to better position their businesses and plan suitable go-to-market strategies. It also helps stakeholders understand the market's pulse and provides them with information on key market drivers, restraints, challenges, and opportunities.
The report provides insights into the following points:
- Analysis of key drivers (Acceleration of Cloud-based deployment models; Increasing focus on customer experience and satisfaction; Rising adoption of mobile based FSM solutions), restraints (Talent shortage and workforce skill gaps; Resistance from field technicians to adopt new digital tools), opportunities (Integration with ERP and CRM systems; Use of augmented reality and remote assistance in field service; Providing industry-specific customized solutions), and challenges (Complexity of managing multi-vendor and multi-system environment; Integration challenges with legacy IT systems)
- Product Development/Innovation: Detailed insights on upcoming technologies, research & development activities, and new product & service launches in the field service management market
- Market Development: Comprehensive information about lucrative markets - analysis of the field service management market across varied regions
- Market Diversification: Exhaustive information about new products & services, untapped geographies, recent developments, and investments in the field of service management market
- Competitive Assessment: In-depth assessment of market shares, growth strategies and service offerings of leading players such as Oracle (US), Microsoft (US), Salesforce (US), IFS (Sweden), SAP SE (Germany), Infor (US), Trimble (US), Comarch (Poland), Syncron (Sweden), PTC (US), ServicePower (UK), OverIT (Italy), FieldAware (US), Zinier (US), Accruent (US), Praxedo (France), Fielde (US), FieldEdge (US), Jobber (Canada), ServiceM8 (Australia), Kickserv(US), Pegasystems (US), Skedulo(US), Service Fusion(US), Husky Intelligence (Finland), FieldPulse (US), Dassault Systems (France) and Workiz(US). The report also helps stakeholders understand the field service management market, providing information on key market drivers, restraints, challenges, and opportunities
TABLE OF CONTENTS
1 INTRODUCTION
- 1.1 STUDY OBJECTIVES
- 1.2 MARKET DEFINITION
- 1.3 STUDY SCOPE
- 1.3.1 MARKET SEGMENTATION AND REGIONAL SCOPE
- 1.3.2 INCLUSIONS AND EXCLUSIONS
- 1.3.3 YEARS CONSIDERED
- 1.3.4 CURRENCY CONSIDERED
- 1.4 STAKEHOLDERS
- 1.5 SUMMARY OF STRATEGIC CHANGE IN MARKET
2 EXECUTIVE SUMMARY
- 2.1 KEY INSIGHTS AND MARKET HIGHLIGHTS
- 2.2 KEY MARKET PARTICIPANTS: SHARE INSIGHTS AND STRATEGIC DEVELOPMENTS
- 2.3 DISRUPTIVE TRENDS SHAPING MARKET
- 2.4 HIGH-GROWTH SEGMENTS AND EMERGING FRONTIERS
- 2.5 SNAPSHOT: GLOBAL MARKET SIZE, GROWTH RATE, AND FORECAST
3 PREMIUM INSIGHTS
- 3.1 ATTRACTIVE OPPORTUNITIES FOR PLAYERS IN FIELD SERVICE MANAGEMENT MARKET
- 3.2 FIELD SERVICE MANAGEMENT MARKET, BY OFFERING
- 3.3 FIELD SERVICE MANAGEMENT MARKET, BY ORGANIZATION SIZE
- 3.4 FIELD SERVICE MANAGEMENT MARKET, BY VERTICAL
- 3.5 FIELD SERVICE MANAGEMENT MARKET, BY REGION
4 MARKET OVERVIEW AND INDUSTRY TRENDS
- 4.1 INTRODUCTION
- 4.2 MARKET DYNAMICS
- 4.2.1 DRIVERS
- 4.2.1.1 Acceleration of cloud-based deployment models
- 4.2.1.2 Increasing focus on customer experience and satisfaction
- 4.2.1.3 Rising adoption of mobile-based FSM solutions
- 4.2.2 RESTRAINTS
- 4.2.2.1 Talent shortage and workforce skill gaps
- 4.2.2.2 Resistance from field technicians to adopt new digital tools
- 4.2.3 OPPORTUNITIES
- 4.2.3.1 Integration with ERP and CRM systems
- 4.2.3.2 Use of augmented reality and remote assistance in field service
- 4.2.3.3 Providing industry-specific customized solutions
- 4.2.4 CHALLENGES
- 4.2.4.1 Complexity of managing multi-vendor and multi-system environments
- 4.2.4.2 Integration challenges with legacy IT systems
- 4.2.1 DRIVERS
- 4.3 BOTTOM OF FORM UNMET NEEDS AND WHITE SPACES
- 4.3.1 UNMET NEEDS IN FIELD SERVICE MANAGEMENT MARKET
- 4.3.2 WHITE SPACE OPPORTUNITIES
- 4.4 INTERCONNECTED MARKETS AND CROSS-SECTOR OPPORTUNITIES
- 4.4.1 INTERCONNECTED MARKETS
- 4.4.2 CROSS-SECTOR OPPORTUNITIES
- 4.5 EMERGING BUSINESS MODELS AND ECOSYSTEM SHIFTS
- 4.5.1 EMERGING BUSINESS MODELS
- 4.5.2 ECOSYSTEM SHIFTS
- 4.6 STRATEGIC MOVES BY TIER-1/2/3 PLAYERS
- 4.7 PORTER'S FIVE FORCES ANALYSIS
- 4.7.1 THREAT OF NEW ENTRANTS
- 4.7.2 THREAT OF SUBSTITUTES
- 4.7.3 BARGAINING POWER OF SUPPLIERS
- 4.7.4 BARGAINING POWER OF BUYERS
- 4.7.5 INTENSITY OF COMPETITIVE RIVALRY
- 4.8 MACROECONOMICS INDICATORS
- 4.8.1 INTRODUCTION
- 4.8.2 GDP TRENDS AND FORECAST
- 4.8.3 TRENDS IN GLOBAL ICT INDUSTRY
- 4.9 SUPPLY CHAIN ANALYSIS
- 4.10 ECOSYSTEM ANALYSIS
- 4.11 PRICING ANALYSIS
- 4.11.1 AVERAGE SELLING PRICE TREND OF FIELD SERVICE MANAGEMENT, BY REGION, 2022-2024
- 4.11.2 INDICATIVE PRICING FOR KEY PLAYERS, BY FIELD SERVICE MANAGEMENT SOLUTIONS, 2025
- 4.12 KEY CONFERENCES AND EVENTS, 2025-2026
- 4.13 TRENDS/DISRUPTIONS IMPACTING CUSTOMER BUSINESS
- 4.14 INVESTMENT & FUNDING SCENARIO
- 4.15 CASE STUDY ANALYSIS
- 4.15.1 CASE STUDY 1: ENABLING SCALABLE, FLEXIBLE FIELD & REVERSE-LOGISTICS SERVICE FOR RETAIL SUPPORT
- 4.15.2 CASE STUDY 2: SCALING FIELD SERVICE FOR RENEWABLE ENERGY THROUGH INTELLIGENT SCHEDULING & MOBILE ENABLEMENT
- 4.15.3 CASE STUDY 3: DIGITALIZING FIELD EXECUTION & DATA COLLECTION FOR SERVICE EXCELLENCE
- 4.15.4 CASE STUDY 4: TRANSFORMING FIELD SERVICE EFFICIENCY: WESTMOR INDUSTRIES' JOURNEY TO DIGITAL EXCELLENCE
- 4.15.5 CASE STUDY 5: NETLINE'S TRANSFORMATION: ENHANCING CUSTOMER EXPERIENCE WITH ZINIER'S UNIFIED FIELD SERVICE PLATFORM
- 4.16 IMPACT OF 2025 US TARIFF - FIELD SERVICE MANAGEMENT MARKET
- 4.16.1 INTRODUCTION
- 4.16.2 KEY TARIFF RATES
- 4.16.3 PRICE IMPACT ANALYSIS
- 4.16.4 IMPACT ON COUNTRY/REGION
- 4.16.4.1 North America
- 4.16.4.1.1 US
- 4.16.4.1.2 Canada
- 4.16.4.1.3 Mexico
- 4.16.4.2 Europe
- 4.16.4.2.1 Germany
- 4.16.4.2.2 France
- 4.16.4.2.3 UK
- 4.16.4.3 Asia Pacific
- 4.16.4.3.1 China
- 4.16.4.3.2 India
- 4.16.4.1 North America
5 STRATEGIC DISRUPTIONS: PATENTS, DIGITAL, AND AI ADOPTION
- 5.1 KEY EMERGING TECHNOLOGIES
- 5.1.1 ARTIFICIAL INTELLIGENCE & MACHINE LEARNING (AI/ML)
- 5.1.2 MOBILE COMPUTING & APPLICATION PLATFORMS
- 5.1.3 CLOUD COMPUTING AND SAAS PLATFORM
- 5.2 COMPLEMENTARY TECHNOLOGIES
- 5.2.1 IOT AND TELEMATICS
- 5.2.2 GIS & LOCATING INTELLIGENCE
- 5.2.3 CRM & ERP INTEGRATIONS
- 5.3 TECHNOLOGY/PRODUCT ROADMAP
- 5.3.1 SHORT-TERM (2025-2027) | FOUNDATIONAL DIGITIZATION
- 5.3.2 MID-TERM (2027-2030) | INTELLIGENT INTEGRATION
- 5.3.3 LONG-TERM (2030-2035+) | AUTONOMOUS OPERATIONS
- 5.4 PATENT ANALYSIS
- 5.4.1 LIST OF MAJOR PATENTS
- 5.5 IMPACT OF AI/GEN AI ON FIELD SERVICE MANAGEMENT MARKET
- 5.5.1 CASE STUDY
- 5.5.1.1 Use Case 1: Waters Delivers Trusted Partnerships Through Quality Field Service Outcomes
- 5.5.2 VENDOR INITIATIVES
- 5.5.2.1 Salesforce
- 5.5.2.2 PTC (ServiceMax)
- 5.5.3 BEST PRACTICES
- 5.5.4 INTERCONNECTED ADJACENT ECOSYSTEM AND IMPACT ON MARKET PLAYERS
- 5.5.5 CLIENT READINESS
- 5.5.1 CASE STUDY
6 REGULATORY LANDSCAPE
- 6.1 INTRODUCTION
- 6.2 REGIONAL REGULATIONS AND COMPLIANCE
- 6.2.1 REGULATORY BODIES, GOVERNMENT AGENCIES, AND OTHER ORGANIZATIONS
- 6.2.2 REGULATIONS BY REGION
- 6.2.2.1 North America
- 6.2.2.2 Europe
- 6.2.2.3 Asia Pacific
- 6.2.2.4 Middle East & South Africa
- 6.2.2.5 Latin America
- 6.2.3 INDUSTRY STANDARDS
- 6.2.3.1 General Data Protection Regulation
- 6.2.3.2 SEC Rule 17a-4
- 6.2.3.3 ISO/IEC 27001
- 6.2.3.4 System and Organization Controls 2 Type II
- 6.2.3.5 Financial Industry Regulatory Authority
- 6.2.3.6 Health Insurance Portability and Accountability Act
7 CUSTOMER LANDSCAPE & BUYING BEHAVIOR
- 7.1 DECISION-MAKING PROCESS
- 7.2 BUYER STAKEHOLDERS AND BUYING EVALUATION CRITERIA
- 7.3 BUYING CRITERIA
- 7.4 ADOPTION BARRIERS & INTERNAL CHALLENGES
- 7.5 UNMET NEEDS IN VARIOUS END-USE INDUSTRIES
8 FIELD SERVICE MANAGEMENT MARKET, BY OFFERING
- 8.1 INTRODUCTION
- 8.1.1 OFFERING: FIELD SERVICE MANAGEMENT MARKET DRIVERS
- 8.2 SOLUTIONS
- 8.2.1 SCHEDULING, DISPATCH, & ROUTE OPTIMIZATION
- 8.2.1.1 Enhancing workforce efficiency through intelligent scheduling
- 8.2.1.2 Automated Scheduling & Workforce Planning
- 8.2.1.3 Field Resource Optimization
- 8.2.1.4 Predictive Scheduling
- 8.2.2 WORK ORDER MANAGEMENT
- 8.2.2.1 Streamlining operations with automated workflows to ensure accurate service execution
- 8.2.2.2 Work Order Creation & Tracking
- 8.2.2.3 Job Assignment & Workflow Automation
- 8.2.3 CUSTOMER MANAGEMENT
- 8.2.3.1 Elevating customer experience through connected engagement
- 8.2.3.2 Proactive Customer Communication and Appointment Management
- 8.2.3.3 Personalized Service History and Predictive Maintenance
- 8.2.4 REPORTING & ANALYTICS
- 8.2.4.1 Driving data-backed decisions with real-time insights
- 8.2.4.2 Data Visualization & BI Integration
- 8.2.4.3 Performance Dashboards
- 8.2.5 INVENTORY MANAGEMENT
- 8.2.5.1 Optimizing spare parts and asset availability for service delivery of consumables
- 8.2.5.2 Stock Reconciliation & Audit
- 8.2.5.3 Integration with Procurement Systems
- 8.2.6 SERVICE CONTRACT MANAGEMENT
- 8.2.6.1 Maximizing service value through contract automation systematic handling of customer agreements
- 8.2.6.2 Field Technician Inventory Tracking
- 8.2.6.3 Automatic Reordering and Alerts
- 8.2.7 OTHERS
- 8.2.1 SCHEDULING, DISPATCH, & ROUTE OPTIMIZATION
- 8.3 SERVICES
- 8.3.1 CONSULTING
- 8.3.1.1 Guiding strategic transformation through expert consulting
- 8.3.2 INTEGRATION & IMPLEMENTATION
- 8.3.2.1 Accelerating deployment with seamless system integration
- 8.3.3 TRAINING & SUPPORT
- 8.3.3.1 Empowering users through continuous training and support
- 8.3.1 CONSULTING
9 FIELD SERVICE MANAGEMENT MARKET, BY DEPLOYMENT MODE
- 9.1 INTRODUCTION
- 9.1.1 DEPLOYMENT MODE: FIELD SERVICE MANAGEMENT MARKET DRIVERS
- 9.2 ON PREMISES
- 9.2.1 STRENGTHENING CONTROL WITH SECURE ON-PREMISE DEPLOYMENT
- 9.3 CLOUD
- 9.3.1 DRIVING AGILITY AND SCALABILITY THROUGH CLOUD-BASED DEPLOYMENT
10 FIELD SERVICE MANAGEMENT MARKET, BY ORGANIZATION SIZE
- 10.1 INTRODUCTION
- 10.1.1 ORGANIZATION SIZE: FIELD SERVICE MANAGEMENT MARKET DRIVERS
- 10.2 LARGE ENTERPRISES
- 10.2.1 ENHANCING OPERATIONAL EXCELLENCE IN LARGE-SCALE ENTERPRISES
- 10.3 SMES
- 10.3.1 ENABLING GROWTH AND EFFICIENCY FOR SMALL AND MEDIUM ENTERPRISES
11 FIELD SERVICE MANAGEMENT MARKET, BY VERTICAL
- 11.1 INTRODUCTION
- 11.1.1 VERTICAL: FIELD SERVICE MANAGEMENT MARKET DRIVERS
- 11.2 MANUFACTURING
- 11.2.1 OPTIMIZING PRODUCTION UPTIME THROUGH INTELLIGENT FIELD OPERATIONS
- 11.2.2 MANUFACTURING: APPLICATION AREAS
- 11.2.2.1 Asset Tracking
- 11.2.2.2 Inventory Management
- 11.2.2.3 Workforce Management
- 11.2.2.4 Others (Quality Control and Field Service Operations)
- 11.3 TRANSPORTATION & LOGISTICS
- 11.3.1 STREAMLINING FLEET AND DELIVERY EFFICIENCY WITH FSM SOLUTIONS
- 11.3.2 TRANSPORTATION & LOGISTICS: APPLICATION AREAS
- 11.3.2.1 Fleet Management
- 11.3.2.2 Route Optimization
- 11.3.2.3 Workforce Management
- 11.3.2.4 Inventory & Warehouse Management
- 11.4 CONSTRUCTION & REAL ESTATE
- 11.4.1 DRIVING PROJECT EFFICIENCY WITH CONNECTED FIELD OPERATIONS TO IMPROVE WORKFORCE PRODUCTIVITY
- 11.4.2 CONSTRUCTION & REAL ESTATE: APPLICATION AREAS
- 11.4.2.1 Work Order Management
- 11.4.2.2 Job Scheduling & Dispatch
- 11.4.2.3 Project Scheduling & Planning
- 11.4.2.4 Equipment & Asset Management
- 11.5 HEALTHCARE & LIFE SCIENCES
- 11.5.1 ENSURING EQUIPMENT UPTIME AND COMPLIANCE IN CRITICAL ENVIRONMENTS
- 11.5.2 HEALTHCARE & LIFE SCIENCES: APPLICATION AREAS
- 11.5.2.1 Medical Equipment Maintenance
- 11.5.2.2 Patient Care Services
- 11.5.2.3 Remote Patient Monitoring
- 11.5.2.4 Pharmaceutical Logistics
- 11.6 ENERGY & UTILITIES
- 11.6.1 EMPOWERING RELIABLE SERVICE DELIVERY THROUGH SMART FIELD MANAGEMENT
- 11.6.2 ENERGY & UTILITIES: APPLICATION AREAS
- 11.6.2.1 Asset Maintenance & Management
- 11.6.2.2 Field Workforce Management
- 11.6.2.3 Compliance & Audits
- 11.6.2.4 Grid Maintenance & Operations
- 11.7 TELECOMMUNICATION
- 11.7.1 IMPROVING NETWORK MAINTENANCE THROUGH AUTOMATED FIELD COORDINATION
- 11.7.2 TELECOMMUNICATIONS: APPLICATION AREAS
- 11.7.2.1 Equipment Configuration & Optimization
- 11.7.2.2 Workforce Scheduling & Dispatch
- 11.7.2.3 Inventory Management
- 11.7.2.4 Customer Service & On-site Support
- 11.7.2.5 Compliance & Regulatory Management
- 11.8 IT & ITES
- 11.8.1 DELIVERING SEAMLESS TECH SUPPORT THROUGH INTELLIGENT SERVICE AUTOMATION
- 11.8.2 IT & ITES: APPLICATION AREAS
- 11.8.2.1 Asset Tracking & Inventory Management
- 11.8.2.2 Software Deployment & Updates
- 11.8.2.3 Emergency Response & Disaster Recovery
- 11.8.2.4 Data Center Support
- 11.9 OIL & GAS
- 11.9.1 ENHANCING ASSET RELIABILITY THROUGH PREDICTIVE FIELD SERVICE MANAGEMENT
- 11.9.2 OIL & GAS: APPLICATION AREAS
- 11.9.2.1 Asset Maintenance & Management
- 11.9.2.2 Field Inspection & Audits
- 11.9.2.3 Health, Safety, & Environmental Compliance
- 11.10 OTHER VERTICALS
12 FIELD SERVICE MANAGEMENT MARKET, BY REGION
- 12.1 INTRODUCTION
- 12.2 NORTH AMERICA
- 12.2.1 US
- 12.2.1.1 Adoption of IoT connectivity to boost demand for field service management
- 12.2.2 CANADA
- 12.2.2.1 Government-driven digital modernization to accelerate FSM adoption
- 12.2.1 US
- 12.3 EUROPE
- 12.3.1 UK
- 12.3.1.1 Adoption of 5G connectivity to accelerate digital transformation and operational efficiency in field service management
- 12.3.2 GERMANY
- 12.3.2.1 Rising electric vehicle production to fuel demand for advanced field service management solutions
- 12.3.3 FRANCE
- 12.3.3.1 Renewable energy expansion to accelerate adoption of service management solutions
- 12.3.4 ITALY
- 12.3.4.1 Expansion of hydropower infrastructure to drive demand for advanced field service management solutions
- 12.3.5 REST OF EUROPE
- 12.3.1 UK
- 12.4 ASIA PACIFIC
- 12.4.1 CHINA
- 12.4.1.1 Driving FSM growth through expanding industrial automation landscape to boost demand
- 12.4.2 JAPAN
- 12.4.2.1 Adoption of industrial automation and robotics to accelerate FSM deployment
- 12.4.3 INDIA
- 12.4.3.1 Data privacy regulations to propel demand for secure field service management
- 12.4.4 REST OF ASIA PACIFIC
- 12.4.1 CHINA
- 12.5 MIDDLE EAST & AFRICA
- 12.5.1 GULF COOPERATION COUNCIL
- 12.5.1.1 UAE
- 12.5.1.1.1 Empowering smart infrastructure with advanced FSM solutions
- 12.5.1.2 Kingdom of Saudi Arabia
- 12.5.1.2.1 Expanding 5G coverage to drive market
- 12.5.1.3 Rest of Gulf Cooperation Council (GCC) Countries
- 12.5.1.1 UAE
- 12.5.2 SOUTH AFRICA
- 12.5.2.1 Enhancing growth through rising internet penetration to drive market
- 12.5.3 REST OF MIDDLE EAST & AFRICA
- 12.5.1 GULF COOPERATION COUNCIL
- 12.6 LATIN AMERICA
- 12.6.1 BRAZIL
- 12.6.1.1 Expanding mobile internet connectivity to fuel technology-driven efficiency
- 12.6.2 MEXICO
- 12.6.2.1 Expanding internet connectivity to accelerate digital transformation and IoT-driven field service management
- 12.6.3 REST OF LATIN AMERICA
- 12.6.1 BRAZIL
13 COMPETITIVE LANDSCAPE
- 13.1 INTRODUCTION
- 13.2 KEY PLAYER STRATEGIES/RIGHT TO WIN, 2023-2025
- 13.3 REVENUE ANALYSIS, 2020-2024
- 13.4 MARKET SHARE ANALYSIS, 2024
- 13.5 PRODUCT COMPARISON
- 13.5.1 SAP
- 13.5.2 ORACLE
- 13.5.3 MICROSOFT
- 13.5.4 IFS
- 13.5.5 SALESFORCE
- 13.6 COMPANY EVALUATION MATRIX: KEY PLAYERS, 2024
- 13.6.1 STARS
- 13.6.2 EMERGING LEADERS
- 13.6.3 PERVASIVE PLAYERS
- 13.6.4 PARTICIPANTS
- 13.6.5 COMPANY FOOTPRINT: KEY PLAYERS, 2024
- 13.6.5.1 Company footprint
- 13.6.5.2 Region footprint
- 13.6.5.3 Offering footprint
- 13.6.5.4 Vertical footprint
- 13.7 COMPANY EVALUATION MATRIX: STARTUPS/SMES, 2024
- 13.7.1 PROGRESSIVE COMPANIES
- 13.7.2 RESPONSIVE COMPANIES
- 13.7.3 DYNAMIC COMPANIES
- 13.7.4 STARTING BLOCKS
- 13.7.5 COMPETITIVE BENCHMARKING: STARTUP/SMES, 2024
- 13.7.5.1 Detailed list of key startups/SMEs
- 13.7.5.2 Competitive benchmarking of key startups/SMEs
- 13.8 COMPANY VALUATION AND FINANCIAL METRICS
- 13.8.1 COMPANY VALUATION OF KEY VENDORS
- 13.8.2 FINANCIAL METRICS OF KEY VENDORS
- 13.9 COMPETITIVE SCENARIO
- 13.9.1 PRODUCT LAUNCHES
- 13.9.2 DEALS
14 COMPANY PROFILES
- 14.1 INTRODUCTION
- 14.2 KEY PLAYERS
- 14.2.1 ORACLE
- 14.2.1.1 Business overview
- 14.2.1.2 Products/Solutions/Services offered
- 14.2.1.3 Recent developments
- 14.2.1.3.1 Product launches
- 14.2.1.3.2 Deals
- 14.2.1.4 MnM view
- 14.2.1.4.1 Right to win
- 14.2.1.4.2 Strategic choices
- 14.2.1.4.3 Weaknesses and competitive threats
- 14.2.2 MICROSOFT
- 14.2.2.1 Business overview
- 14.2.2.2 Products/Solutions/Services offered
- 14.2.2.3 Recent developments
- 14.2.2.3.1 Product launches
- 14.2.2.4 MnM view
- 14.2.2.4.1 Right to win
- 14.2.2.4.2 Strategic choices
- 14.2.2.4.3 Weaknesses and competitive threats
- 14.2.3 SALESFORCE
- 14.2.3.1 Business overview
- 14.2.3.2 Products/Solutions/Services offered
- 14.2.3.3 Recent developments
- 14.2.3.3.1 Product launches
- 14.2.3.3.2 Deals
- 14.2.3.4 MnM view
- 14.2.3.4.1 Right to win
- 14.2.3.4.2 Strategic choices
- 14.2.3.4.3 Weaknesses and competitive threats
- 14.2.4 IFS
- 14.2.4.1 Business overview
- 14.2.4.2 Products/Solutions/Services offered
- 14.2.4.3 Recent developments
- 14.2.4.3.1 Deals
- 14.2.4.4 MnM view
- 14.2.4.4.1 Right to win
- 14.2.4.4.2 Strategic choices
- 14.2.4.4.3 Weaknesses and competitive threats
- 14.2.5 SAP
- 14.2.5.1 Business overview
- 14.2.5.2 Products/Solutions/Services offered
- 14.2.5.3 Recent developments
- 14.2.5.3.1 Product launches
- 14.2.5.3.2 Deals
- 14.2.5.4 MnM view
- 14.2.5.4.1 Right to win
- 14.2.5.4.2 Strategic choices
- 14.2.5.4.3 Weaknesses and competitive threats
- 14.2.6 INFOR
- 14.2.6.1 Business overview
- 14.2.6.2 Products/Solutions/Services offered
- 14.2.7 TRIMBLE
- 14.2.7.1 Business overview
- 14.2.7.2 Products/Solutions/Services offered
- 14.2.7.3 Recent developments
- 14.2.7.3.1 Product launches
- 14.2.8 COMARCH
- 14.2.8.1 Business overview
- 14.2.8.2 Products/Solutions/Services offered
- 14.2.8.2.1 Deals
- 14.2.9 OVERIT
- 14.2.9.1 Business overview
- 14.2.9.2 Products/Solutions/Services offered
- 14.2.9.3 Recent developments
- 14.2.9.3.1 Product launches and enhancements
- 14.2.9.3.2 Deals
- 14.2.10 PTC
- 14.2.10.1 Business overview
- 14.2.10.2 Products/Solutions/Services offered
- 14.2.10.3 Recent developments
- 14.2.10.3.1 Product launches and enhancements
- 14.2.10.3.2 Deals
- 14.2.1 ORACLE
- 14.3 OTHER PLAYERS
- 14.3.1 SERVICEPOWER
- 14.3.2 SYNCRON
- 14.3.3 FIELDAWARE
- 14.3.4 ZINIER
- 14.3.5 ACCRUENT
- 14.3.6 PRAXEDO
- 14.3.7 FIELDEZ
- 14.3.8 FIELDEDGE
- 14.3.9 JOBBER
- 14.3.10 SERVICETITAN
- 14.3.11 PEGASYSTEMS
- 14.3.12 SKEDULO
- 14.3.13 SERVICE FUSION
- 14.3.14 HUSKY INTELLIGENCE
- 14.3.15 FIELDPULSE
- 14.3.16 WORKIZ
- 14.3.17 KICKSERV
- 14.3.18 DASSAULT SYSTEMS
15 RESEARCH METHODOLOGY
- 15.1 RESEARCH APPROACH
- 15.1.1 SECONDARY DATA
- 15.1.1.1 Key data from secondary sources
- 15.1.2 PRIMARY DATA
- 15.1.2.1 Key data from primary sources
- 15.1.2.2 Breakup of primary profiles
- 15.1.2.3 Key industry insights
- 15.1.1 SECONDARY DATA
- 15.2 MARKET BREAKUP AND DATA TRIANGULATION
- 15.3 MARKET SIZE ESTIMATION
- 15.3.1 TOP-DOWN APPROACH
- 15.3.2 BOTTOM-UP APPROACH
- 15.3.3 MARKET ESTIMATION APPROACHES
- 15.4 MARKET FORECAST
- 15.5 RESEARCH ASSUMPTIONS
- 15.6 RESEARCH LIMITATIONS
16 ADJACENT AND RELATED MARKETS
- 16.1 INTRODUCTION
- 16.1.1 RELATED MARKETS
- 16.1.2 LIMITATIONS
- 16.2 WORK FORCE MANAGEMENT MARKET
- 16.3 WORK ORDER MANAGEMENT SYSTEMS MARKET
17 APPENDIX
- 17.1 DISCUSSION GUIDE
- 17.2 KNOWLEDGESTORE: MARKETSANDMARKETS' SUBSCRIPTION PORTAL
- 17.3 CUSTOMIZATION OPTIONS
- 17.4 RELATED REPORTS
- 17.5 AUTHOR DETAILS
List of Tables
- TABLE 1 USD EXCHANGE RATES, 2019-2024
- TABLE 2 PORTER'S FIVE FORCES ANALYSIS: FIELD SERVICE MANAGEMENT MARKET
- TABLE 3 GDP PERCENTAGE CHANGE, BY KEY COUNTRIES, 2021-2029
- TABLE 4 ROLES OF COMPANIES IN ECOSYSTEM
- TABLE 5 INDICATIVE PRICING OF KEY PLAYERS, BY SOLUTION, 2025
- TABLE 6 FIELD SERVICE MANAGEMENT MARKET: KEY CONFERENCES AND EVENTS, 2025-2026
- TABLE 7 US ADJUSTED RECIPROCAL TARIFF RATES
- TABLE 8 EXPECTED CHANGE IN PRICES AND LIKELY IMPACT ON END END-USER MARKET DUE TO TARIFF IMPACT
- TABLE 9 LIST OF MAJOR PATENTS
- TABLE 10 INTERCONNECTED ADJACENT ECOSYSTEM AND IMPACT ON MARKET PLAYERS
- TABLE 11 NORTH AMERICA: REGULATORY BODIES, GOVERNMENT AGENCIES, AND OTHER ORGANIZATIONS
- TABLE 12 EUROPE: REGULATORY BODIES, GOVERNMENT AGENCIES, AND OTHER ORGANIZATIONS
- TABLE 13 ASIA PACIFIC: REGULATORY BODIES, GOVERNMENT AGENCIES, AND OTHER ORGANIZATIONS
- TABLE 14 REST OF WORLD: REGULATORY BODIES, GOVERNMENT AGENCIES, AND OTHER ORGANIZATIONS
- TABLE 15 INFLUENCE OF STAKEHOLDERS ON BUYING PROCESS FOR KEY VERTICALS
- TABLE 16 KEY BUYING CRITERIA FOR TOP THREE VERTICALS
- TABLE 17 FIELD SERVICE MANAGEMENT MARKET: UNMET NEEDS IN KEY END-USE INDUSTRIES
- TABLE 18 FIELD SERVICE MANAGEMENT MARKET, BY OFFERING, 2020-2024 (USD MILLION)
- TABLE 19 FIELD SERVICE MANAGEMENT MARKET, BY OFFERING, 2025-2030 (USD MILLION)
- TABLE 20 FIELD SERVICE MANAGEMENT MARKET, BY SOLUTION, 2020-2024 (USD MILLION)
- TABLE 21 FIELD SERVICE MANAGEMENT MARKET, BY SOLUTION, 2025-2030 (USD MILLION)
- TABLE 22 SOLUTIONS: FIELD SERVICE MANAGEMENT MARKET, BY REGION, 2020-2024 (USD MILLION)
- TABLE 23 SOLUTIONS: FIELD SERVICE MANAGEMENT MARKET, BY REGION, 2025-2030 (USD MILLION)
- TABLE 24 SCHEDULING, DISPATCH, & ROUTE OPTIMIZATION: FIELD SERVICE MANAGEMENT MARKET, BY REGION, 2020-2024 (USD MILLION)
- TABLE 25 SCHEDULING, DISPATCH, & ROUTE OPTIMIZATION: FIELD SERVICE MANAGEMENT MARKET, BY REGION, 2025-2030 (USD MILLION)
- TABLE 26 WORK ORDER MANAGEMENT: FIELD SERVICE MANAGEMENT MARKET, BY REGION, 2020-2024 (USD MILLION)
- TABLE 27 WORK ORDER MANAGEMENT: FIELD SERVICE MANAGEMENT MARKET, BY REGION, 2025-2030 (USD MILLION)
- TABLE 28 CUSTOMER MANAGEMENT: FIELD SERVICE MANAGEMENT MARKET, BY REGION, 2020-2024 (USD MILLION)
- TABLE 29 CUSTOMER MANAGEMENT: FIELD SERVICE MANAGEMENT MARKET, BY REGION, 2025-2030 (USD MILLION)
- TABLE 30 REPORTING & ANALYTICS: FIELD SERVICE MANAGEMENT MARKET, BY REGION, 2020-2024 (USD MILLION)
- TABLE 31 REPORTING & ANALYTICS: FIELD SERVICE MANAGEMENT MARKET, BY REGION, 2025-2030 (USD MILLION)
- TABLE 32 INVENTORY MANAGEMENT: FIELD SERVICE MANAGEMENT MARKET, BY REGION, 2020-2024 (USD MILLION)
- TABLE 33 INVENTORY MANAGEMENT: FIELD SERVICE MANAGEMENT MARKET, BY REGION, 2025-2030 (USD MILLION)
- TABLE 34 SERVICE CONTRACT MANAGEMENT: FIELD SERVICE MANAGEMENT MARKET, BY REGION, 2020-2024 (USD MILLION)
- TABLE 35 SERVICE CONTRACT MANAGEMENT: FIELD SERVICE MANAGEMENT MARKET, BY REGION, 2025-2030 (USD MILLION)
- TABLE 36 OTHERS: FIELD SERVICE MANAGEMENT MARKET, BY REGION, 2020-2024 (USD MILLION)
- TABLE 37 OTHERS: FIELD SERVICE MANAGEMENT MARKET, BY REGION, 2025-2030 (USD MILLION)
- TABLE 38 FIELD SERVICE MANAGEMENT MARKET, BY SERVICES, 2020-2024 (USD MILLION)
- TABLE 39 FIELD SERVICE MANAGEMENT MARKET, BY SERVICES, 2025-2030 (USD MILLION)
- TABLE 40 SERVICES: FIELD SERVICE MANAGEMENT MARKET, BY REGION, 2020-2024 (USD MILLION)
- TABLE 41 SERVICES: FIELD SERVICE MANAGEMENT MARKET, BY REGION, 2025-2030 (USD MILLION)
- TABLE 42 CONSULTING: FIELD SERVICE MANAGEMENT MARKET, BY REGION, 2020-2024 (USD MILLION)
- TABLE 43 CONSULTING: FIELD SERVICE MANAGEMENT MARKET, BY REGION, 2025-2030 (USD MILLION)
- TABLE 44 INTEGRATION & IMPLEMENTATION: FIELD SERVICE MANAGEMENT MARKET, BY REGION, 2020-2024 (USD MILLION)
- TABLE 45 INTEGRATION & IMPLEMENTATION: FIELD SERVICE MANAGEMENT MARKET, BY REGION, 2025-2030 (USD MILLION)
- TABLE 46 TRAINING & SUPPORT: FIELD SERVICE MANAGEMENT MARKET, BY REGION, 2020-2024 (USD MILLION)
- TABLE 47 TRAINING & SUPPORT: FIELD SERVICE MANAGEMENT MARKET, BY REGION, 2025-2030 (USD MILLION)
- TABLE 48 FIELD SERVICE MANAGEMENT MARKET, BY DEPLOYMENT MODE, 2020-2024 (USD MILLION)
- TABLE 49 FIELD SERVICE MANAGEMENT MARKET, BY DEPLOYMENT MODE, 2025-2030 (USD MILLION)
- TABLE 50 ON-PREMISES: FIELD SERVICE MANAGEMENT MARKET, BY REGION, 2020-2024 (USD MILLION)
- TABLE 51 ON-PREMISES: FIELD SERVICE MANAGEMENT MARKET, BY REGION, 2025-2030 (USD MILLION)
- TABLE 52 CLOUD: FIELD SERVICE MANAGEMENT MARKET, BY REGION, 2020-2024 (USD MILLION)
- TABLE 53 CLOUD: FIELD SERVICE MANAGEMENT MARKET, BY REGION, 2025-2030 (USD MILLION)
- TABLE 54 FIELD SERVICE MANAGEMENT MARKET, BY ORGANIZATION SIZE, 2020-2024 (USD MILLION)
- TABLE 55 FIELD SERVICE MANAGEMENT MARKET, BY ORGANIZATION SIZE, 2025-2030 (USD MILLION)
- TABLE 56 LARGE ENTERPRISES: FIELD SERVICE MANAGEMENT MARKET, BY REGION, 2020-2024 (USD MILLION)
- TABLE 57 LARGE ENTERPRISES: FIELD SERVICE MANAGEMENT MARKET, BY REGION, 2025-2030 (USD MILLION)
- TABLE 58 SMES: FIELD SERVICE MANAGEMENT MARKET, BY REGION, 2020-2024 (USD MILLION)
- TABLE 59 SMES: FIELD SERVICE MANAGEMENT MARKET, BY REGION, 2025-2030 (USD MILLION)
- TABLE 60 FIELD SERVICE MANAGEMENT MARKET, BY VERTICAL, 2020-2024 (USD MILLION)
- TABLE 61 FIELD SERVICE MANAGEMENT MARKET, BY VERTICAL, 2025-2030 (USD MILLION)
- TABLE 62 MANUFACTURING: FIELD SERVICE MANAGEMENT MARKET, BY REGION, 2020-2024 (USD MILLION)
- TABLE 63 MANUFACTURING: FIELD SERVICE MANAGEMENT MARKET, BY REGION, 2025-2030 (USD MILLION)
- TABLE 64 TRANSPORTATION & LOGISTICS: FIELD SERVICE MANAGEMENT MARKET, BY REGION, 2020-2024 (USD MILLION)
- TABLE 65 TRANSPORTATION & LOGISTICS: FIELD SERVICE MANAGEMENT MARKET, BY REGION, 2025-2030 (USD MILLION)
- TABLE 66 CONSTRUCTION & REAL ESTATE: FIELD SERVICE MANAGEMENT MARKET, BY REGION, 2020-2024 (USD MILLION)
- TABLE 67 CONSTRUCTION & REAL ESTATE: FIELD SERVICE MANAGEMENT MARKET, BY REGION, 2025-2030 (USD MILLION)
- TABLE 68 HEALTHCARE & LIFE SCIENCES: FIELD SERVICE MANAGEMENT MARKET, BY REGION, 2020-2024 (USD MILLION)
- TABLE 69 HEALTHCARE & LIFE SCIENCES: FIELD SERVICE MANAGEMENT MARKET, BY REGION, 2025-2030 (USD MILLION)
- TABLE 70 ENERGY & UTILITIES: FIELD SERVICE MANAGEMENT MARKET, BY REGION, 2020-2024 (USD MILLION)
- TABLE 71 ENERGY & UTILITIES: FIELD SERVICE MANAGEMENT MARKET, BY REGION, 2025-2030 (USD MILLION)
- TABLE 72 TELECOMMUNICATIONS: FIELD SERVICE MANAGEMENT MARKET, BY REGION, 2020-2024 (USD MILLION)
- TABLE 73 TELECOMMUNICATIONS: FIELD SERVICE MANAGEMENT MARKET, BY REGION, 2025-2030 (USD MILLION)
- TABLE 74 IT & ITES: FIELD SERVICE MANAGEMENT MARKET, BY REGION, 2020-2024 (USD MILLION)
- TABLE 75 IT & ITES: FIELD SERVICE MANAGEMENT MARKET, BY REGION, 2025-2030 (USD MILLION)
- TABLE 76 OIL & GAS: FIELD SERVICE MANAGEMENT MARKET, BY REGION, 2020-2024 (USD MILLION)
- TABLE 77 OIL & GAS: FIELD SERVICE MANAGEMENT MARKET, BY REGION, 2025-2030 (USD MILLION)
- TABLE 78 OTHERS: FIELD SERVICE MANAGEMENT MARKET, BY REGION, 2020-2024 (USD MILLION)
- TABLE 79 OTHERS: FIELD SERVICE MANAGEMENT MARKET, BY REGION, 2025-2030 (USD MILLION)
- TABLE 80 FIELD SERVICE MANAGEMENT MARKET, BY REGION, 2020-2024 (USD MILLION)
- TABLE 81 FIELD SERVICE MANAGEMENT MARKET, BY REGION, 2025-2030 (USD MILLION)
- TABLE 82 NORTH AMERICA: FIELD SERVICE MANAGEMENT MARKET, BY OFFERING, 2020-2024 (USD MILLION)
- TABLE 83 NORTH AMERICA: FIELD SERVICE MANAGEMENT MARKET, BY OFFERING, 2025-2030 (USD MILLION)
- TABLE 84 NORTH AMERICA: FIELD SERVICE MANAGEMENT MARKET, BY SOLUTION, 2020-2024 (USD MILLION)
- TABLE 85 NORTH AMERICA: FIELD SERVICE MANAGEMENT MARKET, BY SOLUTION, 2025-2030 (USD MILLION)
- TABLE 86 NORTH AMERICA: FIELD SERVICE MANAGEMENT MARKET, BY SERVICE TYPE, 2020-2024 (USD MILLION)
- TABLE 87 NORTH AMERICA: FIELD SERVICE MANAGEMENT MARKET, BY SERVICE TYPE, 2025-2030 (USD MILLION)
- TABLE 88 NORTH AMERICA: FIELD SERVICE MANAGEMENT MARKET, BY DEPLOYMENT MODE, 2020-2024 (USD MILLION)
- TABLE 89 NORTH AMERICA: FIELD SERVICE MANAGEMENT MARKET, BY DEPLOYMENT MODE, 2025-2030 (USD MILLION)
- TABLE 90 NORTH AMERICA: FIELD SERVICE MANAGEMENT MARKET, BY ORGANIZATION SIZE, 2020-2024 (USD MILLION)
- TABLE 91 NORTH AMERICA: FIELD SERVICE MANAGEMENT MARKET, BY ORGANIZATION SIZE, 2025-2030 (USD MILLION)
- TABLE 92 NORTH AMERICA: FIELD SERVICE MANAGEMENT MARKET, BY VERTICAL, 2020-2024 (USD MILLION)
- TABLE 93 NORTH AMERICA: FIELD SERVICE MANAGEMENT MARKET, BY VERTICAL, 2025-2030 (USD MILLION)
- TABLE 94 NORTH AMERICA: FIELD SERVICE MANAGEMENT MARKET, BY COUNTRY, 2020-2024 (USD MILLION)
- TABLE 95 NORTH AMERICA: FIELD SERVICE MANAGEMENT MARKET, BY COUNTRY, 2025-2030 (USD MILLION)
- TABLE 96 US: FIELD SERVICE MANAGEMENT MARKET, BY ORGANIZATION SIZE, 2020-2024 (USD MILLION)
- TABLE 97 US: FIELD SERVICE MANAGEMENT MARKET, BY ORGANIZATION SIZE, 2025-2030 (USD MILLION)
- TABLE 98 CANADA: FIELD SERVICE MANAGEMENT MARKET, BY ORGANIZATION SIZE, 2020-2024 (USD MILLION)
- TABLE 99 CANADA: FIELD SERVICE MANAGEMENT MARKET, BY ORGANIZATION SIZE, 2025-2030 (USD MILLION)
- TABLE 100 EUROPE: FIELD SERVICE MANAGEMENT MARKET, BY OFFERING, 2020-2024 (USD MILLION)
- TABLE 101 EUROPE: FIELD SERVICE MANAGEMENT MARKET, BY OFFERING, 2025-2030 (USD MILLION)
- TABLE 102 EUROPE: FIELD SERVICE MANAGEMENT MARKET, BY SOLUTIONS, 2020-2024 (USD MILLION)
- TABLE 103 EUROPE: FIELD SERVICE MANAGEMENT MARKET, BY SOLUTIONS, 2025-2030 (USD MILLION)
- TABLE 104 EUROPE: FIELD SERVICE MANAGEMENT MARKET, BY SERVICE TYPE, 2020-2024 (USD MILLION)
- TABLE 105 EUROPE: FIELD SERVICE MANAGEMENT MARKET, BY SERVICES TYPE, 2025-2030 (USD MILLION)
- TABLE 106 EUROPE: FIELD SERVICE MANAGEMENT MARKET, BY DEPLOYMENT MODE, 2020-2024 (USD MILLION)
- TABLE 107 EUROPE: FIELD SERVICE MANAGEMENT MARKET, BY DEPLOYMENT MODE, 2025-2030 (USD MILLION)
- TABLE 108 EUROPE: FIELD SERVICE MANAGEMENT MARKET, BY ORGANIZATION SIZE, 2020-2024 (USD MILLION)
- TABLE 109 EUROPE: FIELD SERVICE MANAGEMENT MARKET, BY ORGANIZATION SIZE, 2025-2030 (USD MILLION)
- TABLE 110 EUROPE: FIELD SERVICE MANAGEMENT MARKET, BY VERTICAL, 2020-2024 (USD MILLION)
- TABLE 111 EUROPE: FIELD SERVICE MANAGEMENT MARKET, BY VERTICAL, 2025-2030 (USD MILLION)
- TABLE 112 EUROPE: FIELD SERVICE MANAGEMENT MARKET, BY COUNTRY, 2020-2024 (USD MILLION)
- TABLE 113 EUROPE: FIELD SERVICE MANAGEMENT MARKET, BY COUNTRY, 2025-2030 (USD MILLION)
- TABLE 114 UK: FIELD SERVICE MANAGEMENT MARKET, BY ORGANIZATION SIZE, 2020-2024 (USD MILLION)
- TABLE 115 UK: FIELD SERVICE MANAGEMENT MARKET, BY ORGANIZATION SIZE, 2025-2030 (USD MILLION)
- TABLE 116 GERMANY: FIELD SERVICE MANAGEMENT MARKET, BY ORGANIZATION SIZE, 2020-2024 (USD MILLION)
- TABLE 117 GERMANY: FIELD SERVICE MANAGEMENT MARKET, BY ORGANIZATION SIZE, 2025-2030 (USD MILLION)
- TABLE 118 FRANCE: FIELD SERVICE MANAGEMENT MARKET, BY ORGANIZATION SIZE, 2020-2024 (USD MILLION)
- TABLE 119 FRANCE: FIELD SERVICE MANAGEMENT MARKET, BY ORGANIZATION SIZE, 2025-2030 (USD MILLION)
- TABLE 120 ITALY: FIELD SERVICE MANAGEMENT MARKET, BY ORGANIZATION SIZE, 2020-2024 (USD MILLION)
- TABLE 121 ITALY: FIELD SERVICE MANAGEMENT MARKET, BY ORGANIZATION SIZE, 2025-2030 (USD MILLION)
- TABLE 122 REST OF EUROPE: FIELD SERVICE MANAGEMENT MARKET, BY ORGANIZATION SIZE, 2020-2024 (USD MILLION)
- TABLE 123 REST OF EUROPE: FIELD SERVICE MANAGEMENT MARKET, BY ORGANIZATION SIZE, 2025-2030 (USD MILLION)
- TABLE 124 ASIA PACIFIC: FIELD SERVICE MANAGEMENT MARKET, BY OFFERING, 2020-2024 (USD MILLION)
- TABLE 125 ASIA PACIFIC: FIELD SERVICE MANAGEMENT MARKET, BY OFFERING, 2025-2030 (USD MILLION)
- TABLE 126 ASIA PACIFIC: FIELD SERVICE MANAGEMENT MARKET, BY SOLUTION, 2020-2024 (USD MILLION)
- TABLE 127 ASIA PACIFIC: FIELD SERVICE MANAGEMENT MARKET, BY SOLUTION, 2025-2030 (USD MILLION)
- TABLE 128 ASIA PACIFIC: FIELD SERVICE MANAGEMENT MARKET, BY SERVICE TYPE, 2020-2024 (USD MILLION)
- TABLE 129 ASIA PACIFIC: FIELD SERVICE MANAGEMENT MARKET, BY SERVICE TYPE, 2025-2030 (USD MILLION)
- TABLE 130 ASIA PACIFIC: FIELD SERVICE MANAGEMENT MARKET, BY DEPLOYMENT MODE, 2020-2024 (USD MILLION)
- TABLE 131 ASIA PACIFIC: FIELD SERVICE MANAGEMENT MARKET, BY DEPLOYMENT MODE, 2025-2030 (USD MILLION)
- TABLE 132 ASIA PACIFIC: FIELD SERVICE MANAGEMENT MARKET, BY ORGANIZATION SIZE, 2020-2024 (USD MILLION)
- TABLE 133 ASIA PACIFIC: FIELD SERVICE MANAGEMENT MARKET, BY ORGANIZATION SIZE, 2025-2030 (USD MILLION)
- TABLE 134 ASIA PACIFIC: FIELD SERVICE MANAGEMENT MARKET, BY VERTICAL, 2020-2024 (USD MILLION)
- TABLE 135 ASIA PACIFIC: FIELD SERVICE MANAGEMENT MARKET, BY VERTICAL, 2025-2030 (USD MILLION)
- TABLE 136 ASIA PACIFIC: FIELD SERVICE MANAGEMENT MARKET, BY COUNTRY, 2020-2024 (USD MILLION)
- TABLE 137 ASIA PACIFIC: FIELD SERVICE MANAGEMENT MARKET, BY COUNTRY, 2025-2030 (USD MILLION)
- TABLE 138 CHINA: FIELD SERVICE MANAGEMENT MARKET, BY ORGANIZATION SIZE, 2020-2024 (USD MILLION)
- TABLE 139 CHINA: FIELD SERVICE MANAGEMENT MARKET, BY ORGANIZATION SIZE, 2025-2030 (USD MILLION)
- TABLE 140 JAPAN: FIELD SERVICE MANAGEMENT MARKET, BY ORGANIZATION SIZE, 2020-2024 (USD MILLION)
- TABLE 141 JAPAN: FIELD SERVICE MANAGEMENT MARKET, BY ORGANIZATION SIZE, 2025-2030 (USD MILLION)
- TABLE 142 INDIA: FIELD SERVICE MANAGEMENT MARKET, BY ORGANIZATION SIZE, 2020-2024 (USD MILLION)
- TABLE 143 INDIA: FIELD SERVICE MANAGEMENT MARKET, BY ORGANIZATION SIZE, 2025-2030 (USD MILLION)
- TABLE 144 REST OF ASIA PACIFIC: FIELD SERVICE MANAGEMENT MARKET, BY ORGANIZATION SIZE, 2020-2024 (USD MILLION)
- TABLE 145 REST OF ASIA PACIFIC: FIELD SERVICE MANAGEMENT MARKET, BY ORGANIZATION SIZE, 2025-2030 (USD MILLION)
- TABLE 146 MIDDLE EAST & AFRICA: FIELD SERVICE MANAGEMENT MARKET, BY OFFERING, 2020-2024 (USD MILLION)
- TABLE 147 MIDDLE EAST & AFRICA: FIELD SERVICE MANAGEMENT MARKET, BY OFFERING, 2025-2030 (USD MILLION)
- TABLE 148 MIDDLE EAST & AFRICA: FIELD SERVICE MANAGEMENT MARKET, BY SOLUTIONS, 2020-2024 (USD MILLION)
- TABLE 149 MIDDLE EAST & AFRICA: FIELD SERVICE MANAGEMENT MARKET, BY SOLUTIONS, 2025-2030 (USD MILLION)
- TABLE 150 MIDDLE EAST & AFRICA: FIELD SERVICE MANAGEMENT MARKET, BY SERVICE TYPE, 2020-2024 (USD MILLION)
- TABLE 151 MIDDLE EAST & AFRICA: FIELD SERVICE MANAGEMENT MARKET, BY SERVICE TYPE, 2025-2030 (USD MILLION)
- TABLE 152 MIDDLE EAST & AFRICA: FIELD SERVICE MANAGEMENT MARKET, BY DEPLOYMENT MODE, 2020-2024 (USD MILLION)
- TABLE 153 MIDDLE EAST & AFRICA: FIELD SERVICE MANAGEMENT MARKET, BY DEPLOYMENT MODE, 2025-2030 (USD MILLION)
- TABLE 154 MIDDLE EAST & AFRICA: FIELD SERVICE MANAGEMENT MARKET, BY ORGANIZATION SIZE, 2020-2024 (USD MILLION)
- TABLE 155 MIDDLE EAST & AFRICA: FIELD SERVICE MANAGEMENT MARKET, BY ORGANIZATION SIZE, 2025-2030 (USD MILLION)
- TABLE 156 MIDDLE EAST & AFRICA: FIELD SERVICE MANAGEMENT MARKET, BY VERTICAL, 2020-2024 (USD MILLION)
- TABLE 157 MIDDLE EAST & AFRICA: FIELD SERVICE MANAGEMENT MARKET, BY VERTICAL, 2025-2030 (USD MILLION)
- TABLE 158 MIDDLE EAST & AFRICA: FIELD SERVICE MANAGEMENT MARKET, BY COUNTRY, 2020-2024 (USD MILLION)
- TABLE 159 MIDDLE EAST & AFRICA: FIELD SERVICE MANAGEMENT MARKET, BY COUNTRY, 2025-2030 (USD MILLION)
- TABLE 160 GULF COOPERATION COUNCIL: FIELD SERVICE MANAGEMENT MARKET, BY ORGANIZATION SIZE, 2020-2024 (USD MILLION)
- TABLE 161 GULF COOPERATION COUNCIL: FIELD SERVICE MANAGEMENT MARKET, BY ORGANIZATION SIZE, 2025-2030 (USD MILLION)
- TABLE 162 GULF COOPERATION COUNCIL: FIELD SERVICE MANAGEMENT MARKET, BY COUNTRY, 2020-2024 (USD MILLION)
- TABLE 163 GULF COOPERATION COUNCIL: FIELD SERVICE MANAGEMENT MARKET, BY COUNTRY, 2025-2030 (USD MILLION)
- TABLE 164 UAE: FIELD SERVICE MANAGEMENT MARKET, BY ORGANIZATION SIZE, 2020-2024 (USD MILLION)
- TABLE 165 UAE: FIELD SERVICE MANAGEMENT MARKET, BY ORGANIZATION SIZE, 2025-2030 (USD MILLION)
- TABLE 166 KINGDOM OF SAUDI ARABIA: FIELD SERVICE MANAGEMENT MARKET, BY ORGANIZATION SIZE, 2020-2024 (USD MILLION)
- TABLE 167 KINGDOM OF SAUDI ARABIA: FIELD SERVICE MANAGEMENT MARKET, BY ORGANIZATION SIZE, 2025-2030 (USD MILLION)
- TABLE 168 REST OF GCC: FIELD SERVICE MANAGEMENT MARKET, BY ORGANIZATION SIZE, 2020-2024 (USD MILLION)
- TABLE 169 REST OF GCC: FIELD SERVICE MANAGEMENT MARKET, BY ORGANIZATION SIZE, 2025-2030 (USD MILLION)
- TABLE 170 SOUTH AFRICA: FIELD SERVICE MANAGEMENT MARKET, BY ORGANIZATION SIZE, 2020-2024 (USD MILLION)
- TABLE 171 SOUTH AFRICA: FIELD SERVICE MANAGEMENT MARKET, BY ORGANIZATION SIZE, 2025-2030 (USD MILLION)
- TABLE 172 REST OF MIDDLE EAST & AFRICA: FIELD SERVICE MANAGEMENT MARKET, BY ORGANIZATION SIZE, 2020-2024 (USD MILLION)
- TABLE 173 REST OF MIDDLE EAST & AFRICA: FIELD SERVICE MANAGEMENT MARKET, BY ORGANIZATION SIZE, 2025-2030 (USD MILLION)
- TABLE 174 LATIN AMERICA: FIELD SERVICE MANAGEMENT MARKET, BY OFFERING, 2020-2024 (USD MILLION)
- TABLE 175 LATIN AMERICA: FIELD SERVICE MANAGEMENT MARKET, BY OFFERING, 2025-2030 (USD MILLION)
- TABLE 176 LATIN AMERICA: FIELD SERVICE MANAGEMENT MARKET, BY SOLUTIONS, 2020-2024 (USD MILLION)
- TABLE 177 LATIN AMERICA: FIELD SERVICE MANAGEMENT MARKET, BY SOLUTIONS, 2025-2030 (USD MILLION)
- TABLE 178 LATIN AMERICA: FIELD SERVICE MANAGEMENT MARKET, BY SERVICE TYPE, 2020-2024 (USD MILLION)
- TABLE 179 LATIN AMERICA: FIELD SERVICE MANAGEMENT MARKET, BY SERVICE TYPE, 2025-2030 (USD MILLION)
- TABLE 180 LATIN AMERICA: FIELD SERVICE MANAGEMENT MARKET, BY DEPLOYMENT MODE, 2020-2024 (USD MILLION)
- TABLE 181 LATIN AMERICA: FIELD SERVICE MANAGEMENT MARKET, BY DEPLOYMENT MODE, 2025-2030 (USD MILLION)
- TABLE 182 LATIN AMERICA: FIELD SERVICE MANAGEMENT MARKET, BY ORGANIZATION SIZE, 2020-2024 (USD MILLION)
- TABLE 183 LATIN AMERICA: FIELD SERVICE MANAGEMENT MARKET, BY ORGANIZATION SIZE, 2025-2030 (USD MILLION)
- TABLE 184 LATIN AMERICA: FIELD SERVICE MANAGEMENT MARKET, BY VERTICAL, 2020-2024 (USD MILLION)
- TABLE 185 LATIN AMERICA: FIELD SERVICE MANAGEMENT MARKET, BY VERTICAL, 2025-2030 (USD MILLION)
- TABLE 186 LATIN AMERICA: FIELD SERVICE MANAGEMENT MARKET, BY COUNTRY, 2020-2024 (USD MILLION)
- TABLE 187 LATIN AMERICA: FIELD SERVICE MANAGEMENT MARKET, BY COUNTRY, 2025-2030 (USD MILLION)
- TABLE 188 BRAZIL: FIELD SERVICE MANAGEMENT MARKET, BY ORGANIZATION SIZE, 2020-2024 (USD MILLION)
- TABLE 189 BRAZIL: FIELD SERVICE MANAGEMENT MARKET, BY ORGANIZATION SIZE, 2025-2030 (USD MILLION)
- TABLE 190 MEXICO: FIELD SERVICE MANAGEMENT MARKET, BY ORGANIZATION SIZE, 2020-2024 (USD MILLION)
- TABLE 191 MEXICO: FIELD SERVICE MANAGEMENT MARKET, BY ORGANIZATION SIZE, 2025-2030 (USD MILLION)
- TABLE 192 REST OF LATIN AMERICA: FIELD SERVICE MANAGEMENT MARKET, BY ORGANIZATION SIZE, 2020-2024 (USD MILLION)
- TABLE 193 REST OF LATIN AMERICA: FIELD SERVICE MANAGEMENT MARKET, BY ORGANIZATION SIZE, 2025-2030 (USD MILLION)
- TABLE 194 FIELD SERVICE MANAGEMENT MARKET: OVERVIEW OF STRATEGIES ADOPTED BY KEY PLAYERS, 2023-2025
- TABLE 195 MARKET SHARE OF KEY VENDORS, 2024
- TABLE 196 FIELD SERVICE MANAGEMENT MARKET: REGION FOOTPRINT
- TABLE 197 FIELD SERVICE MANAGEMENT MARKET: OFFERING FOOTPRINT
- TABLE 198 FIELD SERVICE MANAGEMENT MARKET: VERTICAL FOOTPRINT
- TABLE 199 FIELD SERVICE MANAGEMENT MARKET: LIST OF KEY STARTUPS/SMES
- TABLE 200 FIELD SERVICE MANAGEMENT MARKET: COMPETITIVE BENCHMARKING OF KEY STARTUPS/SMES
- TABLE 201 FIELD SERVICE MANAGEMENT MARKET: PRODUCT LAUNCHES, MARCH 2023-OCTOBER 2025
- TABLE 202 FIELD SERVICE MANAGEMENT MARKET: DEALS, OCTOBER 2023-OCTOBER 2025
- TABLE 203 ORACLE: COMPANY OVERVIEW
- TABLE 204 ORACLE: PRODUCTS/SOLUTIONS/SERVICES OFFERED
- TABLE 205 ORACLE: PRODUCT LAUNCHES AND ENHANCEMENTS
- TABLE 206 ORACLE: DEALS
- TABLE 207 MICROSOFT: COMPANY OVERVIEW
- TABLE 208 MICROSOFT: PRODUCTS/SOLUTIONS/SERVICES OFFERED
- TABLE 209 MICROSOFT: PRODUCT LAUNCHES AND ENHANCEMENTS
- TABLE 210 SALESFORCE: COMPANY OVERVIEW
- TABLE 211 SALESFORCE: PRODUCTS/SOLUTIONS/SERVICES OFFERED
- TABLE 212 SALESFORCE: PRODUCT LAUNCHES AND ENHANCEMENTS
- TABLE 213 SALESFORCE: DEALS
- TABLE 214 IFS: COMPANY OVERVIEW
- TABLE 215 IFS: PRODUCTS/SOLUTIONS/SERVICES OFFERED
- TABLE 216 IFS: DEALS
- TABLE 217 SAP: COMPANY OVERVIEW
- TABLE 218 SAP: PRODUCTS/SOLUTIONS/SERVICES OFFERED
- TABLE 219 SAP: PRODUCT LAUNCHES AND ENHANCEMENTS
- TABLE 220 SAP: DEALS
- TABLE 221 INFOR: COMPANY OVERVIEW
- TABLE 222 INFOR: PRODUCTS/SOLUTIONS/SERVICES OFFERED
- TABLE 223 TRIMBLE: COMPANY OVERVIEW
- TABLE 224 TRIMBLE: PRODUCTS/SOLUTIONS/SERVICES OFFERED
- TABLE 225 TRIMBLE: PRODUCT LAUNCHES AND ENHANCEMENTS
- TABLE 226 COMARCH: COMPANY OVERVIEW
- TABLE 227 COMARCH: PRODUCTS/SOLUTIONS/SERVICES OFFERED
- TABLE 228 COMARCH: DEALS
- TABLE 229 OVERIT: COMPANY OVERVIEW
- TABLE 230 OVERIT: PRODUCTS/SOLUTIONS/SERVICES OFFERED
- TABLE 231 OVERIT: DEALS
- TABLE 232 PTC: COMPANY OVERVIEW
- TABLE 233 PTC: PRODUCTS/SOLUTIONS/SERVICES OFFERED
- TABLE 234 PTC: PRODUCT LAUNCHES AND ENHANCEMENTS
- TABLE 235 PTC: DEALS
- TABLE 236 FACTOR ANALYSIS
- TABLE 237 WORKFORCE MANAGEMENT MARKET, BY COMPONENT, 2018-2025 (USD MILLION)
- TABLE 238 WORKFORCE MANAGEMENT MARKET, BY SERVICE, 2018-2025 (USD MILLION)
- TABLE 239 WORK ORDER MANAGEMENT SYSTEMS MARKET, BY COMPONENT, 2016-2023 (USD MILLION)
- TABLE 240 WORK ORDER MANAGEMENT SYSTEMS MARKET, BY DEPLOYMENT TYPE, 2016-2023 (USD MILLION)
List of Figures
- FIGURE 1 KEY INSIGHTS AND MARKET HIGHLIGHTS
- FIGURE 2 FIELD SERVICE MANAGEMENT MARKET, 2025-2030
- FIGURE 3 MAJOR STRATEGIES ADOPTED BY KEY PLAYERS IN FIELD SERVICE MANAGEMENT MARKET (2020-2025)
- FIGURE 4 DISRUPTIVE TRENDS IMPACTING GROWTH OF FIELD SERVICE MANAGEMENT MARKET
- FIGURE 5 HIGH-GROWTH SEGMENTS AND EMERGING FRONTIERS IN FIELD SERVICE MANAGEMENT MARKET, 2025
- FIGURE 6 ASIA PACIFIC TO REGISTER HIGHEST GROWTH DURING FORECAST PERIOD
- FIGURE 7 SMALL AND MEDIUM ENTERPRISES TO INVEST IN AFFORDABLE FSM SOFTWARE TO STREAMLINE FIELD OPERATIONS AND ENHANCE CUSTOMER SERVICE
- FIGURE 8 SOLUTIONS SEGMENT TO ACCOUNT FOR LARGEST MARKET SHARE THROUGHOUT FORECAST PERIOD
- FIGURE 9 LARGE ENTERPRISES SEGMENT TO HOLD LARGER MARKET SHARE DURING FORECAST PERIOD
- FIGURE 10 MANUFACTURING SEGMENT TO ACCOUNT FOR LARGEST MARKET SHARE BY 2030
- FIGURE 11 ASIA PACIFIC TO EMERGE AS BEST MARKET FOR INVESTMENT IN NEXT FIVE YEARS
- FIGURE 12 FIELD SERVICE MANAGEMENT MARKET: DRIVERS, RESTRAINTS, OPPORTUNITIES, AND CHALLENGES
- FIGURE 13 PORTER'S FIVE FORCES ANALYSIS: FIELD SERVICES MANAGEMENT MARKET
- FIGURE 14 INTERNATIONAL INVESTMENT IN DIGITAL ECONOMY
- FIGURE 15 FIELD SERVICE MANAGEMENT MARKET: SUPPLY CHAIN ANALYSIS
- FIGURE 16 FIELD SERVICE MANAGEMENT ECOSYSTEM
- FIGURE 17 AVERAGE SELLING PRICE TREND OF FIELD SERVICE MANAGEMENT, BY REGION, 2022-2024
- FIGURE 18 FIELD SERVICE MANAGEMENT MARKET: TRENDS/DISRUPTIONS IMPACTING BUYERS
- FIGURE 19 LEADING FIELD SERVICE MANAGEMENT VENDORS, BY NUMBER OF INVESTORS AND FUNDING ROUNDS, 2024
- FIGURE 20 NUMBER OF PATENTS PUBLISHED, 2014-2024
- FIGURE 21 IMPACT OF AI/GEN AI ON FIELD SERVICE MANAGEMENT MARKET
- FIGURE 22 FIELD SERVICE MANAGEMENT MARKET: DECISION-MAKING FACTORS
- FIGURE 23 INFLUENCE OF STAKEHOLDERS ON BUYING PROCESS FOR TOP THREE VERTICALS
- FIGURE 24 KEY BUYING CRITERIA FOR TOP THREE VERTICALS
- FIGURE 25 FIELD SERVICE MANAGEMENT MARKET: ADOPTION BARRIERS & INTERNAL CHALLENGES
- FIGURE 26 SOLUTIONS SEGMENT TO DOMINATE MARKET DURING FORECAST PERIOD
- FIGURE 27 ON-PREMISES SEGMENT TO DOMINATE MARKET DURING FORECAST PERIOD
- FIGURE 28 LARGE ENTERPRISES SEGMENT TO LEAD MARKET DURING FORECAST PERIOD
- FIGURE 29 MANUFACTURING SEGMENT TO DOMINATE MARKET DURING FORECAST PERIOD
- FIGURE 30 ASIA PACIFIC TO HOLD LARGEST MARKET DURING FORECAST PERIOD
- FIGURE 31 NORTH AMERICA: FIELD SERVICE MANAGEMENT MARKET SNAPSHOT
- FIGURE 32 ASIA PACIFIC: FIELD SERVICE MANAGEMENT MARKET SNAPSHOT
- FIGURE 33 REVENUE ANALYSIS OF KEY VENDORS, 2020-2024
- FIGURE 34 FIELD SERVICE MANAGEMENT MARKET: MARKET SHARE ANALYSIS, 2024
- FIGURE 35 FIELD SERVICE MANAGEMENT MARKET: COMPARATIVE ANALYSIS OS VENDOR PRODUCTS
- FIGURE 36 COMPANY EVALUATION MATRIX FOR KEY PLAYERS: CRITERIA WEIGHTAGE
- FIGURE 37 FIELD SERVICE MANAGEMENT MARKET: COMPANY EVALUATION MATRIX (KEY PLAYERS), 2024
- FIGURE 38 FIELD SERVICE MANAGEMENT MARKET: COMPANY FOOTPRINT
- FIGURE 39 EVALUATION MATRIX FOR STARTUPS/SMES: CRITERIA WEIGHTAGE
- FIGURE 40 FIELD SERVICE MANAGEMENT MARKET: COMPANY EVALUATION MATRIX (STARTUPS/SMES), 2024
- FIGURE 41 COMPANY VALUATION OF KEY VENDORS
- FIGURE 42 FINANCIAL METRICS OF KEY VENDORS
- FIGURE 43 YEAR-TO-DATE (YTD) PRICE TOTAL RETURN AND 5-YEAR STOCK BETA OF KEY VENDORS
- FIGURE 44 ORACLE: COMPANY SNAPSHOT
- FIGURE 45 MICROSOFT: COMPANY SNAPSHOT
- FIGURE 46 SALESFORCE: COMPANY SNAPSHOT
- FIGURE 47 SAP: COMPANY SNAPSHOT
- FIGURE 48 TRIMBLE: COMPANY SNAPSHOT
- FIGURE 49 PTC: COMPANY SNAPSHOT
- FIGURE 50 FIELD SERVICES MANAGEMENT MARKET: RESEARCH DESIGN
- FIGURE 51 BREAKUP OF PRIMARY INTERVIEWS, BY COMPANY TYPE, DESIGNATION, AND REGION
- FIGURE 52 FIELD SERVICE MANAGEMENT MARKET: TOP-DOWN AND BOTTOM-UP APPROACHES
- FIGURE 53 MARKET SIZE ESTIMATION METHODOLOGY: TOP-DOWN APPROACH
- FIGURE 54 MARKET SIZE ESTIMATION METHODOLOGY: BOTTOM-UP APPROACH
- FIGURE 55 FIELD SERVICE MANAGEMENT MARKET: RESEARCH FLOW
- FIGURE 56 MARKET SIZE ESTIMATION METHODOLOGY: SUPPLY-SIDE ANALYSIS
- FIGURE 57 MARKET SIZE ESTIMATION METHODOLOGY: BOTTOM-UP APPROACH FROM SUPPLY SIDE - COLLECTIVE REVENUE OF VENDORS
- FIGURE 58 FIELD SERVICE MANAGEMENT MARKET: DEMAND-SIDE APPROACH

