
PUBLISHER: MarketsandMarkets | PRODUCT CODE: 2066263
PUBLISHER: MarketsandMarkets | PRODUCT CODE: 2066263
Nuclear Fusion Market By Technology (Inertial Confinement, Magnetic Confinement), Fuel (Tritium, Deuterium, Helium-3, Proton-Boron), End User (Industrial, Utilities, National Laboratories, and Research Institutes), and Region - Global Forecast to 2031
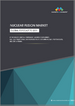
The nuclear fusion market is projected to reach USD 33.77 billion by 2031 from an estimated USD 18.00 billion in 2026, growing at a CAGR of 13.4% during the forecast period. This strong growth trajectory is primarily driven by the accelerating global transition toward clean, reliable, and scalable baseload power, where fusion is increasingly positioned as a long-term solution capable of addressing both decarbonization and energy security challenges simultaneously. Unlike intermittent renewable sources, fusion offers the potential for continuous power generation with minimal environmental impact, making it highly attractive for future energy systems.
| Scope of the Report | |
|---|---|
| Years Considered for the Study | 2023-2031 |
| Base Year | 2025 |
| Forecast Period | 2026-2031 |
| Units Considered | Value (USD Million/Billion), Volume (MW) |
| Segments | By Technology, Fuel, End-User |
| Regions covered | Europe, Asia Pacific, North America, Rest of the World |
At the same time, the sector is benefiting from a surge in private capital and institutional investment, with billions of dollars flowing into fusion startups and technology developers, signaling growing confidence in commercial viability, alongside funding and technological breakthroughs, particularly in plasma confinement, high-temperature superconducting magnets, and advanced materials, are significantly improving reactor efficiency and stability, reducing technical barriers that historically limited progress. Furthermore, the increasing number of pilot and demonstration projects is helping bridge the gap between experimental research and industrial-scale deployment, while cross-industry collaborations are accelerating innovation cycles and enabling faster prototyping and testing. Collectively, these factors are transforming fusion from a long-term scientific ambition into a structured, investment-driven market with clear commercialization pathways.
The nuclear fusion market is undergoing a shift in its innovation landscape, with several emerging trends redefining its growth dynamics. One of the most notable trends is the diversification of technological approaches, with multiple reactor concepts, including magnetic confinement, inertial confinement, and alternative configurations, being developed concurrently, fostering competition, and accelerating breakthroughs across different design philosophies. The industry is also transitioning from research-centric development to commercialization-focused strategies, with companies prioritizing scalable reactor designs, shorter development timelines, and integration with existing energy infrastructure. Another key trend is the integration of digital technologies such as artificial intelligence and advanced simulation tools into reactor operations, enabling precise plasma control, predictive maintenance, and improved system optimization. Additionally, there is a growing emphasis on strategic partnerships among technology developers, engineering firms, and energy stakeholders, which is essential to addressing the capital intensity and engineering complexity of fusion systems. The rise of enabling technologies, such as high-powered laser systems, next-generation superconductors, and modular reactor architectures, is further enhancing scalability and cost efficiency. Overall, these trends indicate that the nuclear fusion market is rapidly evolving into a competitive, innovation-led ecosystem, with increasing alignment among technological progress, investor expectations, and future energy market needs.
"By fuel, the deuterium-deuterium segment held the second-largest market share in 2025."
The deuterium-deuterium segment, by fuel type, is expected to hold the second-largest share of the nuclear fusion market in 2025, driven by its strategic advantages in long-term fuel availability and energy security. Unlike deuterium-tritium (D-T) fusion, which relies on tritium, which is scarce and difficult to produce and handle, deuterium is abundant in natural water sources, making D-D fusion an attractive option for sustainable, large-scale deployment over the long term. Although D-D reactions require significantly higher temperatures and present greater technical challenges in achieving stable plasma conditions, ongoing advancements in plasma physics, confinement systems, and reactor materials are steadily improving feasibility. As a result, multiple fusion developers are increasingly exploring D-D pathways as a next-generation solution beyond initial D-T-based commercialization phases. This growing focus, combined with its inherent advantages in fuel accessibility and reduced requirements for radioactive handling, is expected to strengthen the position of the deuterium-deuterium segment as a key component of the evolving nuclear fusion fuel landscape.
"By end user, the utilities segment is expected to be the third-fastest-growing segment from 2026 to 2031."
The utilities segment, by end users, is projected to be the third-fastest growing segment from 2026 to 2031, driven by the increasing need for reliable, large-scale, and continuous clean power generation. Utilities are actively exploring nuclear fusion as a long-term solution to complement renewable energy sources, particularly to address intermittency challenges and ensure grid stability. As fusion technology advances toward commercialization, utilities are expected to play a central role in integrating fusion-based power into existing energy infrastructure, leveraging their expertise in transmission, distribution, and large-scale plant operations. The segment's growth is further supported by rising pressure to decarbonize power generation portfolios and transition away from fossil fuels while maintaining energy reliability. Additionally, utilities are increasingly participating in partnerships and pilot projects to gain early access to fusion capabilities, positioning themselves at the forefront of next-generation energy adoption. This proactive engagement, combined with the long-term potential of fusion to deliver baseload electricity with minimal environmental impact, is expected to drive sustained growth in the utilities segment over the forecast period.
Breakdown of Primaries:
In-depth interviews with key industry participants, subject-matter experts, C-level executives at key market players, and industry consultants, among other experts, were conducted to obtain and verify critical qualitative and quantitative information and to assess future market prospects. The primary interviews were distributed as follows:
By Company Type: Tier 1 (30%), Tier 2 (55%), and Tier 3 (15%)
By Designation: C-level Executives (30%), Directors (20%), and Managers (50%)
By Region: North America (18%), Europe (8%), Asia Pacific (60%), South America (4%), and Middle East & Africa (10%)
The nuclear fusion market is predominantly governed by well-established global leaders. Notable players in the nuclear fusion market include Commonwealth Fusion Systems (US), Tokamak Energy (UK), TAE Technologies (US), Helion (US), General Fusion (Canada), SHINE Technologies (US), Focused Energy Inc. (US), Type One Energy (US), Thea Energy (US), Zap Energy Inc. (US), Xcimer Energy (US), Realta Fusion (US), Lockheed Martin (US), Marvel Fusion (Germany), Alpha Ring (US), First Light Fusion (UK), Helical Fusion Co., Ltd. (Japan), OpenStar Technologies Limited (New Zealand), Proxima Fusion (Germany), Gauss Fusion (Germany), Novatron Fusion Group AB (Sweden), Renaissance Fusion (France), HB11 Energy Holding Pty Ltd (Australia), Pulsar Fusion (UK), and nT-Tao (Israel).
Research Coverage:
The report provides a comprehensive definition, description, and forecast of the nuclear fusion market based on various parameters, including technology (magnetic confinement, inertial confinement, other technologies), fuel (deuterium-tritium, deuterium-deuterium, proton-boron, deuterium-helium-3 ), end user (national laboratories & research institutes, utilities, industrial, other end users), and region (Asia Pacific, North America, Europe, the Rest of the World).
The report also offers a thorough qualitative and quantitative analysis of nuclear fusion, encompassing a comprehensive examination of the key market drivers, limitations, opportunities, and challenges. Additionally, it covers critical facets of the market, such as an assessment of the competitive landscape, an analysis of market dynamics, value-based market estimates, and future trends in the nuclear fusion market. The report provides investment and funding information of key players in the nuclear fusion market.
Key Benefits of Buying the Report
The report is thoughtfully designed to benefit both established industry leaders and newcomers in the nuclear fusion market. It provides reliable revenue forecasts for the entire market and its subsegments. This data is a valuable resource for stakeholders, enabling them to gain a comprehensive understanding of the competitive landscape and formulate effective market strategies for their businesses. Furthermore, the report serves as a channel for stakeholders to grasp the current state of the market, providing essential insights into market drivers, limitations, challenges, and growth opportunities. By incorporating these insights, stakeholders can make well-informed decisions and stay informed about the constantly evolving dynamics of the nuclear fusion industry.
- Analysis of key: Drivers (increasing demand for clean baseload power, growing private and government investments, advancements in high-temperature superconducting (HTS) magnets), restraints (extremely high capital and development costs, complex regulatory and safety approval processes), opportunities (expansion of fusion power purchase agreements (PPAS), development of fusion supply chain ecosystem), and challenges (plasma stability and sustained energy gain, tritium supply and fuel cycle management) influencing the growth of the nuclear fusion market.
- Product Development/Innovation: Product development and innovation are becoming central growth strategies in the nuclear fusion market, as leading companies move beyond laboratory-scale research toward pilot plants, commercial power agreements, and technology partnerships. Commonwealth Fusion Systems is accelerating commercialization through its SPARC demonstration program, ARC power plant development, major funding rounds, and strategic power purchase agreements with large energy buyers, including Google. Helion is advancing its commercial fusion pathway through its Orion plant development and a power purchase agreement with Microsoft, with Constellation serving as the power marketer. Meanwhile, TAE Technologies is strengthening innovation through partnerships focused on advanced fusion systems, neutral beam technology, and future utility-scale fusion power plants. These expansions, agreements, and partnerships show that fusion companies are increasingly focusing on product validation, grid integration, customer-backed deployment, and scalable reactor technologies.
- Market Development: Market development in the nuclear fusion sector is accelerating as companies and research organizations expand from laboratory-based R&D toward pilot plants, commercial demonstration projects, and early customer agreements. The market is being shaped by rising public-private funding, utility partnerships, demand for industrial decarbonization, and the development of fusion supply chains for magnets, lasers, fuel-cycle systems, plasma diagnostics, and advanced materials. As commercialization timelines become clearer, fusion companies are increasingly entering new partnerships, securing power purchase agreements, and building demonstration facilities to validate technology performance and prepare for future grid-scale deployment.
- Market Diversification: Market diversification in the nuclear fusion market is increasing as companies expand beyond electricity generation into wider applications such as industrial heat, hydrogen production, medical isotope production, aerospace propulsion, defense research, and advanced materials testing. Fusion developers are also diversifying across multiple technology pathways, including magnetic confinement, inertial confinement, magneto-inertial fusion, and pulsed concepts, to reduce commercialization risk and target different end-use requirements. This diversification is helping the market attract broader investment, build new customer segments, and create opportunities across the fusion supply chain, including magnets, lasers, diagnostics, fuel-cycle systems, and reactor materials.
Competitive Assessment: A comprehensive evaluation has been conducted to scrutinize the market presence, growth strategies, and service offerings of key players in the nuclear fusion market. These prominent companies include Commonwealth Fusion Systems (US), Tokamak Energy (UK), TAE Technologies (US), Helion (US), General Fusion (Canada), SHINE Technologies (US), Focused Energy Inc. (US), Type One Energy (US), Thea Energy (US), Zap Energy Inc. (US), Xcimer Energy (US), Realta Fusion (US), Lockheed Martin (US), Marvel Fusion (Germany), Alpha Ring (US), First Light Fusion (UK), Helical Fusion Co., Ltd. (Japan), OpenStar Technologies Limited (New Zealand), Proxima Fusion (Germany), Gauss Fusion (Germany), Novatron Fusion Group AB (Sweden), Renaissance Fusion (France), HB11 Energy Holding Pty Ltd (Australia), Pulsar Fusion (UK), and nT-Tao (Israel). This analysis provides in-depth insights into the competitive positions of these major players, their approaches to driving market growth, and the range of technology they offer within the nuclear fusion market.
TABLE OF CONTENTS
1 INTRODUCTION
- 1.1 STUDY OBJECTIVES
- 1.2 MARKET DEFINITION
- 1.3 MARKET SCOPE
- 1.3.1 MARKET SEGMENTATION AND REGIONAL SCOPE
- 1.3.2 INCLUSIONS AND EXCLUSIONS
- 1.3.3 YEARS CONSIDERED
- 1.4 CURRENCY CONSIDERED
- 1.5 UNITS CONSIDERED
- 1.6 LIMITATIONS
- 1.7 STAKEHOLDERS
2 EXECUTIVE SUMMARY
- 2.1 MARKET HIGHLIGHTS AND KEY INSIGHTS
- 2.2 KEY MARKET PARTICIPANTS: MAPPING OF STRATEGIC DEVELOPMENTS
- 2.3 DISRUPTIVE TRENDS IN NUCLEAR FUSION MARKET
- 2.4 HIGH-GROWTH SEGMENTS
- 2.5 REGIONAL SNAPSHOT: MARKET SIZE, GROWTH RATE, AND FORECAST
3 PREMIUM INSIGHTS
- 3.1 ATTRACTIVE OPPORTUNITIES FOR PLAYERS IN NUCLEAR FUSION MARKET
- 3.2 NUCLEAR FUSION MARKET, BY REGION
- 3.3 NUCLEAR FUSION MARKET IN NORTH AMERICA, BY COUNTRY AND FUEL
- 3.4 NUCLEAR FUSION MARKET, BY TECHNOLOGY
- 3.5 NUCLEAR FUSION MARKET, BY FUEL
- 3.6 NUCLEAR FUSION MARKET, BY END USER
- 3.7 NUCLEAR FUSION MARKET, BY REGION
4 MARKET OVERVIEW
- 4.1 INTRODUCTION
- 4.2 MARKET DYNAMICS
- 4.2.1 DRIVERS
- 4.2.1.1 Increasing demand for clean baseload power sources and long-term energy security
- 4.2.1.2 Growing private and government investments toward nuclear fusion technology development and commercialization
- 4.2.1.3 Advancements in HTS magnet technology
- 4.2.2 RESTRAINTS
- 4.2.2.1 Extremely high capital requirement and long development cycles
- 4.2.2.2 Lack of harmonized fusion regulations and lengthy licensing and approval processes
- 4.2.3 OPPORTUNITIES
- 4.2.3.1 Expansion of fusion power purchase agreements
- 4.2.3.2 Development of fusion supply chain ecosystem
- 4.2.4 CHALLENGES
- 4.2.4.1 Achieving stable plasma confinement and sustained net energy gain
- 4.2.4.2 Managing tritium supply and storage
- 4.2.1 DRIVERS
- 4.3 UNMET NEEDS AND WHITE SPACES
- 4.4 INTERCONNECTED MARKETS AND CROSS-SECTOR OPPORTUNITIES
- 4.5 EMERGING BUSINESS MODELS AND ECOSYSTEM SHIFTS
- 4.6 STRATEGIC MOVES BY TIER 1/2/3 PLAYERS
5 INDUSTRY TRENDS
- 5.1 PORTER'S FIVE FORCES ANALYSIS
- 5.1.1 THREAT OF NEW ENTRANTS
- 5.1.2 THREAT OF SUBSTITUTES
- 5.1.3 BARGAINING POWER OF SUPPLIERS
- 5.1.4 BARGAINING POWER OF BUYERS
- 5.1.5 INTENSITY OF COMPETITIVE RIVALRY
- 5.2 MACROECONOMIC OUTLOOK
- 5.2.1 INTRODUCTION
- 5.2.2 GDP TRENDS AND FORECAST
- 5.2.3 TRENDS RELATED TO FUSION ENERGY TECHNOLOGY ADOPTION IN UTILITIES SECTOR
- 5.2.4 TRENDS RELATED TO FUSION ENERGY TECHNOLOGY ADOPTION IN NATIONAL LABORATORIES & RESEARCH INSTITUTES
- 5.3 SUPPLY CHAIN ANALYSIS
- 5.4 ECOSYSTEM ANALYSIS
- 5.5 KEY CONFERENCES AND EVENTS, 2026-2027
- 5.6 PRICING ANALYSIS
- 5.6.1 INDICATIVE CAPEX RANGE OF FUSION POWER PLANT OUTLOOK: FOAK VERSUS MATURE FLEET ECONOMICS
- 5.7 TRENDS/DISRUPTIONS IMPACTING CUSTOMER BUSINESS
- 5.8 INVESTMENT AND FUNDING SCENARIO
- 5.9 CASE STUDY ANALYSIS
- 5.9.1 CFS AND MIT INSTITUTE ACCELERATE COMMERCIAL TOKAMAK DEVELOPMENT THROUGH SPARC REACTOR PROGRAM
- 5.9.2 HELION ENERGY DEVELOPS PULSED FUSION TECHNOLOGY FOR COMMERCIAL ELECTRICITY SUPPLY
- 5.9.3 TOKAMAK ENERGY DEVELOPS COMPACT SPHERICAL TOKAMAK AND HTS MAGNET SYSTEMS TO IMPROVE FUSION EFFICIENCY
- 5.10 IMPACT OF US TARIFF - NUCLEAR FUSION MARKET
- 5.10.1 INTRODUCTION
- 5.10.2 KEY TARIFF RATES
- 5.10.3 PRICE IMPACT ANALYSIS
- 5.10.4 IMPACT ON COUNTRIES/REGIONS
- 5.10.4.1 US
- 5.10.4.2 Europe
- 5.10.4.3 Asia Pacific
6 TECHNOLOGICAL ADVANCEMENTS, AI-DRIVEN IMPACTS, PATENTS, INNOVATIONS, AND FUTURE APPLICATIONS
- 6.1 KEY EMERGING TECHNOLOGIES
- 6.1.1 HIGH-TEMPERATURE SUPERCONDUCTING MAGNETS
- 6.1.2 ARTIFICIAL INTELLIGENCE & MACHINE LEARNING
- 6.2 COMPLEMENTARY TECHNOLOGIES
- 6.2.1 ADVANCED PLASMA-FACING MATERIALS
- 6.2.2 CRYOGENIC & SUPERCONDUCTING COOLING SYSTEMS
- 6.3 ADJACENT TECHNOLOGIES
- 6.3.1 HIGH-POWER LASER & INERTIAL CONFINEMENT SYSTEMS
- 6.3.2 ADVANCED AI DATA CENTER POWER INFRASTRUCTURE
- 6.4 TECHNOLOGY/PRODUCT ROADMAP
- 6.5 PATENT ANALYSIS
- 6.6 FUTURE APPLICATIONS
- 6.7 IMPACT OF AI/GEN AI ON NUCLEAR FUSION MARKET
- 6.7.1 TOP USE CASES AND MARKET POTENTIAL
- 6.7.2 BEST PRACTICES FOLLOWED BY ORGANIZATIONS IN NUCLEAR FUSION MARKET
- 6.7.3 CASE STUDIES RELATED TO AI/GEN AI IMPLEMENTATION IN NUCLEAR FUSION MARKET
- 6.7.4 INTERCONNECTED ECOSYSTEM AND IMPACT ON MARKET PLAYERS
- 6.7.5 CLIENTS' READINESS TO ADOPT AI/GEN AI-INTEGRATED NUCLEAR FUSION PROJECTS
- 6.8 SUCCESS STORIES AND REAL-WORLD APPLICATIONS
7 REGULATORY LANDSCAPE AND SUSTAINABILITY INITIATIVES
- 7.1 REGIONAL REGULATIONS AND COMPLIANCE
- 7.1.1 REGULATORY BODIES, GOVERNMENT AGENCIES, AND OTHER ORGANIZATIONS
- 7.1.2 CODES AND REGULATIONS
- 7.1.3 INDUSTRY STANDARDS
- 7.2 SUSTAINABILITY INITIATIVES
- 7.2.1 CARBON IMPACT REDUCTION
- 7.2.2 ECO-APPLICATIONS
- 7.3 IMPACT OF REGULATORY POLICIES ON SUSTAINABILITY INITIATIVES
- 7.4 CERTIFICATIONS, LABELING, AND ECO-STANDARDS
8 CUSTOMER LANDSCAPE AND BUYER BEHAVIOR
- 8.1 DECISION-MAKING PROCESS
- 8.2 KEY STAKEHOLDERS INVOLVED IN BUYING PROCESS AND EVALUATION CRITERIA
- 8.2.1 KEY STAKEHOLDERS IN BUYING PROCESS
- 8.2.2 BUYING CRITERIA
- 8.3 ADOPTION BARRIERS AND INTERNAL CHALLENGES
- 8.4 UNMET NEEDS OF VARIOUS END USERS
- 8.5 MARKET PROFITABILITY
9 NUCLEAR FUSION MARKET, BY FUEL
- 9.1 INTRODUCTION
- 9.2 DEUTERIUM-TRITIUM
- 9.2.1 ABILITY TO PRODUCE HIGH-ENERGY OUTPUT TO DRIVE ADOPTION
- 9.3 DEUTERIUM-DEUTERIUM
- 9.3.1 ABUNDANCE AND LONG-TERM COMMERCIAL POTENTIAL AND SUSTAINABILITY TO FUEL SEGMENTAL GROWTH
- 9.4 PROTON-BORON
- 9.4.1 POTENTIAL TO IMPROVE SAFETY AND MAINTENANCE PROTOCOLS OF FUSION POWER SYSTEMS TO FACILITATE SEGMENTAL GROWTH
- 9.5 DEUTERIUM-HELIUM-3
- 9.5.1 RISING IMPORTANCE OF REDUCED RADIATION DAMAGE AND IMPROVED OPERATIONAL SAFETY TO SUPPORT SEGMENTAL GROWTH
10 NUCLEAR FUSION MARKET, BY TECHNOLOGY
- 10.1 INTRODUCTION
- 10.2 MAGNETIC CONFINEMENT
- 10.2.1 IMPROVED PLASMA STABILITY AND SUPERCONDUCTING MAGNET PERFORMANCE TO SPIKE DEMAND
- 10.3 INERTIAL CONFINEMENT
- 10.3.1 PROFICIENCY IN CREATING FUSION REACTION THROUGH RAPID COMPRESSION AND HIGH ENERGY DENSITY TO PROPEL MARKET
- 10.4 OTHER TECHNOLOGIES
11 NUCLEAR FUSION MARKET, BY END USER
- 11.1 INTRODUCTION
- 11.2 UTILITIES
- 11.2.1 STRONG FOCUS ON ENERGY SECURITY, GRID RELIABILITY, AND CARBON REDUCTION TO ACCELERATE DEMAND
- 11.3 NATIONAL LABORATORIES & RESEARCH INSTITUTES
- 11.3.1 SIGNIFICANT GOVERNMENT FUNDING TO SUPPORT PUBLIC AND PRIVATE FUSION PROGRAMS TO CREATE GROWTH OPPORTUNITIES
- 11.4 INDUSTRIAL USERS
- 11.4.1 PRESSING NEED TO REDUCE EMISSIONS AND MAINTAIN OPERATIONAL RELIABILITY TO FUEL MARKET GROWTH
- 11.5 OTHER END USERS
12 NUCLEAR FUSION MARKET, BY REGION
- 12.1 INTRODUCTION
- 12.2 NORTH AMERICA
- 12.2.1 US
- 12.2.1.1 Growing government, private, and corporate support for fusion energy to reinforce market growth
- 12.2.2 CANADA
- 12.2.2.1 Expertise in tritium management to drive market
- 12.2.1 US
- 12.3 ASIA PACIFIC
- 12.3.1 CHINA
- 12.3.1.1 State-directed fusion industrialization at unprecedented scale to accelerate demand
- 12.3.2 JAPAN
- 12.3.2.1 Investment of utilities in fusion power generation to create lucrative growth opportunities
- 12.3.3 SOUTH KOREA
- 12.3.3.1 Government-led roadmap for fusion pilot plant development to support market expansion
- 12.3.4 REST OF ASIA PACIFIC
- 12.3.1 CHINA
- 12.4 EUROPE
- 12.4.1 SWEDEN
- 12.4.1.1 Academic research on plasma physics, materials science, and advanced reactor simulation to contribute to market growth
- 12.4.2 FRANCE
- 12.4.2.1 Significant contribution in plasma management projects to facilitate market
- 12.4.3 UK
- 12.4.3.1 Government investment in STEP prototype reactor program to fuel market growth
- 12.4.4 REST OF EUROPE
- 12.4.1 SWEDEN
- 12.5 ROW
- 12.5.1 MIDDLE EAST & AFRICA
- 12.5.1.1 Inclination toward innovation and R&D in new clean energy solutions to drive market
- 12.5.2 SOUTH AMERICA
- 12.5.2.1 Adoption of clean energy strategy and participation in nuclear technology development projects to strengthen market expansion
- 12.5.1 MIDDLE EAST & AFRICA
13 COMPETITIVE LANDSCAPE
- 13.1 OVERVIEW
- 13.2 KEY PLAYER COMPETITIVE STRATEGIES/RIGHT TO WIN, 2022-2026
- 13.3 MARKET RANKING
- 13.4 COMPANY EVALUATION MATRIX: KEY PLAYERS, 2025
- 13.4.1 STARS
- 13.4.2 EMERGING LEADERS
- 13.4.3 PERVASIVE PLAYERS
- 13.4.4 PARTICIPANTS
- 13.4.5 COMPANY FOOTPRINT: KEY PLAYERS, 2025
- 13.4.5.1 Region footprint
- 13.4.5.2 Fuel footprint
- 13.4.5.3 Technology footprint
- 13.4.5.4 End user footprint
- 13.5 COMPANY EVALUATION MATRIX: STARTUPS/SMES, 2025
- 13.5.1 PROGRESSIVE COMPANIES
- 13.5.2 RESPONSIVE COMPANIES
- 13.5.3 DYNAMIC COMPANIES
- 13.5.4 STARTING BLOCKS
- 13.5.5 COMPETITIVE BENCHMARKING: STARTUPS/SMES, 2025
- 13.5.5.1 Detailed list of key startups/SMEs
- 13.5.5.2 Competitive benchmarking of startups/SMEs
- 13.6 COMPANY BRAND/PRODUCT COMPARISON
- 13.6.1 COMMONWEALTH FUSION SYSTEMS (US)
- 13.6.2 HELION (US)
- 13.6.3 TAE TECHNOLOGIES (US)
- 13.6.4 TOKAMAK ENERGY (UK)
- 13.6.5 GENERAL FUSION (CANADA)
- 13.7 COMPETITIVE SCENARIO
- 13.7.1 PRODUCT LAUNCHES
- 13.7.2 DEALS
- 13.7.3 EXPANSIONS
- 13.7.4 OTHER DEVELOPMENTS
14 COMPANY PROFILES
- 14.1 KEY PLAYERS
- 14.1.1 COMMONWEALTH FUSION SYSTEMS
- 14.1.1.1 Business overview
- 14.1.1.2 Products/Solutions/Services offered
- 14.1.1.3 Recent developments
- 14.1.1.3.1 Deals
- 14.1.1.3.2 Expansions
- 14.1.1.3.3 Other developments
- 14.1.1.4 MnM view
- 14.1.1.4.1 Key strengths/Right to win
- 14.1.1.4.2 Strategic choices
- 14.1.1.4.3 Weaknesses/Competitive threats
- 14.1.2 HELION
- 14.1.2.1 Business overview
- 14.1.2.2 Products/Solutions/Services offered
- 14.1.2.3 Recent developments
- 14.1.2.3.1 Deals
- 14.1.2.3.2 Expansions
- 14.1.2.4 MnM view
- 14.1.2.4.1 Key strengths/Right to win
- 14.1.2.4.2 Strategic choices
- 14.1.2.4.3 Weaknesses/Competitive threats
- 14.1.3 TAE TECHNOLGIES
- 14.1.3.1 Business overview
- 14.1.3.2 Products/Solutions/Services offered
- 14.1.3.3 Recent developments
- 14.1.3.3.1 Deals
- 14.1.3.3.2 Expansions
- 14.1.3.3.3 Other developments
- 14.1.3.4 MnM view
- 14.1.3.4.1 Key strengths/Right to win
- 14.1.3.4.2 Strategic choices
- 14.1.3.4.3 Weaknesses/Competitive threats
- 14.1.4 TOKAMAK ENERGY
- 14.1.4.1 Business overview
- 14.1.4.2 Products/Solutions/Services offered
- 14.1.4.3 Recent developments
- 14.1.4.3.1 Deals
- 14.1.4.3.2 Expansions
- 14.1.4.4 MnM view
- 14.1.4.4.1 Key strengths/Right to win
- 14.1.4.4.2 Strategic choices
- 14.1.4.4.3 Weaknesses/Competitive threats
- 14.1.5 GENERAL FUSION
- 14.1.5.1 Business overview
- 14.1.5.2 Products/Solutions/Services offered
- 14.1.5.3 Recent developments
- 14.1.5.3.1 Expansions
- 14.1.5.3.2 Other developments
- 14.1.5.4 MnM view
- 14.1.5.4.1 Key strengths/Right to win
- 14.1.5.4.2 Strategic choices
- 14.1.5.4.3 Weaknesses/Competitive threats
- 14.1.6 ZAP ENERGY
- 14.1.6.1 Business overview
- 14.1.6.2 Products/Solutions/Services offered
- 14.1.6.3 Recent developments
- 14.1.6.3.1 Deals
- 14.1.6.3.2 Expansions
- 14.1.6.3.3 Other developments
- 14.1.7 FIRST LIGHT FUSION
- 14.1.7.1 Business overview
- 14.1.7.2 Products/Solutions/Services offered
- 14.1.7.3 Recent developments
- 14.1.7.3.1 Deals
- 14.1.7.3.2 Other developments
- 14.1.8 LOCKHEED MARTIN
- 14.1.8.1 Business overview
- 14.1.8.2 Products/Solutions/Services offered
- 14.1.9 MARVEL FUSION
- 14.1.9.1 Business overview
- 14.1.9.2 Products/Solutions/Services offered
- 14.1.9.3 Recent developments
- 14.1.9.3.1 Product Launches
- 14.1.9.3.2 Deals
- 14.1.9.3.3 Other developments
- 14.1.10 HB11 ENERGY HOLDINGS PTY LTD
- 14.1.10.1 Business overview
- 14.1.10.2 Products/Solutions/Services offered
- 14.1.10.3 Recent developments
- 14.1.10.3.1 Deals
- 14.1.10.3.2 Expansions
- 14.1.11 FOCUSED ENERGY INC.
- 14.1.11.1 Business overview
- 14.1.11.2 Products/Solutions/Services offered
- 14.1.11.3 Recent development
- 14.1.11.3.1 Deals
- 14.1.12 PROXIMA FUSION
- 14.1.12.1 Business overview
- 14.1.12.2 Products/Solutions/Services offered
- 14.1.12.3 Recent developments
- 14.1.12.3.1 Product launches
- 14.1.12.3.2 Deals
- 14.1.12.3.3 Other developments
- 14.1.13 RENAISSANCE FUSION
- 14.1.13.1 Business overview
- 14.1.13.2 Products/Solutions/Services offered
- 14.1.14 OPENSTAR TECHNOLOGIES LIMITED
- 14.1.14.1 Business overview
- 14.1.14.2 Products/Solutions/Services offered
- 14.1.14.3 Recent developments
- 14.1.14.3.1 Deals
- 14.1.15 PULSAR FUSION
- 14.1.15.1 Business overview
- 14.1.15.2 Products/Solutions/Services offered
- 14.1.15.3 Recent developments
- 14.1.15.3.1 Product launches
- 14.1.16 THEA ENERGY
- 14.1.16.1 Business overview
- 14.1.16.2 Products/Solutions/Services offered
- 14.1.16.3 Recent developments
- 14.1.16.3.1 Expansions
- 14.1.17 XCIMER ENERGY
- 14.1.17.1 Business overview
- 14.1.17.2 Products/Solutions/Services offered
- 14.1.17.3 Recent developments
- 14.1.17.3.1 Expansions
- 14.1.18 TYPE ONE ENERGY
- 14.1.18.1 Business overview
- 14.1.18.2 Products/Solutions/Services offered
- 14.1.18.3 Recent developments
- 14.1.18.3.1 Product launches
- 14.1.18.3.2 Deals
- 14.1.18.3.3 Expansions
- 14.1.19 GAUSS FUSION
- 14.1.19.1 Business overview
- 14.1.19.2 Products/Solutions/Services offered
- 14.1.19.3 Recent developments
- 14.1.19.3.1 Deals
- 14.1.20 HELICAL FUSION CO., LTD.
- 14.1.20.1 Business overview
- 14.1.20.2 Products/Solutions/Services offered
- 14.1.20.3 Recent developments
- 14.1.20.3.1 Deals
- 14.1.1 COMMONWEALTH FUSION SYSTEMS
- 14.2 OTHER PLAYERS
- 14.2.1 SHINE TECHNOLOGIES
- 14.2.2 ALPHA RING
- 14.2.3 REALTA FUSION
- 14.2.4 NOVATRON FUSION GROUP AB
- 14.2.5 NT-TAO LTD.
15 RESEARCH METHODOLOGY
- 15.1 RESEARCH DATA
- 15.1.1 SECONDARY DATA
- 15.1.1.1 List of key secondary sources
- 15.1.1.2 Key data from secondary sources
- 15.1.2 PRIMARY DATA
- 15.1.2.1 Key data from primary sources
- 15.1.2.2 List of primary interview participants
- 15.1.2.3 Key industry insights
- 15.1.2.4 Breakdown of primary interviews
- 15.1.1 SECONDARY DATA
- 15.2 MARKET SIZE ESTIMATION
- 15.2.1 BOTTOM-UP APPROACH
- 15.2.2 TOP-DOWN APPROACH
- 15.3 MARKET SIZE CALCULATION FOR BASE YEAR
- 15.3.1 DEMAND-SIDE ANALYSIS
- 15.3.1.1 Demand-side assumptions
- 15.3.1.2 Demand-side calculations
- 15.3.1 DEMAND-SIDE ANALYSIS
- 15.4 MARKET FORECAST APPROACH
- 15.4.1 DEMAND SIDE
- 15.5 DATA TRIANGULATION
- 15.6 FACTOR ANALYSIS
- 15.7 RESEARCH ASSUMPTIONS AND LIMITATIONS
- 15.8 RISK ANALYSIS
16 APPENDIX
- 16.1 INSIGHTS FROM INDUSTRY EXPERTS
- 16.2 DISCUSSION GUIDE
- 16.3 KNOWLEDGESTORE: MARKETSANDMARKETS' SUBSCRIPTION PORTAL
- 16.4 CUSTOMIZATION OPTIONS
- 16.5 RELATED REPORTS
- 16.6 AUTHOR DETAILS
List of Tables
- TABLE 1 NUCLEAR FUSION MARKET: INCLUSIONS AND EXCLUSIONS
- TABLE 2 INTERCONNECTED MARKETS
- TABLE 3 STRATEGIC FOCUS OF TIER 1/2/3 PLAYERS
- TABLE 4 IMPACT OF PORTER'S FIVE FORCES ANALYSIS, 2025
- TABLE 5 GDP PERCENTAGE CHANGE, BY KEY COUNTRY, 2021-2029
- TABLE 6 ROLE OF COMPANIES IN NUCLEAR FUSION ECOSYSTEM
- TABLE 7 LIST OF KEY CONFERENCES AND EVENTS, 2026-2027
- TABLE 8 NUCLEAR FUSION MARKET: INDICATIVE CAPEX RANGE, 2025 (USD MILLION/MW)
- TABLE 9 DEVELOPMENT OF SPARC TOKAMAK PROGRAM USING HIGH-TEMPERATURE SUPERCONDUCTING MAGNET TECHNOLOGY
- TABLE 10 COMMERCIALIZATION OF PULSED FUSION TECHNOLOGY FOR FUTURE CLEAN ELECTRICITY SUPPLY
- TABLE 11 DEVELOPMENT OF MODULAR COMPACT FUSION REACTORS FOR INDUSTRIAL AND UTILITY APPLICATIONS
- TABLE 12 US-ADJUSTED RECIPROCAL TARIFF RATES
- TABLE 13 LIST OF KEY PATENTS, 2022-2026
- TABLE 14 UTILITIES & POWER GENERATION
- TABLE 15 INDUSTRIAL MANUFACTURING & HEAVY INDUSTRY
- TABLE 16 NATIONAL LABORATORIES & RESEARCH INSTITUTES
- TABLE 17 TOP USE CASES AND MARKET POTENTIAL
- TABLE 18 AI-RELATED USE CASES OF ORGANIZATIONS IN NUCLEAR FUSION MARKET
- TABLE 19 CASE STUDIES RELATED TO AI/GEN AI IMPLEMENTATION
- TABLE 20 INTERCONNECTED ECOSYSTEM AND IMPACT ON MARKET PLAYERS
- TABLE 21 NORTH AMERICA: REGULATORY BODIES, GOVERNMENT AGENCIES, AND OTHER ORGANIZATIONS
- TABLE 22 EUROPE: REGULATORY BODIES, GOVERNMENT AGENCIES, AND OTHER ORGANIZATIONS
- TABLE 23 ASIA PACIFIC: REGULATORY BODIES, GOVERNMENT AGENCIES, AND OTHER ORGANIZATIONS
- TABLE 24 ROW: REGULATORY BODIES, GOVERNMENT AGENCIES, AND OTHER ORGANIZATIONS
- TABLE 25 CODES AND REGULATIONS
- TABLE 26 NUCLEAR FUSION STANDARDS
- TABLE 27 CERTIFICATIONS, LABELING, AND ECO-STANDARDS
- TABLE 28 INFLUENCE OF KEY STAKEHOLDERS ON BUYING PROCESS FOR KEY END USERS
- TABLE 29 KEY BUYING CRITERIA FOR KEY END USERS
- TABLE 30 UNMET NEEDS, BY END USER
- TABLE 31 NUCLEAR FUSION MARKET, BY FUEL, 2023-2025 (USD MILLION)
- TABLE 32 NUCLEAR FUSION MARKET, BY FUEL, 2026-2031 (USD MILLION)
- TABLE 33 DEUTERIUM-TRITIUM: NUCLEAR FUSION MARKET, BY REGION, 2023-2025 (USD MILLION)
- TABLE 34 DEUTERIUM-TRITIUM: NUCLEAR FUSION MARKET, BY REGION, 2026-2031 (USD MILLION)
- TABLE 35 DEUTERIUM-DEUTERIUM: NUCLEAR FUSION MARKET, BY REGION, 2023-2025 (USD MILLION)
- TABLE 36 DEUTERIUM-DEUTERIUM: NUCLEAR FUSION MARKET, BY REGION, 2026-2031 (USD MILLION)
- TABLE 37 PROTON-BORON: NUCLEAR FUSION MARKET, BY REGION, 2023-2025 (USD MILLION)
- TABLE 38 PROTON-BORON: NUCLEAR FUSION MARKET, BY REGION, 2026-2031 (USD MILLION)
- TABLE 39 DEUTERIUM-HELIUM-3: NUCLEAR FUSION MARKET, BY REGION, 2023-2025 (USD MILLION)
- TABLE 40 DEUTERIUM-HELIUM-3: NUCLEAR FUSION MARKET, BY REGION, 2026-2031 (USD MILLION)
- TABLE 41 NUCLEAR FUSION MARKET, BY TECHNOLOGY, 2023-2025 (USD MILLION)
- TABLE 42 NUCLEAR FUSION MARKET, BY TECHNOLOGY, 2026-2031 (USD MILLION)
- TABLE 43 MAGNETIC CONFINEMENT: NUCLEAR FUSION MARKET, BY REGION, 2023-2025 (USD MILLION)
- TABLE 44 MAGNETIC CONFINEMENT: NUCLEAR FUSION MARKET, BY REGION, 2026-2031 (USD MILLION)
- TABLE 45 INERTIAL CONFINEMENT: NUCLEAR FUSION MARKET, BY REGION, 2023-2025 (USD MILLION)
- TABLE 46 INERTIAL CONFINEMENT: NUCLEAR FUSION MARKET, BY REGION, 2026-2031 (USD MILLION)
- TABLE 47 OTHER TECHNOLOGIES: NUCLEAR FUSION MARKET, BY REGION, 2023-2025 (USD MILLION)
- TABLE 48 OTHER TECHNOLOGIES: NUCLEAR FUSION MARKET, BY REGION, 2026-2031 (USD MILLION)
- TABLE 49 NUCLEAR FUSION MARKET, BY END USER, 2023-2025 (USD MILLION)
- TABLE 50 NUCLEAR FUSION MARKET, BY END USER, 2026-2031 (USD MILLION)
- TABLE 51 UTILITIES: NUCLEAR FUSION MARKET, BY REGION, 2023-2025 (USD MILLION)
- TABLE 52 UTILITIES: NUCLEAR FUSION MARKET, BY REGION, 2026-2031 (USD MILLION)
- TABLE 53 NATIONAL LABORATORIES & RESEARCH INSTITUTES: NUCLEAR FUSION MARKET, BY REGION, 2023-2025 (USD MILLION)
- TABLE 54 NATIONAL LABORATORIES & RESEARCH INSTITUTES: NUCLEAR FUSION MARKET, BY REGION, 2026-2031 (USD MILLION)
- TABLE 55 INDUSTRIAL USERS: NUCLEAR FUSION MARKET, BY REGION, 2023-2025 (USD MILLION)
- TABLE 56 INDUSTRIAL USERS: NUCLEAR FUSION MARKET, BY REGION, 2026-2031 (USD MILLION)
- TABLE 57 OTHER END USERS: NUCLEAR FUSION MARKET, BY REGION, 2023-2025 (USD MILLION)
- TABLE 58 OTHER END USERS: NUCLEAR FUSION MARKET, BY REGION, 2026-2031 (USD MILLION)
- TABLE 59 NUCLEAR FUSION MARKET, BY REGION, 2023-2025 (USD MILLION)
- TABLE 60 NUCLEAR FUSION MARKET, BY REGION, 2026-2031 (USD MILLION)
- TABLE 61 NUCLEAR FUSION MARKET, BY CAPACITY, 2023-2025 (MW)
- TABLE 62 NUCLEAR FUSION MARKET, BY CAPACITY, 2026-2031 (MW)
- TABLE 63 NORTH AMERICA: NUCLEAR FUSION MARKET, BY COUNTRY, 2023-2025 (USD MILLION)
- TABLE 64 NORTH AMERICA: NUCLEAR FUSION MARKET, BY COUNTRY, 2026-2031 (USD MILLION)
- TABLE 65 NORTH AMERICA: NUCLEAR FUSION MARKET, BY FUEL, 2023-2025 (USD MILLION)
- TABLE 66 NORTH AMERICA: NUCLEAR FUSION MARKET, BY FUEL, 2026-2031 (USD MILLION)
- TABLE 67 NORTH AMERICA: NUCLEAR FUSION MARKET, BY TECHNOLOGY, 2023-2025 (USD MILLION)
- TABLE 68 NORTH AMERICA: NUCLEAR FUSION MARKET, BY TECHNOLOGY, 2026-2031 (USD MILLION)
- TABLE 69 NORTH AMERICA: NUCLEAR FUSION MARKET, BY END USER, 2023-2025 (USD MILLION)
- TABLE 70 NORTH AMERICA: NUCLEAR FUSION MARKET, BY END USER, 2026-2031 (USD MILLION)
- TABLE 71 US: NUCLEAR FUSION MARKET, BY END USER, 2023-2025 (USD MILLION)
- TABLE 72 US: NUCLEAR FUSION MARKET, BY END USER, 2026-2031 (USD MILLION)
- TABLE 73 CANADA: NUCLEAR FUSION MARKET, BY END USER, 2023-2025 (USD MILLION)
- TABLE 74 CANADA: NUCLEAR FUSION MARKET, BY END USER, 2026-2031 (USD MILLION)
- TABLE 75 ASIA PACIFIC: NUCLEAR FUSION MARKET, BY COUNTRY, 2023-2025 (USD MILLION)
- TABLE 76 ASIA PACIFIC: NUCLEAR FUSION MARKET, BY COUNTRY, 2026-2031 (USD MILLION)
- TABLE 77 ASIA PACIFIC: NUCLEAR FUSION MARKET, BY FUEL, 2023-2025 (USD MILLION)
- TABLE 78 ASIA PACIFIC: NUCLEAR FUSION MARKET, BY FUEL, 2026-2031 (USD MILLION)
- TABLE 79 ASIA PACIFIC: NUCLEAR FUSION MARKET, BY TECHNOLOGY, 2023-2025 (USD MILLION)
- TABLE 80 ASIA PACIFIC: NUCLEAR FUSION MARKET, BY TECHNOLOGY, 2026-2031 (USD MILLION)
- TABLE 81 ASIA PACIFIC: NUCLEAR FUSION MARKET, BY END USER, 2023-2025 (USD MILLION)
- TABLE 82 ASIA PACIFIC: NUCLEAR FUSION MARKET, BY END USER, 2026-2031 (USD MILLION)
- TABLE 83 CHINA: NUCLEAR FUSION MARKET, BY END USER, 2023-2025 (USD MILLION)
- TABLE 84 CHINA: NUCLEAR FUSION MARKET, BY END USER, 2026-2031 (USD MILLION)
- TABLE 85 JAPAN: NUCLEAR FUSION MARKET, BY END USER, 2023-2025 (USD MILLION)
- TABLE 86 JAPAN: NUCLEAR FUSION MARKET, BY END USER, 2026-2031 (USD MILLION)
- TABLE 87 SOUTH KOREA: NUCLEAR FUSION MARKET, BY END USER, 2023-2025 (USD MILLION)
- TABLE 88 SOUTH KOREA: NUCLEAR FUSION MARKET, BY END USER, 2026-2031 (USD MILLION)
- TABLE 89 REST OF ASIA PACIFIC: NUCLEAR FUSION MARKET, BY END USER, 2023-2025 (USD MILLION)
- TABLE 90 REST OF ASIA PACIFIC: NUCLEAR FUSION MARKET, BY END USER, 2026-2031 (USD MILLION)
- TABLE 91 EUROPE: NUCLEAR FUSION MARKET, BY COUNTRY, 2023-2025 (USD MILLION)
- TABLE 92 EUROPE: NUCLEAR FUSION MARKET, BY COUNTRY, 2026-2031 (USD MILLION)
- TABLE 93 EUROPE: NUCLEAR FUSION MARKET, BY FUEL, 2023-2025 (USD MILLION)
- TABLE 94 EUROPE: NUCLEAR FUSION MARKET, BY FUEL, 2026-2031 (USD MILLION)
- TABLE 95 EUROPE: NUCLEAR FUSION MARKET, BY TECHNOLOGY, 2023-2025 (USD MILLION)
- TABLE 96 EUROPE: NUCLEAR FUSION MARKET, BY TECHNOLOGY, 2026-2031 (USD MILLION)
- TABLE 97 EUROPE: NUCLEAR FUSION MARKET, BY END USER, 2023-2025 (USD MILLION)
- TABLE 98 EUROPE: NUCLEAR FUSION MARKET, BY END USER, 2026-2031 (USD MILLION)
- TABLE 99 SWEDEN: NUCLEAR FUSION MARKET, BY END USER, 2023-2025 (USD MILLION)
- TABLE 100 SWEDEN: NUCLEAR FUSION MARKET, BY END USER, 2026-2031 (USD MILLION)
- TABLE 101 FRANCE: NUCLEAR FUSION MARKET, BY END USER, 2023-2025 (USD MILLION)
- TABLE 102 FRANCE: NUCLEAR FUSION MARKET, BY END USER, 2026-2031 (USD MILLION)
- TABLE 103 UK: NUCLEAR FUSION MARKET, BY END USER, 2023-2025 (USD MILLION)
- TABLE 104 UK: NUCLEAR FUSION MARKET, BY END USER, 2026-2031 (USD MILLION)
- TABLE 105 REST OF EUROPE: NUCLEAR FUSION MARKET, BY END USER, 2023-2025 (USD MILLION)
- TABLE 106 REST OF EUROPE: NUCLEAR FUSION MARKET, BY END USER, 2026-2031 (USD MILLION)
- TABLE 107 ROW: NUCLEAR FUSION MARKET, BY REGION, 2023-2025 (USD MILLION)
- TABLE 108 ROW: NUCLEAR FUSION MARKET, BY REGION, 2026-2031 (USD MILLION)
- TABLE 109 ROW: NUCLEAR FUSION MARKET, BY FUEL, 2023-2025 (USD MILLION)
- TABLE 110 ROW: NUCLEAR FUSION MARKET, BY FUEL, 2026-2031 (USD MILLION)
- TABLE 111 ROW: NUCLEAR FUSION MARKET, BY TECHNOLOGY, 2023-2025 (USD MILLION)
- TABLE 112 ROW: NUCLEAR FUSION MARKET, BY TECHNOLOGY, 2026-2031 (USD MILLION)
- TABLE 113 ROW: NUCLEAR FUSION MARKET, BY END USER, 2023-2025 (USD MILLION)
- TABLE 114 ROW: NUCLEAR FUSION MARKET, BY END USER, 2026-2031 (USD MILLION)
- TABLE 115 MIDDLE EAST & AFRICA: NUCLEAR FUSION MARKET, BY END USER, 2023-2025 (USD MILLION)
- TABLE 116 MIDDLE EAST & AFRICA: NUCLEAR FUSION MARKET, BY END USER, 2026-2031 (USD MILLION)
- TABLE 117 SOUTH AMERICA: NUCLEAR FUSION MARKET, BY END USER, 2023-2025 (USD MILLION)
- TABLE 118 SOUTH AMERICA: NUCLEAR FUSION MARKET, BY END USER, 2026-2031 (USD MILLION)
- TABLE 119 NUCLEAR FUSION MARKET: OVERVIEW OF KEY STRATEGIES ADOPTED BY KEY PLAYERS, MAY 2022-APRIL 2026
- TABLE 120 NUCLEAR FUSION MARKET: REGION FOOTPRINT
- TABLE 121 NUCLEAR FUSION MARKET: FUEL FOOTPRINT
- TABLE 122 NUCLEAR FUSION MARKET: TECHNOLOGY FOOTPRINT
- TABLE 123 NUCLEAR FUSION MARKET: END USER FOOTPRINT
- TABLE 124 NUCLEAR FUSION MARKET: LIST OF KEY STARTUPS/SMES
- TABLE 125 NUCLEAR FUSION MARKET: COMPETITIVE BENCHMARKING OF STARTUPS/SMES
- TABLE 126 NUCLEAR FUSION MARKET: PRODUCT LAUNCHES, MAY 2022-APRIL 2026
- TABLE 127 NUCLEAR FUSION MARKET: DEALS, MAY 2022-APRIL 2026
- TABLE 128 NUCLEAR FUSION MARKET: EXPANSIONS, MAY 2022-APRIL 2026
- TABLE 129 NUCLEAR FUSION MARKET: OTHER DEVELOPMENTS, MAY 2022-APRIL 2026
- TABLE 130 COMMONWEALTH FUSION SYSTEMS: COMPANY OVERVIEW
- TABLE 131 COMMONWEALTH FUSION SYSTEMS: PRODUCTS/SOLUTIONS/SERVICES OFFERED
- TABLE 132 COMMONWEALTH FUSION SYSTEMS: DEALS
- TABLE 133 COMMONWEALTH FUSION SYSTEMS: EXPANSIONS
- TABLE 134 COMMONWEALTH FUSION SYSTEMS: OTHER DEVELOPMENTS
- TABLE 135 HELION: COMPANY OVERVIEW
- TABLE 136 HELION: PRODUCTS/SOLUTIONS/SERVICES OFFERED
- TABLE 137 HELION: DEALS
- TABLE 138 HELION: EXPANSIONS
- TABLE 139 TAE TECHNOLOGIES: COMPANY OVERVIEW
- TABLE 140 TAE TECHNOLOGIES: PRODUCTS/SOLUTIONS/SERVICES OFFERED
- TABLE 141 TAE TECHNOLOGIES: DEALS
- TABLE 142 TAE TECHNOLOGIES: EXPANSIONS
- TABLE 143 TAE TECHNOLOGIES: OTHER DEVELOPMENTS
- TABLE 144 TOKAMAK ENERGY: COMPANY OVERVIEW
- TABLE 145 TOKAMAK ENERGY: PRODUCTS/SOLUTIONS/SERVICES OFFERED
- TABLE 146 TOKAMAK ENERGY: DEALS
- TABLE 147 TOKAMAK ENERGY: EXPANSIONS
- TABLE 148 GENERAL FUSION: COMPANY OVERVIEW
- TABLE 149 GENERAL FUSION: PRODUCTS/SOLUTIONS/SERVICES OFFERED
- TABLE 150 GENERAL FUSION: EXPANSIONS
- TABLE 151 GENERAL FUSION: OTHER DEVELOPMENTS
- TABLE 152 ZAP ENERGY: COMPANY OVERVIEW
- TABLE 153 ZAP ENERGY: PRODUCTS/SOLUTIONS/SERVICES OFFERED
- TABLE 154 ZAP ENERGY: DEALS
- TABLE 155 ZAP ENERGY: EXPANSIONS
- TABLE 156 ZAP ENERGY: OTHER DEVELOPMENTS
- TABLE 157 FIRST LIGHT FUSION: COMPANY OVERVIEW
- TABLE 158 FIRST LIGHT FUSION: PRODUCTS/SOLUTIONS/SERVICES OFFERED
- TABLE 159 FIRST LIGHT FUSION: DEALS
- TABLE 160 FIRST LIGHT FUSION: OTHER DEVELOPMENTS
- TABLE 161 LOCKHEED MARTIN: COMPANY OVERVIEW
- TABLE 162 LOCKHEED MARTIN: PRODUCTS/SOLUTIONS/SERVICES OFFERED
- TABLE 163 MARVEL FUSION: COMPANY OVERVIEW
- TABLE 164 MARVEL FUSION: PRODUCTS/SOLUTIONS/SERVICES OFFERED
- TABLE 165 MARVEL FUSION: PRODUCT LAUNCHES
- TABLE 166 MARVEL FUSION: DEALS
- TABLE 167 MARVEL FUSION: OTHER DEVELOPMENTS
- TABLE 168 HB11 ENERGY HOLDINGS PTY LTD: COMPANY OVERVIEW
- TABLE 169 HB11 ENERGY HOLDINGS PTY LTD: PRODUCTS/SOLUTIONS/SERVICES OFFERED
- TABLE 170 HB11 ENERGY HOLDINGS PTY LTD: DEALS
- TABLE 171 HB11 ENERGY HOLDINGS PTY LTD: EXPANSIONS
- TABLE 172 FOCUSED ENERGY INC.: COMPANY OVERVIEW
- TABLE 173 FOCUSED ENERGY INC.: PRODUCTS/SOLUTIONS/SERVICES OFFERED
- TABLE 174 FOCUSED ENERGY INC.: DEALS
- TABLE 175 PROXIMA FUSION: COMPANY OVERVIEW
- TABLE 176 PROXIMA FUSION: PRODUCTS/SOLUTIONS/SERVICES OFFERED
- TABLE 177 PROXIMA FUSION: PRODUCT LAUNCHES
- TABLE 178 PROXIMA FUSION: DEALS
- TABLE 179 PROXIMA FUSION: OTHER DEVELOPMENTS
- TABLE 180 RENAISSANCE FUSION: COMPANY OVERVIEW
- TABLE 181 RENAISSANCE FUSION: PRODUCTS/SOLUTIONS/SERVICES OFFERED
- TABLE 182 OPENSTAR TECHNOLOGIES LIMITED: COMPANY OVERVIEW
- TABLE 183 OPENSTAR TECHNOLOGIES LIMITED: PRODUCTS/SOLUTIONS/SERVICES OFFERED
- TABLE 184 OPENSTAR TECHNOLOGIES LIMITED: DEALS
- TABLE 185 PULSAR FUSION: COMPANY OVERVIEW
- TABLE 186 PULSAR FUSION: PRODUCTS/SOLUTIONS/SERVICES OFFERED
- TABLE 187 PULSAR FUSION: PRODUCT LAUNCHES
- TABLE 188 THEA ENERGY: COMPANY OVERVIEW
- TABLE 189 THEA ENERGY: PRODUCTS/SOLUTIONS/SERVICES OFFERED
- TABLE 190 THEA ENERGY: EXPANSIONS
- TABLE 191 XCIMER ENERGY: COMPANY OVERVIEW
- TABLE 192 XCIMER ENERGY: PRODUCTS/SOLUTIONS/SERVICES OFFERED
- TABLE 193 XCIMER ENERGY: EXPANSIONS
- TABLE 194 TYPE ONE ENERGY: COMPANY OVERVIEW
- TABLE 195 TYPE ONE ENERGY: PRODUCTS/SOLUTIONS/SERVICES OFFERED
- TABLE 196 TYPE ONE ENERGY: PRODUCT LAUNCHES
- TABLE 197 TYPE ONE ENERGY: DEALS
- TABLE 198 TYPE ONE ENERGY: EXPANSIONS
- TABLE 199 GAUSS FUSION: COMPANY OVERVIEW
- TABLE 200 GAUSS FUSION: PRODUCTS/SOLUTIONS/SERVICES OFFERED
- TABLE 201 GAUSS FUSION: DEALS
- TABLE 202 HELICAL FUSION CO., LTD.: COMPANY OVERVIEW
- TABLE 203 HELICAL FUSION CO., LTD.: PRODUCTS/SOLUTIONS/SERVICES OFFERED
- TABLE 204 HELICAL FUSION CO., LTD.: DEALS
- TABLE 205 SHINE TECHNOLOGIES: COMPANY OVERVIEW
- TABLE 206 ALPHA RING: COMPANY OVERVIEW
- TABLE 207 REALTA FUSION: COMPANY OVERVIEW
- TABLE 208 NOVATRON FUSION GROUP AB: COMPANY OVERVIEW
- TABLE 209 NT-TAO LTD.: COMPANY OVERVIEW
- TABLE 210 MAJOR SECONDARY SOURCES
- TABLE 211 DATA CAPTURED FROM PRIMARY SOURCES
- TABLE 212 PRIMARY INTERVIEW PARTICIPANTS, BY COMPANY
- TABLE 213 NUCLEAR FUSION MARKET: RESEARCH ASSUMPTIONS AND LIMITATIONS
- TABLE 214 NUCLEAR FUSION MARKET: RISK ANALYSIS
List of Figures
- FIGURE 1 MARKETS COVERED AND REGIONAL SCOPE
- FIGURE 2 NUCLEAR FUSION MARKET: DURATION CONSIDERED
- FIGURE 3 NUCLEAR FUSION MARKET SCENARIO
- FIGURE 4 GLOBAL NUCLEAR FUSION MARKET, 2023-2031
- FIGURE 5 MAJOR STRATEGIES ADOPTED BY KEY PLAYERS IN NUCLEAR FUSION MARKET, 2022-2026
- FIGURE 6 DISRUPTIONS IMPACTING GROWTH OF NUCLEAR FUSION MARKET
- FIGURE 7 HIGH-GROWTH SEGMENTS IN NUCLEAR FUSION MARKET, 2026-2031
- FIGURE 8 NORTH AMERICA TO EXHIBIT HIGHEST GROWTH RATE IN NUCLEAR FUSION MARKET DURING FORECAST PERIOD
- FIGURE 9 RISING DEMAND FOR CLEAN ENERGY TO DRIVE NUCLEAR FUSION MARKET
- FIGURE 10 ASIA PACIFIC TO EXHIBIT SECOND-HIGHEST CAGR IN NUCLEAR FUSION MARKET BETWEEN 2026 AND 2031
- FIGURE 11 US AND DEUTERIUM-TRITIUM DOMINATED NUCLEAR FUSION MARKET IN 2025
- FIGURE 12 MAGNETIC CONFINEMENT SEGMENT TO ACCOUNT FOR LARGEST MARKET SHARE IN 2031
- FIGURE 13 DEUTERIUM-TRITIUM SEGMENT TO CAPTURE LARGEST MARKET SHARE IN 2031
- FIGURE 14 NATIONAL LABORATORIES & RESEARCH INSTITUTES TO LEAD MARKET IN 2031
- FIGURE 15 EUROPE TO HOLD PROMINENT SHARE OF NUCLEAR FUSION MARKET IN 2031
- FIGURE 16 NUCLEAR FUSION MARKET: DRIVERS, RESTRAINTS, OPPORTUNITIES, AND CHALLENGES
- FIGURE 17 GLOBAL DATA CENTER ELECTRICITY CONSUMPTION UNDER IEA SCENARIOS (TWH)
- FIGURE 18 PROJECTED COST RANGE OF NUCLEAR FUSION VERSUS CONVENTIONAL AND RENEWABLE ENERGY SOURCES
- FIGURE 19 PORTER'S FIVE FORCES ANALYSIS
- FIGURE 20 SUPPLY CHAIN ANALYSIS
- FIGURE 21 NUCLEAR FUSION ECOSYSTEM
- FIGURE 22 TRENDS/DISRUPTIONS INFLUENCING CUSTOMER BUSINESS
- FIGURE 23 FUNDING RAISED BY TOP PLAYERS IN NUCLEAR FUSION MARKET, 2021-2024
- FIGURE 24 PATENTS APPLIED AND GRANTED, 2016-2025
- FIGURE 25 FUTURE APPLICATIONS OF NUCLEAR FUSION TECHNOLOGY
- FIGURE 26 SUCCESS STORIES AND REAL-WORLD APPLICATIONS OF FUSION TECHNOLOGY
- FIGURE 27 DECISION-MAKING FACTORS
- FIGURE 28 INFLUENCE OF KEY STAKEHOLDERS ON BUYING PROCESS FOR MAJOR END USERS
- FIGURE 29 KEY BUYING CRITERIA FOR MAJOR END USERS
- FIGURE 30 NUCLEAR FUSION MARKET SHARE, BY FUEL, 2025
- FIGURE 31 NUCLEAR FUSION MARKET SHARE, BY TECHNOLOGY, 2025
- FIGURE 32 NUCLEAR FUSION MARKET SHARE, BY END USER, 2025
- FIGURE 33 NORTH AMERICA TO EXHIBIT HIGHEST CAGR IN NUCLEAR FUSION MARKET FROM 2026 TO 2031
- FIGURE 34 NORTH AMERICA: NUCLEAR FUSION MARKET SNAPSHOT
- FIGURE 35 ASIA PACIFIC: NUCLEAR FUSION MARKET SNAPSHOT
- FIGURE 36 ACTIVE PLAYERS IN NUCLEAR FUSION MARKET, 2025
- FIGURE 37 NUCLEAR FUSION MARKET: COMPANY EVALUATION MATRIX (KEY PLAYERS), 2025
- FIGURE 38 NUCLEAR FUSION MARKET: COMPANY FOOTPRINT
- FIGURE 39 NUCLEAR FUSION MARKET: COMPANY EVALUATION MATRIX (STARTUPS/SMES), 2025
- FIGURE 40 BRAND/PRODUCT COMPARISON OF KEY VENDORS
- FIGURE 41 LOCKHEED MARTIN: COMPANY SNAPSHOT
- FIGURE 42 NUCLEAR FUSION MARKET: RESEARCH DESIGN
- FIGURE 43 DATA CAPTURED FROM SECONDARY SOURCES
- FIGURE 44 CORE FINDINGS FROM INDUSTRY EXPERTS
- FIGURE 45 BREAKDOWN OF PRIMARY INTERVIEWS: BY COMPANY TYPE, DESIGNATION, AND REGION
- FIGURE 46 NUCLEAR FUSION MARKET: BOTTOM-UP APPROACH
- FIGURE 47 NUCLEAR FUSION MARKET: TOP-DOWN APPROACH
- FIGURE 48 NUCLEAR FUSION MARKET: DEMAND-SIDE ANALYSIS
- FIGURE 49 NUCLEAR FUSION MARKET: DEMAND-SIDE CALCULATIONS
- FIGURE 50 NUCLEAR FUSION MARKET: DATA TRIANGULATION
- FIGURE 51 NUCLEAR FUSION MARKET: FACTOR ANALYSIS

