PUBLISHER: MarketsandMarkets | PRODUCT CODE: 2174820

PUBLISHER: MarketsandMarkets | PRODUCT CODE: 2174820
Smart Water Meter Market by Technology, Meter Type, Component, Application, and Region - Global Forecast to 2031
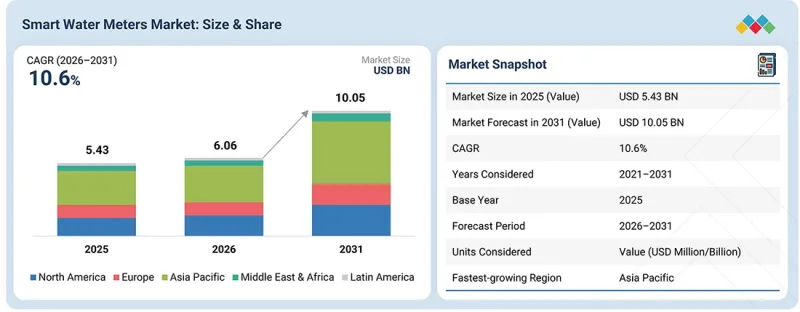
The smart water meter market is projected to grow from USD 6.06 billion in 2026 to USD 10.05 billion by 2031, at a CAGR of 10.6% during the forecast period. The market for smart water meters is predicted to experience significant growth during the projected period as the demand for water conservation, reduction of non-revenue water, and modernization of the increasingly aging water distribution system is growing. Water utilities and municipalities are progressively using smart meters to retrieve precise and on-time measurements of consumption, spot leaks, facilitate billing process, and monitor water usage remotely.
| Scope of the Report | |
|---|---|
| Years Considered for the Study | 2021-2031 |
| Base Year | 2025 |
| Forecast Period | 2026-2031 |
| Units Considered | Value (USD Million/Billion) |
| Segments | Technology, Meter Type, Application |
| Regions covered | North America, South America, Europe, Asia Pacific, Middle East & Africa |
Moreover, the necessity to enhance operational efficiency, reinforce water resources management, and implement automatic reading of meters and advanced metering infrastructure will further enhance the demand for IoT-enabled technologies and solutions, including ultrasonic, electromagnetic, and smart mechanical meters.
"Ultrasonic meters, by technology, are expected to maintain their leading position throughout the forecast period."
It is anticipated that ultrasonic meters will continue to be a leading technology in the smart water meter market due to their excellent accuracy in measurement, lack of moving parts, and ability to continuously and remotely monitor water usage. Ultrasonic meters use acoustic signals to measure water flow based on which it can measure accurately irrespective of the fluctuation in water flow and minimize wear and tear on the equipment. The widespread adoption of AMR and AMI communication technologies allows ultrasonic meters to send cities the recorded usage remotely. The growth in water management, reduced non-revenue water use, and upgrading of very old infrastructure will ensure increased demand of ultrasonic smart water meters in particular for residential, commercial, and municipal applications.
"Water utilities, by application, are expected to maintain their leading position throughout the forecast period."
Water utilities are predicted to see the rapid adoption of smart water meters as urban and utility operators are placing more emphasis on the efficiency of water delivery, reducing non-revenue water and enhancing water consumption management. Water utilities rely on accurate monitoring for billing accuracy, consumption monitoring, detection of leakages, and management of water usage in the distribution network. Smart water meters with AMR and AMI technologies allow utilities to read their meters remotely, track unusual water usage, and monitor the number of meters efficiently. Furthermore, the active introduction of smart water meters is being supported by the overall need to modernize the outdated water supply system, implement water saving schemes, and improve efficiency in operations. Increasing number of connected water networks and remote monitoring supported by data analytics is expected to further boost the demand for smart water meters in the utilities applications.
Breakdown of Primaries
In-depth interviews with key industry participants, subject-matter experts, C-level executives of key market players, and directors, among other experts, were conducted to obtain and verify critical qualitative and quantitative information, as well as to assess future market prospects. The primary interviews were distributed as follows:
By Company Type: Tier 1- 65%, Tier 2 - 24%, and Tier 3 - 11%
By Designation: C-Level Executives - 30%, Directors - 25%, Others - 45%
By Region: North America - 20%, Europe - 25%, Asia Pacific - 30%, Middle East & Africa - 10%, South and Central America - 15%.
Note: Others include sales managers, engineers, and regional managers.
Tier 1 company: revenue > USD 5 billion; tier 2 company: revenue between USD 1 and USD 5 billion; and tier 3 company: revenue < USD 1 billion in 2025
Well-established metering technology companies and smart water meter manufacturers predominantly govern the smart water meter market. Key players profiled in the report include Badger Meter, Inc. (US), Kamstrup (Denmark), Diehl Stiftung & Co. KG (Germany), Landis+Gyr (Switzerland), Aclara Technologies (US), Xylem (US), Itron, Inc. (US), Bmeters Srl (Italy), Honeywell International Inc. (US), MOM Co. Ltd. (South Korea), WaterTech (Arad Group) (Israel), Zenner International GmbH & Co. KG (Germany), Neptune Technology Group Inc. (US), Iskraemeco Group (Slovenia), Sagemcom (France), Wasion Group (China), Baylan Water Meters (Turkey), Wegot Utility Solutions (China), Apator S.A. (Poland), STMicroelectronics N.V. (Switzerland), Axioma Metering (Poland), Drizzlex (US), PHYN LLC (US), Conservation Labs, Inc. (US), and Integra Holding AG (Switzerland). Their strong metering portfolios, technological capabilities, product innovations, communication solutions, and continued investments in smart water metering systems and regional capacity expansion continue to shape the competitive landscape.
Research Coverage
The report provides a comprehensive definition, description, and forecast of the smart water meter market across technology (automated meter reading [AMR] and automated metering infrastructure [AMI]), meter type (ultrasonic meter, electromagnetic meter, and smart mechanical meter), component (meter & accessories, IT solutions, and communications), application (water utilities and industries), and region (North America, Europe, Asia Pacific, South America, and the Middle East & Africa). It delivers qualitative and quantitative analysis of market drivers, restraints, opportunities, and challenges. The study also includes competitive landscape assessment, market sizing and forecasts, technology trends, ecosystem analysis, commercial use cases, company benchmarking, and recent developments to provide a comprehensive view of the smart water meter market.
Key Benefits of Buying the Report
The report is designed to support OEMs, installers, utilities, policymakers, investors, and other stakeholders in understanding the evolving Smart Water Meter market. It provides reliable market forecasts across all major segments and regions while delivering insights into technology adoption, competitive positioning, and future growth opportunities. The report enables stakeholders to make informed business decisions through detailed market intelligence and strategic analysis.
- Analysis of key market dynamics: Covers various key growth factors (emphasis on water conservation; reduction of water wastage; replacing old water meters; adoption of smart city initiatives and digitization of water utilities), restraints (cost of smart meter deployment, issues of interoperability, cybersecurity issues, and the problem of upgrading existing water infrastructure), opportunities (metering through IoT as well as deployment of AMI and AMR, remote monitoring of leak detection, and integration of digital water management systems), and challenges (privacy of data, reliability of communication networks, integration with existing systems, and need for technical expertise).
- Technology and Product Innovation: Examines advancements into progress made in ultrasonic as well as electromagnetic metering, smart mechanical meters, automatic meter reading (AMR) as well as advanced metering infrastructure (AMI) communication, Internet of Things (IoT) connectivity, remote reading of meters, leak detection, consumption analysis, and cloud data management that help guarantee precise measurements, automatic data collection, and enhanced water-use monitoring.
- Market Development: Highlights how water infrastructure modernization, increasing water scarcity, urbanization, government-led water conservation initiatives, growing demand for efficient water distribution, and the transition toward digital utility management spur the implementation of smart water metering systems across water utilities and industrial applications.
- Market Diversification: Evaluates smart water meter applications extending from traditional municipal water utilities to industrial facilities and other commercial users requiring accurate consumption measurement, automated billing, leakage monitoring, and efficient water resource management.
- Competitive Assessment: Provides detailed analysis of leading companies including Badger Meter, Inc. (US), Kamstrup (Denmark), Diehl Stiftung & Co. KG (Germany), Landis+Gyr (Switzerland), Aclara Technologies (US), Xylem (US), Itron, Inc. (US), Bmeters Srl (Italy), Honeywell International Inc. (US), MOM Co. Ltd. (South Korea), WaterTech (Arad Group) (Israel), Zenner International GmbH & Co. KG (Germany), Neptune Technology Group Inc. (US), Iskraemeco Group (Slovenia), Sagemcom (France), Wasion Group (China), Baylan Water Meters (Turkey), Wegot Utility Solutions (China), Apator S.A. (Poland), STMicroelectronics N.V. (Switzerland), Axioma Metering (Poland), Drizzlex (US), PHYN LLC (US), Conservation Labs, Inc. (US), and Integra Holding AG (Switzerland), covering their product portfolios, strategic initiatives, technological capabilities, and competitive positioning.
TABLE OF CONTENTS
1 INTRODUCTION
- 1.1 STUDY OBJECTIVES
- 1.2 MARKET DEFINITION
- 1.3 STUDY SCOPE
- 1.3.1 MARKETS COVERED AND REGIONAL SCOPE
- 1.3.2 INCLUSIONS AND EXCLUSIONS
- 1.3.3 YEARS CONSIDERED
- 1.4 CURRENCY CONSIDERED
- 1.5 LIMITATIONS
- 1.6 STAKEHOLDERS
- 1.7 SUMMARY OF CHANGES
2 EXECUTIVE SUMMARY
- 2.1 MARKET HIGHLIGHTS AND KEY INSIGHTS
- 2.2 KEY MARKET PARTICIPANTS: MAPPING OF STRATEGIC DEVELOPMENTS
- 2.3 DISRUPTIVE TRENDS IN SMART WATER METER MARKET
- 2.4 HIGH-GROWTH SEGMENTS
- 2.5 REGIONAL SNAPSHOT: MARKET SIZE, GROWTH RATE, AND FORECAST
3 PREMIUM INSIGHTS
- 3.1 ATTRACTIVE OPPORTUNITIES FOR PLAYERS IN SMART WATER METER MARKET
- 3.2 SMART WATER METER MARKET, BY METER TYPE AND REGION
- 3.3 SMART WATER METER MARKET, BY METER TYPE
- 3.4 SMART WATER METER MARKET, BY COMPONENT
- 3.5 SMART WATER METER MARKET, BY TECHNOLOGY
- 3.6 SMART WATER METER MARKET, BY APPLICATION
- 3.7 SMART WATER METER MARKET, BY COUNTRY
4 MARKET OVERVIEW
- 4.1 INTRODUCTION
- 4.2 MARKET DYNAMICS
- 4.2.1 DRIVERS
- 4.2.1.1 Growing emphasis on reducing water losses across distribution networks
- 4.2.1.2 Increasing advanced metering infrastructure projects
- 4.2.2 RESTRAINTS
- 4.2.2.1 Limited government support and inadequate funding
- 4.2.2.2 Short battery lifespan
- 4.2.3 OPPORTUNITIES
- 4.2.3.1 Strong focus on aging water infrastructure modernization
- 4.2.3.2 Rising installation of municipal water metering systems
- 4.2.3.3 Expansion of sewage treatment infrastructure
- 4.2.4 CHALLENGES
- 4.2.4.1 Issues in ensuring maintenance, cybersecurity, and data integrity
- 4.2.1 DRIVERS
- 4.3 UNMET NEEDS AND WHITE SPACES
- 4.4 INTERCONNECTED MARKETS AND CROSS-SECTOR OPPORTUNITIES
- 4.5 STRATEGIC MOVES BY TIER-1/2/3 PLAYERS
5 INDUSTRY TRENDS
- 5.1 PORTER'S FIVE FORCES ANALYSIS
- 5.1.1 INTENSITY OF COMPETITIVE RIVALRY
- 5.1.2 THREAT OF NEW ENTRANTS
- 5.1.3 BARGAINING POWER OF SUPPLIERS
- 5.1.4 BARGAINING POWER OF BUYERS
- 5.1.5 THREAT OF SUBSTITUTES
- 5.2 MACROECONOMIC OUTLOOK
- 5.2.1 INTRODUCTION
- 5.2.1.1 Increasing investment in water infrastructure and urbanization
- 5.2.1.2 Growing concerns over water scarcity and conservation
- 5.2.1.3 Growing demand for digital water management
- 5.2.2 GDP TRENDS AND FORECAST
- 5.2.3 TRENDS IN GLOBAL WATER UTILITY SECTOR
- 5.2.4 TRENDS IN GLOBAL INDUSTRIAL SECTOR
- 5.2.1 INTRODUCTION
- 5.3 VALUE CHAIN ANALYSIS
- 5.4 ECOSYSTEM ANALYSIS
- 5.5 PRICING ANALYSIS
- 5.5.1 AVERAGE SELLING PRICE TREND OF SMART WATER METERS, BY METER TYPE, 2023-2025
- 5.5.2 AVERAGE SELLING PRICE TREND OF SMART WATER METERS, BY REGION, 2023-2025
- 5.6 TRADE ANALYSIS
- 5.6.1 IMPORT SCENARIO (HS CODE 9028)
- 5.6.2 EXPORT SCENARIO (HS CODE 9028)
- 5.7 KEY CONFERENCES AND EVENTS, 2026-2027
- 5.8 TRENDS/DISRUPTIONS IMPACTING CUSTOMER BUSINESS
- 5.9 INVESTMENT AND FUNDING SCENARIO
- 5.10 CASE STUDY ANALYSIS
- 5.10.1 REDUCING NON-REVENUE WATER THROUGH SMART WATER METER DEPLOYMENT
- 5.10.2 MODERNIZING NATIONAL GAS METERING THROUGH LARGE-SCALE AMI DEPLOYMENT
- 5.10.3 MODERNIZING ITALY'S ELECTRICITY GRID THROUGH ADVANCED METERING INFRASTRUCTURE
- 5.11 IMPACT OF US TARIFFS - SMART WATER METER MARKET
- 5.11.1 INTRODUCTION
- 5.11.2 KEY TARIFF RATES
- 5.11.3 PRICE IMPACT ANALYSIS
- 5.11.4 IMPACT ON REGIONS
- 5.11.4.1 North America
- 5.11.4.2 Europe
- 5.11.4.3 Asia Pacific
- 5.11.4.4 South America
- 5.11.4.5 Middle East & Africa
- 5.11.5 IMPACT ON APPLICATIONS
6 TECHNOLOGICAL ADVANCEMENTS, AI-DRIVEN IMPACT, PATENTS, INNOVATIONS, AND FUTURE APPLICATIONS
- 6.1 KEY TECHNOLOGIES
- 6.1.1 ADVANCED METERING INFRASTRUCTURE (AMI)
- 6.1.2 INTERNET OF THINGS (IOT)
- 6.2 COMPLEMENTARY TECHNOLOGIES
- 6.2.1 SMART GRID INFRASTRUCTURE
- 6.2.2 METER DATA MANAGEMENT SYSTEM (MDMS)
- 6.3 TECHNOLOGY/PRODUCT ROADMAP
- 6.4 PATENT ANALYSIS
- 6.5 FUTURE APPLICATIONS
- 6.6 IMPACT OF AI/GEN AI ON SMART WATER METER MARKET
- 6.6.1 TOP USE CASES AND MARKET POTENTIAL
- 6.6.2 BEST PRACTICES FOLLOWED BY OEMS IN SMART WATER METER MARKET
- 6.6.3 CASE STUDIES RELATED TO AI/GEN AI IMPLEMENTATION IN SMART WATER METER MARKET
- 6.6.4 INTERCONNECTED ECOSYSTEM AND IMPACT ON MARKET PLAYERS
- 6.6.5 CLIENTS' READINESS TO ADOPT AI/GEN AI-INTEGRATED SMART WATER METERS
- 6.7 SUCCESS STORIES AND REAL-WORLD APPLICATIONS
- 6.7.1 BADGER METER INC.: CONNECTED WATER METERING AND LEAK DETECTION
- 6.7.2 SENSUS (XYLEM): AMI-ENABLED SMART WATER NETWORK MANAGEMENT
- 6.7.3 DIEHL METERING: AI-ENABLED WATER LOSS MANAGEMENT AND CONNECTED METERING
7 REGULATORY LANDSCAPE
- 7.1 REGIONAL REGULATIONS AND COMPLIANCE
- 7.1.1 REGULATORY BODIES, GOVERNMENT AGENCIES, AND OTHER ORGANIZATIONS
- 7.1.2 INDUSTRY STANDARDS
8 CUSTOMER LANDSCAPE AND BUYER BEHAVIOR
- 8.1 DECISION-MAKING PROCESS
- 8.2 KEY STAKEHOLDERS INVOLVED IN BUYING PROCESS AND THEIR EVALUATION CRITERIA
- 8.2.1 KEY STAKEHOLDERS IN BUYING PROCESS
- 8.2.2 BUYING CRITERIA
- 8.3 ADOPTION BARRIERS AND INTERNAL CHALLENGES
- 8.4 MARKET PROFITABILITY
- 8.4.1 REVENUE POTENTIAL
- 8.4.2 COST DYNAMICS
9 SMART WATER METER MARKET, BY TECHNOLOGY
- 9.1 INTRODUCTION
- 9.2 AUTOMATIC METER READING (AMR)
- 9.2.1 REDUCED MANUAL INTERVENTION FOR DATA COLLECTION TO BOOST SEGMENTAL GROWTH
- 9.3 ADVANCED METERING INFRASTRUCTURE (AMI)
- 9.3.1 HIGH RELIABILITY OF AMI COMMUNICATION INFRASTRUCTURE TO DRIVE MARKET
10 SMART WATER METER MARKET, BY APPLICATION
- 10.1 INTRODUCTION
- 10.2 WATER UTILITIES
- 10.2.1 INVESTMENT IN TRADITIONAL WATER NETWORK UPGRADES TO FUEL SEGMENTAL GROWTH
- 10.3 INDUSTRIES
- 10.3.1 INCREASED FOCUS ON WATER LOSS REDUCTION TO AUGMENT SEGMENTAL GROWTH
11 SMART WATER METER, BY METER TYPE
- 11.1 INTRODUCTION
- 11.2 ELECTROMAGNETIC
- 11.2.1 ENHANCED ACCURACY LEVEL IN WATER TRACKING TO BOOST SEGMENTAL GROWTH
- 11.3 ULTRASONIC
- 11.3.1 EFFECTIVE DETECTION OF LEAKS, BURSTS, AND REVERSE FLOW TO FACILITATE SEGMENTAL GROWTH
- 11.4 SMART MECHANICAL
- 11.4.1 LOW COST TO CREATE LUCRATIVE MARKET GROWTH OPPORTUNITIES IN DEVELOPING COUNTRIES
12 SMART WATER METER, BY COMPONENT
- 12.1 INTRODUCTION
- 12.2 METERS & ACCESSORIES
- 12.2.1 TECHNOLOGICAL INNOVATIONS IN METERING DEVICES TO PROPEL MARKET
- 12.3 IT SOLUTIONS
- 12.3.1 INCREASING DEMAND FOR DATA MANAGEMENT SOFTWARE TO BOLSTER SEGMENTAL GROWTH
- 12.4 COMMUNICATIONS
- 12.4.1 RISING DEVELOPMENT OF LOW-POWER COMMUNICATION TECHNOLOGIES TO BOLSTER SEGMENTAL GROWTH
13 SMART WATER METER MARKET, BY REGION
- 13.1 INTRODUCTION
- 13.2 NORTH AMERICA
- 13.2.1 US
- 13.2.1.1 Increasing investment in water infrastructure modernization and digital utility management to boost market growth
- 13.2.2 CANADA
- 13.2.2.1 1.4.5.2.1 Strong focus on modernizing aging water infrastructure to contribute to market growth
- 13.2.3 MEXICO
- 13.2.3.1 Increasing pressure to reduce distribution losses and manage limited water resources to fuel market growth
- 13.2.1 US
- 13.3 ASIA PACIFIC
- 13.3.1 CHINA
- 13.3.1.1 Rapid urbanization, smart-city development, and continued modernization of municipal water infrastructure to drive market
- 13.3.2 INDIA
- 13.3.2.1 Rapid revolutionization of urban water management and sustainability to boost market growth
- 13.3.3 JAPAN
- 13.3.3.1 Rising need to maintain reliable water services and improve efficiency of utility operations to expedite market growth
- 13.3.4 AUSTRALIA
- 13.3.4.1 Growing concern about drought and need to improve water-use efficiency across urban and regional communities to drive market
- 13.3.5 MALAYSIA
- 13.3.5.1 Increasing need to reduce water loss to contribute to market growth
- 13.3.6 REST OF ASIA PACIFIC
- 13.3.1 CHINA
- 13.4 EUROPE
- 13.4.1 UK
- 13.4.1.1 Water scarcity and government initiatives to boost market growth
- 13.4.2 FRANCE
- 13.4.2.1 Municipal infrastructure modernization and emphasis on reducing water losses to augment market growth
- 13.4.3 GERMANY
- 13.4.3.1 Modernization of municipal water infrastructure and digitalization of utility operations to expedite market growth
- 13.4.4 DENMARK
- 13.4.4.1 Global collaborations for smart water innovation to drive market
- 13.4.5 NETHERLANDS
- 13.4.5.1 Rising need to improve water accountability and network resilience through connected metering solutions to foster market growth
- 13.4.6 REST OF EUROPE
- 13.4.1 UK
- 13.5 SOUTH AMERICA
- 13.5.1 BRAZIL
- 13.5.1.1 Strong focus on reducing water losses and improving utility efficiency to accelerate market growth
- 13.5.2 ARGENTINA
- 13.5.2.1 Growing emphasis on improving water distribution monitoring and reducing non-revenue water to fuel market growth
- 13.5.3 URUGUAY
- 13.5.3.1 Rising need to strengthen water conservation and consumption visibility to contribute to market growth
- 13.5.4 REST OF SOUTH AMERICA
- 13.5.1 BRAZIL
- 13.6 MIDDLE EAST & AFRICA
- 13.6.1 GCC
- 13.6.1.1 Saudi Arabia
- 13.6.1.1.1 Growing focus on groundwater monitoring and conservation to boost market growth
- 13.6.1.2 UAE
- 13.6.1.2.1 Water security strategy 2036 to expedite market growth
- 13.6.1.1 Saudi Arabia
- 13.6.2 ISRAEL
- 13.6.2.1 Expansion of smart water metering for consumption monitoring and water-loss reduction to support market growth
- 13.6.3 EGYPT
- 13.6.3.1 Desalination mega-projects to provide market growth opportunities
- 13.6.4 SOUTH AFRICA
- 13.6.4.1 Modernization of water infrastructure to contribute to market growth
- 13.6.5 REST OF MIDDLE EAST & AFRICA
- 13.6.1 GCC
14 COMPETITIVE LANDSCAPE
- 14.1 OVERVIEW
- 14.2 KEY PLAYER COMPETITIVE STRATEGIES/RIGHT TO WIN, JANUARY 2023- SEPTEMBER 2026
- 14.3 MARKET SHARE ANALYSIS, 2025
- 14.4 REVENUE ANALYSIS, 2021-2025
- 14.5 BRAND COMPARISON
- 14.5.1 BADGER METER, INC. (US)
- 14.5.2 SENSUS (XYLEM) (US)
- 14.5.3 DIEHL STIFTUNG & CO. KG (GERMANY)
- 14.5.4 ITRON INC. (US)
- 14.5.5 LANDIS+GYR (SWITZERLAND)
- 14.6 COMPANY EVALUATION MATRIX: KEY PLAYERS, 2025
- 14.6.1 STARS
- 14.6.2 EMERGING LEADERS
- 14.6.3 PERVASIVE PLAYERS
- 14.6.4 PARTICIPANTS
- 14.6.5 COMPANY FOOTPRINT: KEY PLAYERS, 2025
- 14.6.5.1 Company footprint
- 14.6.5.2 Region footprint
- 14.6.5.3 Component footprint
- 14.6.5.4 Meter type footprint
- 14.6.5.5 Application footprint
- 14.7 COMPANY EVALUATION MATRIX: STARTUPS/SMES, 2025
- 14.7.1 PROGRESSIVE COMPANIES
- 14.7.2 RESPONSIVE COMPANIES
- 14.7.3 DYNAMIC COMPANIES
- 14.7.4 STARTING BLOCKS
- 14.7.5 COMPETITIVE BENCHMARKING: STARTUPS/SMES, 2025
- 14.7.5.1 Detailed list of key startups/SMEs
- 14.7.5.2 Competitive benchmarking of key startups/SMEs
- 14.8 COMPANY VALUATION AND FINANCIAL METRICS
- 14.9 COMPETITIVE SCENARIO
- 14.9.1 PRODUCT LAUNCHES
- 14.9.2 DEALS
- 14.9.3 EXPANSIONS
15 COMPANY PROFILES
- 15.1 KEY PLAYERS
- 15.1.1 BADGER METER, INC.
- 15.1.1.1 Business overview
- 15.1.1.2 Products/Solutions/Services offered
- 15.1.1.3 Recent developments
- 15.1.1.3.1 Product launches
- 15.1.1.3.2 Deals
- 15.1.1.3.3 Expansions
- 15.1.1.4 MnM view
- 15.1.1.4.1 Key strengths/Right to win
- 15.1.1.4.2 Strategic choices
- 15.1.1.4.3 Weaknesses/Competitive threats
- 15.1.2 LANDIS+GYR
- 15.1.2.1 Business overview
- 15.1.2.2 Products/Solutions/Services offered
- 15.1.2.3 Recent developments
- 15.1.2.3.1 Product Launches
- 15.1.2.3.2 Deals
- 15.1.2.3.3 Expansions
- 15.1.2.4 MnM view
- 15.1.2.4.1 Key strengths/Right to win
- 15.1.2.4.2 Strategic choices
- 15.1.2.4.3 Weaknesses/Competitive threats
- 15.1.3 ITRON INC.
- 15.1.3.1 Business overview
- 15.1.3.2 Products/Solutions/Services offered
- 15.1.3.3 Recent developments
- 15.1.3.3.1 Product Launches
- 15.1.3.3.2 Deals
- 15.1.3.3.3 Expansions
- 15.1.3.4 MnM view
- 15.1.3.4.1 Key strengths/Right to win
- 15.1.3.4.2 Strategic choices
- 15.1.3.4.3 Weaknesses/Competitive threats
- 15.1.4 DIEHL STIFTUNG & CO. KG
- 15.1.4.1 Business overview
- 15.1.4.2 Products/Solutions/Services offered
- 15.1.4.3 Recent developments
- 15.1.4.3.1 Product Launches
- 15.1.4.3.2 Deals
- 15.1.4.3.3 Expansions
- 15.1.4.4 MnM view
- 15.1.4.4.1 Key strengths/Right to win
- 15.1.4.4.2 Strategic choices
- 15.1.4.4.3 Weaknesses/Competitive threats
- 15.1.5 SENSUS (XYLEM)
- 15.1.5.1 Business overview
- 15.1.5.2 Products/Solutions/Services offered
- 15.1.5.3 Recent developments
- 15.1.5.3.1 Deals
- 15.1.5.3.2 Expansions
- 15.1.5.4 MnM view
- 15.1.5.4.1 Key strengths/Right to win
- 15.1.5.4.2 Strategic choices
- 15.1.5.4.3 Weaknesses/Competitive threats
- 15.1.6 HONEYWELL INTERNATIONAL INC.
- 15.1.6.1 Business overview
- 15.1.6.2 Products/Solutions/Services offered
- 15.1.6.3 Recent developments
- 15.1.6.3.1 Product Launches
- 15.1.6.3.2 Deals
- 15.1.6.3.3 Expansions
- 15.1.7 WASION HOLDINGS INTERNATIONAL
- 15.1.7.1 Business overview
- 15.1.7.2 Products/Solutions/Services offered
- 15.1.7.3 Recent developments
- 15.1.7.3.1 Expansions
- 15.1.7.3.2 Other developments
- 15.1.8 KAMSTRUP
- 15.1.8.1 Business overview
- 15.1.8.2 Products/Solutions/Services offered
- 15.1.8.3 Recent developments
- 15.1.8.3.1 Product Launches
- 15.1.8.3.2 Deals
- 15.1.8.3.3 Expansions
- 15.1.9 ACLARA (HUBBELL)
- 15.1.9.1 Business overview
- 15.1.9.2 Products/Solutions/Services offered
- 15.1.9.3 Recent developments
- 15.1.9.3.1 Deals
- 15.1.9.3.2 Expansions
- 15.1.10 B METERS SRL
- 15.1.10.1 Business overview
- 15.1.10.2 Products/Solutions/Services offered
- 15.1.10.3 Recent developments
- 15.1.10.3.1 Product Launches
- 15.1.10.3.2 Deals
- 15.1.10.3.3 Expansions
- 15.1.11 ARAD GROUP
- 15.1.11.1 Business overview
- 15.1.11.2 Products/Solutions/Services offered
- 15.1.11.3 Recent developments
- 15.1.11.3.1 Product Launches
- 15.1.11.3.2 Expansions
- 15.1.12 ZENNER INTERNATIONAL GMBH & CO. KG
- 15.1.12.1 Business overview
- 15.1.12.2 Products/Solutions/Services offered
- 15.1.12.3 Recent developments
- 15.1.12.3.1 Deals
- 15.1.12.3.2 Expansions
- 15.1.13 NEPTUNE TECHNOLOGY GROUP INC.
- 15.1.13.1 Business overview
- 15.1.13.2 Products/Solutions/Services offered
- 15.1.13.3 Recent developments
- 15.1.13.3.1 Expansions
- 15.1.14 ISKRAEMECO GROUP
- 15.1.14.1 Business overview
- 15.1.14.2 Products/Solutions/Services offered
- 15.1.14.3 Recent developments
- 15.1.14.3.1 Expansions
- 15.1.15 SAGEMCOM
- 15.1.15.1 Business overview
- 15.1.15.2 Products/Solutions/Services offered
- 15.1.1 BADGER METER, INC.
- 15.2 OTHER PLAYERS
- 15.2.1 BAYLAN WATER METERS
- 15.2.2 WEGOT UTILITY SOLUTIONS PVT LTD.
- 15.2.3 APATOR S.A.
- 15.2.4 STMICROELECTRONICS
- 15.2.5 AXIOMA METERING
- 15.2.6 DRIZZLEX
- 15.2.7 CONSERVATION LABS, INC.
- 15.2.8 INTEGRA
- 15.2.9 PHYN LLC
- 15.2.10 BOVE TECHNOLOGY
16 RESEARCH METHODOLOGY
- 16.1 RESEARCH DATA
- 16.1.1 SECONDARY DATA
- 16.1.1.1 List of major secondary sources
- 16.1.1.2 Key data from secondary sources
- 16.1.2 PRIMARY DATA
- 16.1.2.1 List of primary interview participants
- 16.1.2.2 Key industry insights
- 16.1.2.3 Breakdown of primaries
- 16.1.2.4 Key data from primary sources
- 16.1.1 SECONDARY DATA
- 16.2 DATA TRIANGULATION
- 16.3 MARKET SIZE ESTIMATION
- 16.3.1 BOTTOM-UP APPROACH
- 16.3.2 TOP-DOWN APPROACH
- 16.4 DEMAND-SIDE ANALYSIS
- 16.4.1 ASSUMPTIONS FOR DEMAND-SIDE ANALYSIS
- 16.4.2 CALCULATIONS FOR DEMAND-SIDE ANALYSIS
- 16.5 SUPPLY-SIDE ANALYSIS
- 16.5.1 ASSUMPTIONS FOR SUPPLY-SIDE ANALYSIS
- 16.5.2 CALCULATIONS FOR SUPPLY-SIDE ANALYSIS
- 16.6 GROWTH FORECAST ASSUMPTIONS
- 16.7 RESEARCH LIMITATIONS
- 16.8 RISK ASSESSMENT
17 APPENDIX
- 17.1 DISCUSSION GUIDE
- 17.2 KNOWLEDGESTORE: MARKETSANDMARKETS' SUBSCRIPTION PORTAL
- 17.3 CUSTOMIZATION OPTIONS
- 17.4 RELATED REPORTS
- 17.5 AUTHOR DETAILS
List of Tables
- TABLE 1 SEWAGE TREATMENT PROJECTS IN INDIA
- TABLE 2 INTERCONNECTED MARKETS
- TABLE 3 KEY MOVES AND STRATEGIC FOCUS OF TIER-1/2/3 PLAYERS
- TABLE 4 IMPACT OF PORTER'S FIVE FORCES
- TABLE 5 GDP PERCENTAGE CHANGE, BY KEY COUNTRY, 2021-2029
- TABLE 6 ROLE OF COMPANIES IN SMART WATER METER ECOSYSTEM
- TABLE 7 AVERAGE SELLING PRICE TREND OF SMART WATER METERS, BY METER TYPE, 2023-2025 (USD/UNIT)
- TABLE 8 AVERAGE SELLING PRICE TREND OF SMART WATER METERS, BY REGION, 2023-2025 (USD/UNIT)
- TABLE 9 IMPORT DATA FOR HS CODE 9028-COMPLIANT PRODUCTS, BY COUNTRY, 2021-2025 (USD THOUSAND)
- TABLE 10 EXPORT DATA FOR HS CODE 9028-COMPLIANT PRODUCTS, BY COUNTRY, 2021-2025 (USD THOUSAND)
- TABLE 11 LIST OF KEY CONFERENCES AND EVENTS, 2026-2027
- TABLE 12 AMI-ENABLED WATER NETWORK MODERNIZATION BY KAMSTRUP
- TABLE 13 LARGE-SCALE SMART GAS METER DEPLOYMENT BY GRDF
- TABLE 14 LARGE-SCALE AMI DEPLOYMENT BY ENEL IN ITALY
- TABLE 15 US-ADJUSTED RECIPROCAL TARIFF RATES
- TABLE 16 EXPECTED CHANGE IN PRICES AND POTENTIAL IMPACT ON MARKET PLAYERS DUE TO TARIFFS
- TABLE 17 LIST OF KEY PATENTS, 2025
- TABLE 18 SMART CITIES & URBAN WATER MANAGEMENT
- TABLE 19 REAL-TIME LEAK DETECTION & WATER LOSS MANAGEMENT
- TABLE 20 IOT-ENABLED & CONNECTED WATER METERING
- TABLE 21 AI-BASED CONSUMPTION ANALYTICS & DEMAND FORECASTING
- TABLE 22 INDUSTRIAL WATER EFFICIENCY, SMART IRRIGATION & SUSTAINABLE WATER MANAGEMENT
- TABLE 23 USE CASES AND MARKET POTENTIAL
- TABLE 24 BEST PRACTICES: USE CASES OF SMART WATER METERS, BY COMPANY
- TABLE 25 CASE STUDIES RELATED TO AI/GEN AI IMPLEMENTATION
- TABLE 26 INTERCONNECTED ECOSYSTEM AND IMPACT ON SMART WATER METER MARKET PLAYERS
- TABLE 27 NORTH AMERICA: REGULATORY BODIES, GOVERNMENT AGENCIES, AND OTHER ORGANIZATIONS
- TABLE 28 EUROPE: LIST OF REGULATORY BODIES, GOVERNMENT AGENCIES, AND OTHER ORGANIZATIONS
- TABLE 29 ASIA PACIFIC: LIST OF REGULATORY BODIES, GOVERNMENT AGENCIES, AND OTHER ORGANIZATIONS
- TABLE 30 ROW: LIST OF REGULATORY BODIES, GOVERNMENT AGENCIES, AND OTHER ORGANIZATIONS
- TABLE 31 GLOBAL: LIST OF REGULATORY BODIES, GOVERNMENT AGENCIES, AND OTHER ORGANIZATIONS
- TABLE 32 GLOBAL INDUSTRY STANDARDS
- TABLE 33 INFLUENCE OF STAKEHOLDERS ON BUYING PROCESS, BY APPLICATION (%)
- TABLE 34 BUYING CRITERIA, BY APPLICATION
- TABLE 35 SMART WATER METER MARKET, BY TECHNOLOGY, 2022-2025 (USD MILLION)
- TABLE 36 SMART WATER METER MARKET, BY TECHNOLOGY, 2026-2031 (USD MILLION)
- TABLE 37 AUTOMATIC METER READING (AMR): SMART WATER METER MARKET, BY REGION, 2022-2025 (USD MILLION)
- TABLE 38 AUTOMATIC METER READING (AMR): SMART WATER METER MARKET, BY REGION, 2026-2031 (USD MILLION)
- TABLE 39 ADVANCED METERING INFRASTRUCTURE (AMI): SMART WATER METER MARKET, BY REGION, 2022-2025 (USD MILLION)
- TABLE 40 ADVANCED METERING INFRASTRUCTURE (AMI): SMART WATER METER MARKET, BY REGION, 2026-2031 (USD MILLION)
- TABLE 41 SMART WATER METER MARKET, BY APPLICATION, 2022-2025 (USD MILLION)
- TABLE 42 SMART WATER METER MARKET, BY APPLICATION, 2026-2031 (USD MILLION)
- TABLE 43 WATER UTILITIES: SMART WATER METER MARKET, BY REGION, 2022-2025 (USD MILLION)
- TABLE 44 WATER UTILITIES: SMART WATER METER MARKET, BY REGION, 2026-2031 (USD MILLION)
- TABLE 45 INDUSTRIES: SMART WATER METER MARKET, BY REGION, 2022-2025 (USD MILLION)
- TABLE 46 INDUSTRIES: SMART WATER METER MARKET, BY REGION, 2026-2031 (USD MILLION)
- TABLE 47 SMART WATER METER MARKET, BY METER TYPE, 2022-2025 (USD MILLION)
- TABLE 48 SMART WATER METER MARKET, BY METER TYPE, 2026-2031 (USD MILLION)
- TABLE 49 ELECTROMAGNETIC: SMART WATER METER MARKET, BY REGION, 2022-2025 (USD MILLION)
- TABLE 50 ELECTROMAGNETIC: SMART WATER METER MARKET, BY REGION, 2026-2031 (USD MILLION)
- TABLE 51 ULTRASONIC: SMART WATER METER MARKET, BY REGION, 2022-2025 (USD MILLION)
- TABLE 52 ULTRASONIC: SMART WATER METER MARKET, BY REGION, 2026-2031 (USD MILLION)
- TABLE 53 SMART MECHANICAL: SMART WATER METER MARKET, BY REGION, 2022-2025 (USD MILLION)
- TABLE 54 SMART MECHANICAL: SMART WATER METER MARKET, BY REGION, 2026-2031 (USD MILLION)
- TABLE 55 SMART WATER METER MARKET, BY COMPONENT, 2022-2025 (USD MILLION)
- TABLE 56 SMART WATER METER MARKET, BY COMPONENT, 2026-2031 (USD MILLION)
- TABLE 57 METERS & ACCESSORIES: SMART WATER METER MARKET, BY REGION, 2022-2025 (USD MILLION)
- TABLE 58 METERS & ACCESSORIES: SMART WATER METER MARKET, BY REGION, 2026-2031 (USD MILLION)
- TABLE 59 IT SOLUTIONS: SMART WATER METER MARKET, BY REGION, 2022-2025 (USD MILLION)
- TABLE 60 IT SOLUTIONS: SMART WATER METER MARKET, BY REGION, 2026-2031 (USD MILLION)
- TABLE 61 COMMUNICATIONS: SMART WATER METER MARKET, BY REGION, 2022-2025 (USD MILLION)
- TABLE 62 COMMUNICATIONS: SMART WATER METER MARKET, BY REGION, 2026-2031 (USD MILLION)
- TABLE 63 SMART WATER METER MARKET, BY REGION, 2022-2025 (USD MILLION)
- TABLE 64 SMART WATER METER MARKET, BY REGION, 2026-2031 (USD MILLION)
- TABLE 65 SMART WATER METER MARKET, BY REGION, 2022-2025 (MILLION UNITS)
- TABLE 66 SMART WATER METER MARKET, BY REGION, 2026-2031 (MILLION UNITS)
- TABLE 67 NORTH AMERICA: SMART WATER METER MARKET, BY METER TYPE, 2022-2025 (USD MILLION)
- TABLE 68 NORTH AMERICA: SMART WATER METER MARKET, BY METER TYPE, 2026-2031 (USD MILLION)
- TABLE 69 NORTH AMERICA: SMART WATER METER MARKET, BY TECHNOLOGY, 2022-2025 (USD MILLION)
- TABLE 70 NORTH AMERICA: SMART WATER METER MARKET, BY TECHNOLOGY, 2026-2031 (USD MILLION)
- TABLE 71 NORTH AMERICA: SMART WATER METER MARKET, BY COMPONENT, 2022-2025 (USD MILLION)
- TABLE 72 NORTH AMERICA: SMART WATER METER MARKET, BY COMPONENT, 2026-2031 (USD MILLION)
- TABLE 73 NORTH AMERICA: SMART WATER METER MARKET, BY APPLICATION, 2022-2025 (USD MILLION)
- TABLE 74 NORTH AMERICA: SMART WATER METER MARKET, BY APPLICATION, 2026-2031 (USD MILLION)
- TABLE 75 NORTH AMERICA: SMART WATER METER MARKET, BY COUNTRY, 2022-2025 (USD MILLION)
- TABLE 76 NORTH AMERICA: SMART WATER METER MARKET, BY COUNTRY, 2026-2031 (USD MILLION)
- TABLE 77 US: SMART WATER METER MARKET, BY APPLICATION, 2022-2025 (USD MILLION)
- TABLE 78 US: SMART WATER METER MARKET, BY APPLICATION, 2026-2031 (USD MILLION)
- TABLE 79 CANADA: SMART WATER METER MARKET, BY APPLICATION, 2022-2025 (USD MILLION)
- TABLE 80 CANADA: SMART WATER METER MARKET, BY APPLICATION, 2026-2031 (USD MILLION)
- TABLE 81 MEXICO: SMART WATER METER MARKET, BY APPLICATION, 2022-2025 (USD MILLION)
- TABLE 82 MEXICO: SMART WATER METER MARKET, BY APPLICATION, 2026-2031 (USD MILLION)
- TABLE 83 ASIA PACIFIC: SMART WATER METER MARKET, BY METER TYPE, 2022-2025 (USD MILLION)
- TABLE 84 ASIA PACIFIC: SMART WATER METER MARKET, BY METER TYPE, 2026-2031 (USD MILLION)
- TABLE 85 ASIA PACIFIC: SMART WATER METER MARKET, BY TECHNOLOGY, 2022-2025 (USD MILLION)
- TABLE 86 ASIA PACIFIC: SMART WATER METER MARKET, BY TECHNOLOGY, 2026-2031 (USD MILLION)
- TABLE 87 ASIA PACIFIC: SMART WATER METER MARKET, BY COMPONENT, 2022-2025 (USD MILLION)
- TABLE 88 ASIA PACIFIC: SMART WATER METER MARKET, BY COMPONENT, 2026-2031 (USD MILLION)
- TABLE 89 ASIA PACIFIC: SMART WATER METER MARKET, BY APPLICATION, 2022-2025 (USD MILLION)
- TABLE 90 ASIA PACIFIC: SMART WATER METER MARKET, BY APPLICATION, 2026-2031 (USD MILLION)
- TABLE 91 ASIA PACIFIC: SMART WATER METER MARKET, BY COUNTRY, 2022-2025 (USD MILLION)
- TABLE 92 ASIA PACIFIC: SMART WATER METER MARKET, BY COUNTRY, 2026-2031 (USD MILLION)
- TABLE 93 CHINA: SMART WATER METER MARKET, BY APPLICATION, 2022-2025 (USD MILLION)
- TABLE 94 CHINA: SMART WATER METER MARKET, BY APPLICATION, 2026-2031 (USD MILLION)
- TABLE 95 INDIA: SMART WATER METER MARKET, BY APPLICATION, 2022-2025 (USD MILLION)
- TABLE 96 INDIA: SMART WATER METER MARKET, BY APPLICATION, 2026-2031 (USD MILLION)
- TABLE 97 JAPAN: SMART WATER METER MARKET, BY APPLICATION, 2022-2025 (USD MILLION)
- TABLE 98 JAPAN: SMART WATER METER MARKET, BY APPLICATION, 2026-2031 (USD MILLION)
- TABLE 99 AUSTRALIA: SMART WATER METER MARKET, BY APPLICATION, 2022-2025 (USD MILLION)
- TABLE 100 AUSTRALIA: SMART WATER METER MARKET, BY APPLICATION, 2026-2031 (USD MILLION)
- TABLE 101 MALAYSIA: SMART WATER METER MARKET, BY APPLICATION, 2022-2025 (USD MILLION)
- TABLE 102 MALAYSIA: SMART WATER METER MARKET, BY APPLICATION, 2026-2031 (USD MILLION)
- TABLE 103 REST OF ASIA PACIFIC: SMART WATER METER MARKET, BY APPLICATION, 2022-2025 (USD MILLION)
- TABLE 104 REST OF ASIA PACIFIC: SMART WATER METER MARKET, BY APPLICATION, 2026-2031 (USD MILLION)
- TABLE 105 EUROPE: SMART WATER METER MARKET, BY METER TYPE, 2022-2025 (USD MILLION)
- TABLE 106 EUROPE: SMART WATER METER MARKET, BY METER TYPE, 2026-2031 (USD MILLION)
- TABLE 107 EUROPE: SMART WATER METER MARKET, BY TECHNOLOGY, 2022-2025 (USD MILLION)
- TABLE 108 EUROPE: SMART WATER METER MARKET, BY TECHNOLOGY, 2026-2031 (USD MILLION)
- TABLE 109 EUROPE: SMART WATER METER MARKET, BY COMPONENT, 2022-2025 (USD MILLION)
- TABLE 110 EUROPE: SMART WATER METER MARKET, BY COMPONENT, 2026-2031 (USD MILLION)
- TABLE 111 EUROPE: SMART WATER METER MARKET, BY APPLICATION, 2022-2025 (USD MILLION)
- TABLE 112 EUROPE: SMART WATER METER MARKET, BY APPLICATION, 2026-2031 (USD MILLION)
- TABLE 113 EUROPE: SMART WATER METER MARKET, BY COUNTRY, 2022-2025 (USD MILLION)
- TABLE 114 EUROPE: SMART WATER METER MARKET, BY COUNTRY, 2026-2031 (USD MILLION)
- TABLE 115 UK: SMART WATER METER MARKET, BY APPLICATION, 2022-2025 (USD MILLION)
- TABLE 116 UK: SMART WATER METER MARKET, BY APPLICATION, 2026-2031 (USD MILLION)
- TABLE 117 FRANCE: SMART WATER METER MARKET, BY APPLICATION, 2022-2025 (USD MILLION)
- TABLE 118 FRANCE: SMART WATER METER MARKET, BY APPLICATION, 2026-2031 (USD MILLION)
- TABLE 119 GERMANY: SMART WATER METER MARKET, BY APPLICATION, 2022-2025 (USD MILLION)
- TABLE 120 GERMANY: SMART WATER METER MARKET, BY APPLICATION, 2026-2031 (USD MILLION)
- TABLE 121 DENMARK: SMART WATER METER MARKET, BY APPLICATION, 2022-2025 (USD MILLION)
- TABLE 122 DENMARK: SMART WATER METER MARKET, BY APPLICATION, 2026-2031 (USD MILLION)
- TABLE 123 NETHERLANDS: SMART WATER METER MARKET, BY APPLICATION, 2022-2025 (USD MILLION)
- TABLE 124 NETHERLANDS: SMART WATER METER MARKET, BY APPLICATION, 2026-2031 (USD MILLION)
- TABLE 125 REST OF EUROPE: SMART WATER METER MARKET, BY APPLICATION, 2022-2025 (USD MILLION)
- TABLE 126 REST OF EUROPE: SMART WATER METER MARKET, BY APPLICATION, 2026-2031 (USD MILLION)
- TABLE 127 SOUTH AMERICA: SMART WATER METER MARKET, BY METER TYPE, 2022-2025 (USD MILLION)
- TABLE 128 SOUTH AMERICA: SMART WATER METER MARKET, BY METER TYPE, 2026-2031 (USD MILLION)
- TABLE 129 SOUTH AMERICA: SMART WATER METER MARKET, BY TECHNOLOGY, 2022-2025 (USD MILLION)
- TABLE 130 SOUTH AMERICA: SMART WATER METER MARKET, BY TECHNOLOGY, 2026-2031 (USD MILLION)
- TABLE 131 SOUTH AMERICA: SMART WATER METER MARKET, BY COMPONENT, 2022-2025 (USD MILLION)
- TABLE 132 SOUTH AMERICA: SMART WATER METER MARKET, BY COMPONENT, 2026-2031 (USD MILLION)
- TABLE 133 SOUTH AMERICA: SMART WATER METER MARKET, BY APPLICATION, 2022-2025 (USD MILLION)
- TABLE 134 SOUTH AMERICA: SMART WATER METER MARKET, BY APPLICATION, 2026-2031 (USD MILLION)
- TABLE 135 SOUTH AMERICA: SMART WATER METER MARKET, BY COUNTRY, 2022-2025 (USD MILLION)
- TABLE 136 SOUTH AMERICA: SMART WATER METER MARKET, BY COUNTRY, 2026-2031 (USD MILLION)
- TABLE 137 BRAZIL: SMART WATER METER MARKET, BY APPLICATION, 2022-2025 (USD MILLION)
- TABLE 138 BRAZIL: SMART WATER METER MARKET, BY APPLICATION, 2026-2031 (USD MILLION)
- TABLE 139 ARGENTINA: SMART WATER METER MARKET, BY APPLICATION, 2022-2025 (USD MILLION)
- TABLE 140 ARGENTINA: SMART WATER METER MARKET, BY APPLICATION, 2026-2031 (USD MILLION)
- TABLE 141 URUGUAY: SMART WATER METER MARKET, BY APPLICATION, 2022-2025 (USD MILLION)
- TABLE 142 URUGUAY: SMART WATER METER MARKET, BY APPLICATION, 2026-2031 (USD MILLION)
- TABLE 143 REST OF SOUTH AMERICA: SMART WATER METER MARKET, BY APPLICATION, 2022-2025 (USD MILLION)
- TABLE 144 REST OF SOUTH AMERICA: SMART WATER METER MARKET, BY APPLICATION, 2026-2031 (USD MILLION)
- TABLE 145 MIDDLE EAST & AFRICA: SMART WATER METER MARKET, BY METER TYPE, 2022-2025 (USD MILLION)
- TABLE 146 MIDDLE EAST & AFRICA: SMART WATER METER MARKET, BY METER TYPE, 2026-2031 (USD MILLION)
- TABLE 147 MIDDLE EAST & AFRICA: SMART WATER METER MARKET, BY TECHNOLOGY, 2022-2025 (USD MILLION)
- TABLE 148 MIDDLE EAST & AFRICA: SMART WATER METER MARKET, BY TECHNOLOGY, 2026-2031 (USD MILLION)
- TABLE 149 MIDDLE EAST & AFRICA: SMART WATER METER MARKET, BY COMPONENT, 2022-2025 (USD MILLION)
- TABLE 150 MIDDLE EAST & AFRICA: SMART WATER METER MARKET, BY COMPONENT, 2026-2031 (USD MILLION)
- TABLE 151 MIDDLE EAST & AFRICA: SMART WATER METER MARKET, BY APPLICATION, 2022-2025 (USD MILLION)
- TABLE 152 MIDDLE EAST & AFRICA: SMART WATER METER MARKET, BY APPLICATION, 2026-2031 (USD MILLION)
- TABLE 153 MIDDLE EAST & AFRICA: SMART WATER METER MARKET, BY COUNTRY, 2022-2025 (USD MILLION)
- TABLE 154 MIDDLE EAST & AFRICA: SMART WATER METER MARKET, BY COUNTRY, 2026-2031 (USD MILLION)
- TABLE 155 GCC: SMART WATER METER MARKET, BY COUNTRY, 2022-2025 (USD MILLION)
- TABLE 156 GCC: SMART WATER METER MARKET, BY COUNTRY, 2026-2031 (USD MILLION)
- TABLE 157 SAUDI ARABIA: SMART WATER METER MARKET, BY APPLICATION, 2022-2025 (USD MILLION)
- TABLE 158 SAUDI ARABIA: SMART WATER METER MARKET, BY APPLICATION, 2026-2031 (USD MILLION)
- TABLE 159 UAE: SMART WATER METER MARKET, BY APPLICATION, 2022-2025 (USD MILLION)
- TABLE 160 UAE: SMART WATER METER MARKET, BY APPLICATION, 2026-2031 (USD MILLION)
- TABLE 161 ISRAEL: SMART WATER METER MARKET, BY APPLICATION, 2022-2025 (USD MILLION)
- TABLE 162 ISRAEL: SMART WATER METER MARKET, BY APPLICATION, 2026-2031 (USD MILLION)
- TABLE 163 EGYPT: SMART WATER METER MARKET, BY APPLICATION, 2022-2025 (USD MILLION)
- TABLE 164 EGYPT: SMART WATER METER MARKET, BY APPLICATION, 2026-2031 (USD MILLION)
- TABLE 165 SOUTH AFRICA: SMART WATER METER MARKET, BY APPLICATION, 2022-2025 (USD MILLION)
- TABLE 166 SOUTH AFRICA: SMART WATER METER MARKET, BY APPLICATION, 2026-2031 (USD MILLION)
- TABLE 167 REST OF MIDDLE EAST & AFRICA: SMART WATER METER MARKET, BY APPLICATION, 2022-2025 (USD MILLION)
- TABLE 168 REST OF MIDDLE EAST & AFRICA: SMART WATER METER MARKET, BY APPLICATION, 2026-2031 (USD MILLION)
- TABLE 169 SMART WATER METER MARKET: OVERVIEW OF STRATEGIES ADOPTED BY KEY PLAYERS, JANUARY 2023-SEPTEMBER 2026
- TABLE 170 SMART WATER METER MARKET: DEGREE OF COMPETITION, 2025
- TABLE 171 SMART WATER METER MARKET: REGION FOOTPRINT
- TABLE 172 SMART WATER METER MARKET: COMPONENT FOOTPRINT
- TABLE 173 SMART WATER METER MARKET: METER TYPE FOOTPRINT
- TABLE 174 SMART WATER METER MARKET: APPLICATION FOOTPRINT
- TABLE 175 SMART WATER METER MARKET: DETAILED LIST OF KEY STARTUPS/SMES
- TABLE 176 SMART WATER METER MARKET: COMPETITIVE BENCHMARKING OF KEY STARTUPS/SMES
- TABLE 177 SMART WATER METER MARKET: PRODUCT LAUNCHES, JANUARY 2023-SEPTEMBER 2026
- TABLE 178 SMART WATER METER MARKET: DEALS, JANUARY 2023-SEPTEMBER 2026
- TABLE 179 SMART WATER METER MARKET: EXPANSIONS, JANUARY 2023-SEPTEMBER 2026
- TABLE 180 BADGER METER, INC.: COMPANY OVERVIEW
- TABLE 181 BADGER METER, INC.: PRODUCTS/SOLUTIONS/SERVICES OFFERED
- TABLE 182 BADGER METER, INC.: PRODUCT LAUNCHES
- TABLE 183 BADGER METER, INC.: DEALS
- TABLE 184 BADGER METER, INC.: EXPANSIONS
- TABLE 185 LANDIS+GYR: COMPANY OVERVIEW
- TABLE 186 LANDIS+GYR: PRODUCTS/SOLUTIONS/SERVICES OFFERED
- TABLE 187 LANDIS+GYR: PRODUCT LAUNCHES
- TABLE 188 LANDIS+GYR: DEALS
- TABLE 189 LANDIS+GYR: EXPANSIONS
- TABLE 190 ITRON INC.: COMPANY OVERVIEW
- TABLE 191 ITRON INC.: PRODUCTS/SOLUTIONS/SERVICES OFFERED
- TABLE 192 ITRON INC.: PRODUCT LAUNCHES
- TABLE 193 ITRON INC.: DEALS
- TABLE 194 ITRON INC.: EXPANSIONS
- TABLE 195 DIEHL STIFTUNG & CO. KG: COMPANY OVERVIEW
- TABLE 196 DIEHL STIFTUNG & CO. KG: PRODUCTS/SOLUTIONS/SERVICES OFFERED
- TABLE 197 DIEHL STIFTUNG & CO. KG: PRODUCT LAUNCHES
- TABLE 198 DIEHL STIFTUNG & CO. KG: DEALS
- TABLE 199 DIEHL STIFTUNG & CO. KG: EXPANSIONS
- TABLE 200 SENSUS (XYLEM): COMPANY OVERVIEW
- TABLE 201 SENSUS (XYLEM): PRODUCTS/SOLUTIONS/SERVICES OFFERED
- TABLE 202 SENSUS (XYLEM): DEALS
- TABLE 203 SENSUS (XYLEM): EXPANSIONS
- TABLE 204 HONEYWELL INTERNATIONAL INC.: COMPANY OVERVIEW
- TABLE 205 HONEYWELL INTERNATIONAL INC.: PRODUCTS/SOLUTIONS/SERVICES OFFERED
- TABLE 206 HONEYWELL INTERNATIONAL INC.: PRODUCT LAUNCHES
- TABLE 207 HONEYWELL INTERNATIONAL INC.: DEALS
- TABLE 208 HONEYWELL INTERNATIONAL INC.: EXPANSIONS
- TABLE 209 WASION HOLDINGS INTERNATIONAL: COMPANY OVERVIEW
- TABLE 210 WASION HOLDINGS INTERNATIONAL: PRODUCTS/SOLUTIONS/SERVICES OFFERED
- TABLE 211 WASION HOLDINGS INTERNATIONAL: EXPANSIONS
- TABLE 212 WASION HOLDINGS INTERNATIONAL: OTHER DEVELOPMENTS
- TABLE 213 KAMSTRUP: COMPANY OVERVIEW
- TABLE 214 KAMSTRUP: PRODUCTS/SOLUTIONS/SERVICES OFFERED
- TABLE 215 KAMSTRUP: PRODUCT LAUNCHES
- TABLE 216 KAMSTRUP: DEALS
- TABLE 217 KAMSTRUP: EXPANSIONS
- TABLE 218 ACLARA (HUBBELL): COMPANY OVERVIEW
- TABLE 219 ACLARA (HUBBELL): PRODUCTS/SOLUTIONS/SERVICES OFFERED
- TABLE 220 ACLARA (HUBBELL): DEALS
- TABLE 221 ACLARA (HUBBELL): EXPANSIONS
- TABLE 222 B METERS SRL: COMPANY OVERVIEW
- TABLE 223 B METERS SRL: PRODUCTS/SOLUTIONS/SERVICES OFFERED
- TABLE 224 B METERS SRL: PRODUCT LAUNCHES
- TABLE 225 B METERS SRL: DEALS
- TABLE 226 B METERS SRL: EXPANSIONS
- TABLE 227 ARAD GROUP: COMPANY OVERVIEW
- TABLE 228 ARAD GROUP: PRODUCTS/SOLUTIONS/SERVICES OFFERED
- TABLE 229 ARAD GROUP: PRODUCT LAUNCHES
- TABLE 230 ARAD GROUP: EXPANSIONS
- TABLE 231 ZENNER INTERNATIONAL GMBH & CO. KG: COMPANY OVERVIEW
- TABLE 232 ZENNER INTERNATIONAL GMBH & CO. KG: PRODUCTS/SOLUTIONS/SERVICES OFFERED
- TABLE 233 ZENNER INTERNATIONAL GMBH & CO. KG: DEALS
- TABLE 234 ZENNER INTERNATIONAL GMBH & CO. KG: EXPANSIONS
- TABLE 235 NEPTUNE TECHNOLOGY GROUP INC.: COMPANY OVERVIEW
- TABLE 236 NEPTUNE TECHNOLOGY GROUP INC.: PRODUCTS/SOLUTIONS/SERVICES OFFERED
- TABLE 237 NEPTUNE TECHNOLOGY GROUP INC.: EXPANSIONS
- TABLE 238 ISKRAEMECO GROUP: COMPANY OVERVIEW
- TABLE 239 ISKRAEMECO GROUP: PRODUCTS/SOLUTIONS/SERVICES OFFERED
- TABLE 240 ISKRAEMECO GROUP: EXPANSIONS
- TABLE 241 SAGEMCOM: COMPANY OVERVIEW
- TABLE 242 SAGEMCOM: PRODUCTS/SOLUTIONS/SERVICES OFFERED
- TABLE 243 BAYLAN WATER METERS: COMPANY OVERVIEW
- TABLE 244 WEGOT UTILITY SOLUTIONS PVT LTD.: COMPANY OVERVIEW
- TABLE 245 APATOR S.A.: COMPANY OVERVIEW
- TABLE 246 STMICROELECTRONICS: COMPANY OVERVIEW
- TABLE 247 AXIOMA METERING: COMPANY OVERVIEW
- TABLE 248 DRIZZLEX: COMPANY OVERVIEW
- TABLE 249 CONSERVATION LABS, INC.: COMPANY OVERVIEW
- TABLE 250 INTEGRA: COMPANY OVERVIEW
- TABLE 251 PHYN LLC: COMPANY OVERVIEW
- TABLE 252 BOVE TECHNOLOGY: COMPANY OVERVIEW
List of Figures
- FIGURE 1 SMART WATER METER MARKET SEGMENTATION AND REGIONAL SCOPE
- FIGURE 2 SMART WATER METER MARKET SCENARIO
- FIGURE 3 GLOBAL SMART WATER METER MARKET SIZE, 2022-2031
- FIGURE 4 MAJOR STRATEGIES ADOPTED BY KEY PLAYERS IN SMART WATER METER MARKET, 2023-2026
- FIGURE 5 DISRUPTIONS INFLUENCING GROWTH OF SMART WATER METER MARKET
- FIGURE 6 HIGH-GROWTH SEGMENTS IN SMART WATER METER MARKET, 2026-2031
- FIGURE 7 ASIA PACIFIC TO REGISTER HIGHEST CAGR DURING FORECAST PERIOD
- FIGURE 8 INCREASING INVESTMENT IN MUNICIPAL WATER NETWORKS AND SMART CITIES TO DRIVE MARKET
- FIGURE 9 ULTRASONIC SEGMENT AND NORTH AMERICA ACCOUNTED FOR LARGEST MARKET SHARES IN 2025
- FIGURE 10 ULTRASONIC SEGMENT TO REGISTER HIGHEST GROWTH RATE FROM 2026 TO 2031
- FIGURE 11 IT SOLUTIONS SEGMENT TO EXHIBIT HIGHEST CAGR BETWEEN 2026 AND 2031
- FIGURE 12 AUTOMATED METER READING (AMR) SEGMENT TO BE FASTEST-GROWING BETWEEN 2026 AND 2031
- FIGURE 13 INDUSTRIES SEGMENT TO EXHIBIT HIGHER GROWTH RATE FROM 2026 TO 2031
- FIGURE 14 CHINA TO REGISTER HIGHEST CAGR IN GLOBAL SMART WATER METER MARKET DURING FORECAST PERIOD
- FIGURE 15 DRIVERS, RESTRAINTS, OPPORTUNITIES, AND CHALLENGES
- FIGURE 16 SMART WATER METER INSTALLATIONS IN ASHEVILLE, US
- FIGURE 17 PORTER'S FIVE FORCES ANALYSIS
- FIGURE 18 SMART WATER METER VALUE CHAIN ANALYSIS
- FIGURE 19 SMART WATER METER ECOSYSTEM
- FIGURE 20 ASP TREND OF SMART WATER METERS, BY METER TYPE, 2023-2025
- FIGURE 21 ASP TREND OF SMART WATER METERS, BY REGION, 2023-2025
- FIGURE 22 IMPORT DATA FOR HS CODE 9028-COMPLIANT PRODUCTS FOR TOP FIVE COUNTRIES, 2021-2025
- FIGURE 23 EXPORT DATA FOR HS CODE 9028-COMPLIANT PRODUCTS FOR TOP FIVE COUNTRIES, 2021-2025
- FIGURE 24 TRENDS/DISRUPTIONS INFLUENCING CUSTOMER BUSINESS
- FIGURE 25 INVESTMENT AND FUNDING SCENARIO
- FIGURE 26 PATENTS APPLIED AND GRANTED, 2016-2025
- FIGURE 27 FUTURE APPLICATIONS OF SMART WATER METER
- FIGURE 28 REAL-WORLD APPLICATIONS
- FIGURE 29 DECISION-MAKING FACTORS IN SMART WATER METER MARKET
- FIGURE 30 INFLUENCE OF STAKEHOLDERS ON BUYING PROCESS, BY APPLICATION
- FIGURE 31 KEY BUYING CRITERIA, BY APPLICATION
- FIGURE 32 SMART WATER METER ADOPTION BARRIERS AND INTERNAL CHALLENGES
- FIGURE 33 ADVANCED METERING INFRASTRUCTURE (AMI) SEGMENT HELD LARGER MARKET SHARE IN 2025
- FIGURE 34 WATER UTILITIES SEGMENT CAPTURED MAJORITY OF MARKET SHARE IN 2025
- FIGURE 35 ULTRASONIC SEGMENT ACCOUNTED FOR LARGEST MARKET SHARE IN 2025
- FIGURE 36 METERS & ACCESSORIES SEGMENT ACCOUNTED FOR MAJORITY OF MARKET SHARE IN 2025
- FIGURE 37 CHINA TO REGISTER HIGHEST CAGR IN GLOBAL SMART WATER METER MARKET FROM 2026 TO 2031
- FIGURE 38 NORTH AMERICA HELD LARGEST MARKET SHARE IN 2025
- FIGURE 39 NORTH AMERICA: SMART WATER METER MARKET SNAPSHOT
- FIGURE 40 ASIA PACIFIC: SMART WATER METER MARKET SNAPSHOT
- FIGURE 41 MARKET SHARE ANALYSIS OF COMPANIES PROVIDING SMART WATER METERS, 2025
- FIGURE 42 SMART WATER METER MARKET: REVENUE ANALYSIS OF TOP PLAYERS, 2021-2025
- FIGURE 43 BRAND COMPARATIVE ANALYSIS
- FIGURE 44 SMART WATER METER MARKET: COMPANY EVALUATION MATRIX (KEY PLAYERS), 2025
- FIGURE 45 SMART WATER METER MARKET: COMPANY FOOTPRINT
- FIGURE 46 SMART WATER METER MARKET: COMPANY EVALUATION MATRIX (STARTUPS/SMES), 2025
- FIGURE 47 COMPANY VALUATION
- FIGURE 48 FINANCIAL METRICS (EV/EBITDA)
- FIGURE 49 BADGER METER, INC.: COMPANY SNAPSHOT
- FIGURE 50 LANDIS+GYR: COMPANY SNAPSHOT
- FIGURE 51 ITRON INC.: COMPANY SNAPSHOT
- FIGURE 52 HONEYWELL INTERNATIONAL INC.: COMPANY SNAPSHOT
- FIGURE 53 WASION HOLDINGS INTERNATIONAL: COMPANY SNAPSHOT
- FIGURE 54 SMART WATER METER MARKET: RESEARCH DESIGN
- FIGURE 55 SMART WATER METER MARKET: DATA TRIANGULATION
- FIGURE 56 SMART WATER METER MARKET: BOTTOM-UP APPROACH
- FIGURE 57 SMART WATER METER MARKET: TOP-DOWN APPROACH
- FIGURE 58 SMART WATER METER MARKET: DEMAND-SIDE ANALYSIS
- FIGURE 59 METRICS CONSIDERED FOR ANALYZING DEMAND FOR SMART WATER METERS
- FIGURE 60 KEY METRICS CONSIDERED FOR ASSESSING SUPPLY OF SMART WATER METER PROVIDERS
- FIGURE 61 SMART WATER METER MARKET: SUPPLY-SIDE ANALYSIS
- FIGURE 62 MARKET SHARE ANALYSIS OF SMART WATER METER MARKET, 2025

