
Need help finding what you are looking for?
Contact Us
PUBLISHER: Mordor Intelligence | PRODUCT CODE: 1685847

PUBLISHER: Mordor Intelligence | PRODUCT CODE: 1685847
Ice Cream - Market Share Analysis, Industry Trends & Statistics, Growth Forecasts (2025 - 2030)
PUBLISHED:
PAGES: 323 Pages
DELIVERY TIME: 2-3 business days
SELECT AN OPTION
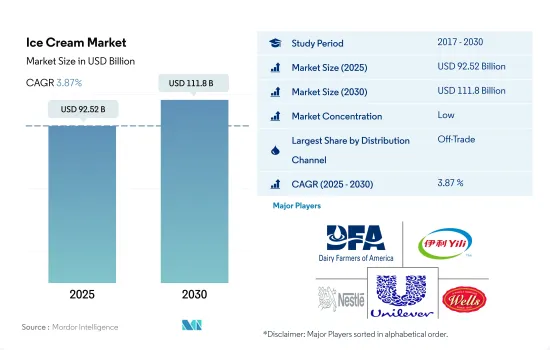
The Ice Cream Market size is estimated at 92.52 billion USD in 2025, and is expected to reach 111.8 billion USD by 2030, growing at a CAGR of 3.87% during the forecast period (2025-2030).
Strong penetration of organized retail channels propelling the market growth.
- The off-trade segment dominates the distribution channels of the global ice cream market. In the off-trade segment, consumers prefer buying ice cream majorly from supermarkets and hypermarkets, as people get discount coupons for bulk shopping in supermarkets. As a result, the off-trade channel is considered the primary distribution channel for the sales of ice cream, with more than 74% of overall sales as of 2023 globally.
- Convenience stores are the second-largest channel for the sales of ice cream after supermarkets and hypermarkets. In 2022, the sales value of ice cream through convenience stores increased by 3.4% compared to 2021. Many convenience stores stay open longer than traditional retail stores, resulting in more time in the day for the companies' products to be sold.
- Ice creams are commonly consumed as after-meal snacks in restaurants and foodservice channels, which is further boosting the global ice cream market growth. As of 2022, 47% of consumers consumed meals and ice cream at restaurants, and 31% of consumers ordered their food from foodservice channels globally.
- Africa had the highest sales of ice cream through on-trade channels globally, accounting for a major share of 50% in 2023. The sales are driven by the strong preference for eating out in the region. South Africa and Egypt are the leading countries in terms of sales of ice cream through on-trade channels in Africa. In 2022, the two countries covered 79% of sales in terms of volume in the total ice cream sales through on-trade channels in the region. In 2022, there were 3.5 million reservations in South Africa, seating 17.8 million diners at restaurants across the country. In 2020, despite the pandemic, around 68% of African people showed a willingness to eat out.
Consumer growing preference towards sweet indulgence driving the market growth.
- The global ice cream industry observed growth of 2.83% in 2022 compared to 2021. The growth was attributed to the rising number of consumers with a sweet tooth globally. In 2022, it was observed that the average Kiwi (People of New Zealand) consumed 28.4 l of ice cream. The United States, Australia, and Finland had a per capita consumption of volume of 20.8 l, 18.0 l, and 14.2 l in 2022, respectively.
- In North America, premium and regular ice cream hold 80% of the market. In 2022, 16% of the total population of North America preferred chocolate-flavored ice cream, followed by cookie N cream and vanilla, preferred by 13% and 12% of the population, respectively. Some flavors, such as cookie dough and mint chocolate dip, were preferred by 11% of the population. In 2022, 37% of consumers preferred eating ice cream out of a bowl.
- In the Middle East, consumers prioritize products' shelf life to store them conveniently. Ice creams have a longer shelf life, ranging from 12 to 24 months, depending on the temperature. Consumers in the Middle East prefer to consume ice cream at home.
- During the review period (2017-2022), in Asia-Pacific, China dominated the ice cream industry with a production of a whopping 4.3 billion l worth of ice cream. India, Vietnam, and Indonesia amassed a total of 13 billion l worth of ice cream sales. India sold 657 million l of ice cream in 2021. With the increased innovation in the ice cream industry, the demand for such products is expected to grow during the forecast period (2025-2029).
Global Ice Cream Market Trends
The strong penetration of ice cream parlors, the availability of diverse flavors, and the consumer preference for indulgent and healthier dessert options are driving the consumption of ice cream.
- Ice cream is the most widely consumed dairy dessert globally, with strong penetration across different countries. The demand for ice cream is driven by the significant number of ice cream parlors and scoop shops emerging in response to the high consumer spending on different flavors of ice creams. Europe is a significant consumer of ice cream globally. In 2022, Germany, the United Kingdom, Italy, and Spain collectively covered 29.28% of the overall ice cream consumption.
- Developed markets like the United States, the United Kingdom, Germany, and Australia are witnessing rising health concerns. Thus, consumers across the region prefer ice cream products that are GMO-free, preservative-free, dairy-free, low in calories, and organic and fat-free.
- The Asian ice cream market is growing, with brands tapping into the ice cream trend from an indulgence and a health perspective. For example, per capita consumption of ice cream in India is expected to increase by 5.90% from 2023-2024. The growing consumer expenditure on food and beverages, the introduction of new flavors, increasing impulse purchasing, and strong demand for healthy ice cream products among consumers are some of the primary factors increasing the consumption of ice cream. 75% of consumers in Asia often try new or different varieties when purchasing ice cream products.
Ice Cream Industry Overview
The Ice Cream Market is fragmented, with the top five companies occupying 29.03%. The major players in this market are Dairy Farmers of America Inc., Inner Mongolia Yili Industrial Group Co. Ltd, Nestle SA, Unilever PLC and Wells Enterprises Inc. (sorted alphabetically).
Additional Benefits:
- The market estimate (ME) sheet in Excel format
- 3 months of analyst support
Product Code: 48470
TABLE OF CONTENTS
1 EXECUTIVE SUMMARY & KEY FINDINGS
2 REPORT OFFERS
3 INTRODUCTION
- 3.1 Study Assumptions & Market Definition
- 3.2 Scope of the Study
- 3.3 Research Methodology
4 KEY INDUSTRY TRENDS
- 4.1 Per Capita Consumption
- 4.2 Raw Material/commodity Production
- 4.2.1 Milk
- 4.3 Regulatory Framework
- 4.3.1 Brazil
- 4.3.2 Canada
- 4.3.3 Germany
- 4.3.4 Italy
- 4.3.5 Japan
- 4.3.6 Mexico
- 4.3.7 United States
- 4.4 Value Chain & Distribution Channel Analysis
5 MARKET SEGMENTATION (includes market size in Value in USD and Volume, Forecasts up to 2030 and analysis of growth prospects)
- 5.1 Distribution Channel
- 5.1.1 Off-Trade
- 5.1.1.1 Convenience Stores
- 5.1.1.2 Online Retail
- 5.1.1.3 Specialist Retailers
- 5.1.1.4 Supermarkets and Hypermarkets
- 5.1.1.5 Others (Warehouse clubs, gas stations, etc.)
- 5.1.2 On-Trade
- 5.1.1 Off-Trade
- 5.2 Region
- 5.2.1 Africa
- 5.2.1.1 By Distribution Channel
- 5.2.1.2 Egypt
- 5.2.1.3 Nigeria
- 5.2.1.4 South Africa
- 5.2.1.5 Rest of Africa
- 5.2.2 Asia-Pacific
- 5.2.2.1 By Distribution Channel
- 5.2.2.2 Australia
- 5.2.2.3 China
- 5.2.2.4 India
- 5.2.2.5 Indonesia
- 5.2.2.6 Japan
- 5.2.2.7 Malaysia
- 5.2.2.8 New Zealand
- 5.2.2.9 Pakistan
- 5.2.2.10 South Korea
- 5.2.2.11 Rest of Asia Pacific
- 5.2.3 Europe
- 5.2.3.1 By Distribution Channel
- 5.2.3.2 Belgium
- 5.2.3.3 France
- 5.2.3.4 Germany
- 5.2.3.5 Italy
- 5.2.3.6 Netherlands
- 5.2.3.7 Russia
- 5.2.3.8 Spain
- 5.2.3.9 Turkey
- 5.2.3.10 United Kingdom
- 5.2.3.11 Rest of Europe
- 5.2.4 Middle East
- 5.2.4.1 By Distribution Channel
- 5.2.4.2 Bahrain
- 5.2.4.3 Iran
- 5.2.4.4 Kuwait
- 5.2.4.5 Oman
- 5.2.4.6 Qatar
- 5.2.4.7 Saudi Arabia
- 5.2.4.8 United Arab Emirates
- 5.2.4.9 Rest of Middle East
- 5.2.5 North America
- 5.2.5.1 By Distribution Channel
- 5.2.5.2 Canada
- 5.2.5.3 Mexico
- 5.2.5.4 United States
- 5.2.5.5 Rest of North America
- 5.2.6 South America
- 5.2.6.1 By Distribution Channel
- 5.2.6.2 Argentina
- 5.2.6.3 Brazil
- 5.2.6.4 Rest of South America
- 5.2.1 Africa
6 COMPETITIVE LANDSCAPE
- 6.1 Key Strategic Moves
- 6.2 Market Share Analysis
- 6.3 Company Landscape
- 6.4 Company Profiles (includes Global Level Overview, Market Level Overview, Core Business Segments, Financials, Headcount, Key Information, Market Rank, Market Share, Products and Services, and Analysis of Recent Developments).
- 6.4.1 Blue Bell Creameries LP
- 6.4.2 Dairy Farmers of America Inc.
- 6.4.3 Inner Mongolia Yili Industrial Group Co. Ltd
- 6.4.4 Lotte Corporation
- 6.4.5 Nestle SA
- 6.4.6 Smith Foods Inc.
- 6.4.7 Unilever PLC
- 6.4.8 Wells Enterprises Inc.
7 KEY STRATEGIC QUESTIONS FOR DAIRY AND DAIRY ALTERNATIVE CEOS
8 APPENDIX
- 8.1 Global Overview
- 8.1.1 Overview
- 8.1.2 Porter's Five Forces Framework
- 8.1.3 Global Value Chain Analysis
- 8.1.4 Market Dynamics (DROs)
- 8.2 Sources & References
- 8.3 List of Tables & Figures
- 8.4 Primary Insights
- 8.5 Data Pack
- 8.6 Glossary of Terms
Have a question?


SELECT AN OPTION
Have a question?
Questions? Please give us a call or visit the contact form.