
PUBLISHER: Mordor Intelligence | PRODUCT CODE: 1430505

PUBLISHER: Mordor Intelligence | PRODUCT CODE: 1430505
US Residential Smart Meters - Market Share Analysis, Industry Trends & Statistics, Growth Forecasts (2024 - 2029)
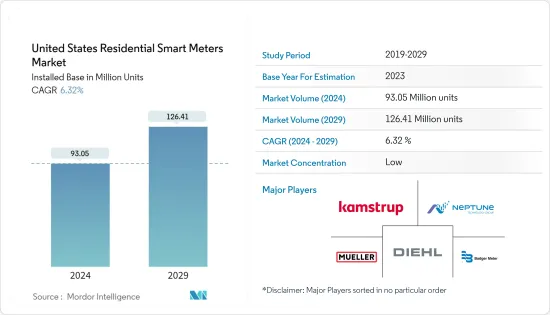
The United States Residential Smart Meters Market size in terms of installed base is expected to grow from 93.05 Million units in 2024 to 126.41 Million units by 2029, at a CAGR of 6.32% during the forecast period (2024-2029).
Smart meters are electronic devices that monitor electricity, gas, and water usage. These smart meters can transmit usage data via cellular, radiofrequency electromagnetic radiation (RF), and power line communication, assisting the utility company in efficiently managing energy consumption. Smart meters provide many advantages, including lower meter reading costs, prevention of disconnection, elimination of billing inefficiencies, and lower reconnection costs for businesses and consumers.
Key Highlights
- Smart meters are increasingly being adopted in the United States for various deployments, such as gas, electricity, and water, due to their communication feature, which imparts features such as real-time tracking of utility usage by both utility suppliers and consumers, also encourages start/reading/maintenance/cutoff of supply remotely by the supplier. The deployment of smart meters also enables the implementation of a home or building energy management system (HEMS or BEMS), allowing visualization of the electric power usage in the entire residential building or in individual homes.
- Digitization is further driving and modernizing energy efficiency measures, which in turn is accelerating the deployment of smart grids in the country, considering they are capable of dynamically optimizing and fostering a supply of large amounts of electricity from renewable energy plants and sources such as solar power.
- Smart Metering is an IoT-based device for measuring home buildings' gas, water, and energy consumption. With smart metering and utility analytics solutions, utility companies can tack and get access to smart asset data, consumers' information, utility distribution and consumption history, and much more for a deep understanding of their utility usage habits operations. This can help them capitalize on the benefits of smart metering solutions by exploiting the advantages directly.
- The most prominent limitation in the smart metering market is the availability of capital funding to deploy smart meters. Smart water and electricity meters are comparatively more expensive than the regular metering equipment employed by most service providers and users.
- The outbreak of COVID-19 suddenly changed how the world economy was structured. The smart-meter market suffered from a sudden decline in residential infrastructure installation and development projects as several restrictions ranging from travel to the use of manual workforce were imposed to curb the spread of the virus. However, in the post-pandemic era, the market successfully adjusted and is on its part toward growth, which has helped open opportunities for new technologies to be introduced into the market in the United States. The top suppliers must ensure that their goods satisfy both consumer expectations and legal and security requirements to succeed.
US Residential Smart Meters Market Trends
Increased Investments in Smart Grid Projects to Drive the Market
- Utilities in the country are increasingly adopting technologies, like artificial intelligence and digital twinning, coupled with increased government support and initiatives, further attracting investments in innovative grid projects and driving the studied market.
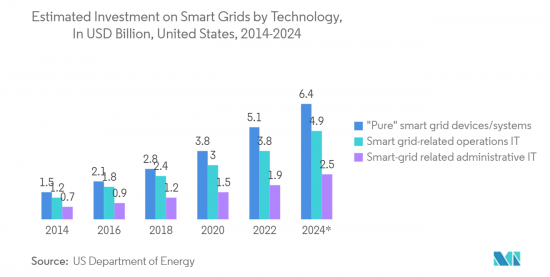
- Also, according to the US Department of Energy, the annual investment in smart grids in the United States from 2014 to 2024 is broken down by technology. By 2024, investment in intelligent grid devices or systems, such as advanced metering infrastructure, was forecasted to reach USD 6.4 billion.
- In October 2023, The US Department of Energy earmarked USD 3.46 billion for 58 projects spanning 44 states aimed at fortifying the resilience and reliability of the nation's electric grid. The initiatives, underpinned by the Bipartisan Infrastructure Law, will leverage a total investment of over USD 8 billion from federal and private sources.
- The adoption of smart meters, a significant measure of future-ready technologies, paves the way for the smart grid by enabling two-way real-time communication between DISCOMs and consumers through GPRS technologies.
- The power grid infrastructure is progressively becoming more digitized and connected, ensuring reliable and secure critical digital communications flow. Thus, smart grid infrastructure is vital in a power substation or residential setting. Smart meters enable the real-time measurements needed to monitor equipment health, grid congestion, and stability, and system control forms an integral part of smart grids.
- In the United States, smart meters have been deployed in over half of the market. However, the largest single-country market is expected to be the United States, accounting for most of the global smart grid market for equipment and services. Within the broader intelligent grid framework, the most significant opportunities for growth are anticipated in analytic services and smart meters.
Smart Gas Meter to Witness Major Growth
- Growing measures toward optimizing operational efficiencies across utilities in response to overall consumer demand are leading to the growth of the US smart gas meters market. Additionally, the shifting trend toward the digital economy and information society is a substantial factor responsible for the business growth in the region. In addition to improving commercial and residential construction activity, demand for industry products has benefited from a larger number of utilities converting to smart grids. In the past few years, the United States has witnessed various new project announcements from larger utilities.
- The number of houses represents the market potential for utilities providing gas. As more new houses are built, a growing proportion of homes will have smart meters installed as Advanced Metering Infrastructure (AMI), which continues its widespread adoption across both residential and commercial applications. The residential end-user is expected to offer a huge market for smart gas meters, given the number of households that individually have gas meters stalled. For instance, according to the US Census Bureau, the number of households increased and reached 131.2 million in 2022. However, the growth of households looks stagnant during the forecast period, posing a potential threat to industry revenue growth.
- According to EIA, natural gas is among the primary energy sources in the residential sector as it is used widely to heat buildings and water, dry clothes, and cook. About half of the households in the United States use natural gas for space and water heating. Additionally, in 2022, the residential sector made up approximately 15% of the total natural gas consumption in the United States. Such a rise in natural gas is likely to bring demand in the market.
- The industrial sector was responsible for about 26% of the total consumption, while the commercial sector accounted for approximately 11%. It is important to highlight that in 2022, the United States reached a significant milestone by achieving a record-breaking natural gas consumption of 33.4 quads. This accomplishment can primarily be attributed to the increased utilization of natural gas, which has consistently surpassed all other sectors for the past five years.
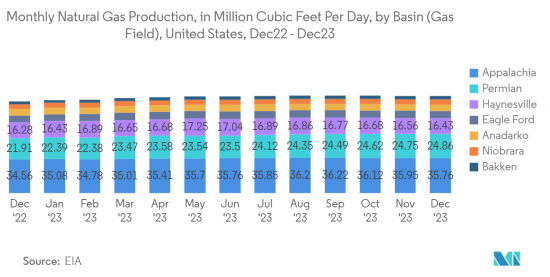
- According to the Energy Institute, there was a steady increase in natural gas production in the United States over the past decade, reaching a peak of almost 979 billion cubic meters in 2022. Furthermore, according to the Drilling Productivity Report by EIA, the monthly gas production in the Appalachia basin alone is estimated to be 35.8 million cubic feet per day in December 2023. This increase in production has been in response to a growing demand for natural gas, especially following the 2008 Recession. Consequently, it is expected that there will be a greater need for smart gas meters.
US Residential Smart Meters Industry Overview
The United States residential smart meters market is fragmented as the substantial increase in demand, coupled with government initiatives to increase the number of rollouts in the United States, is expected to increase the degree of competition amongst the market players to meet the increasing demand and some of the players include Badger Meter Inc., Mueller Systems LLC, Diehl Metering U.S., Kamstrup A/S, and Neptune Technology Group Inc.
- September 2023 - Xcel Energy announced the start of the rollout plan of smart electricity meters in its Wisconsin service territory. The installations will start in the company's southern communities and will lead to the installation of more than 260,000 of the new smart meters in the service area through 2025.
- May 2023 - Honeywell made an announcement regarding the introduction of its Next Generation Cellular Module (NXCM). This module offers an exceptional solution known as Advanced Metering Infrastructure (AMI), which allows for transforming outdated gas meters into smart meters without additional infrastructure expenditure. The remarkable aspect of this module lies in its ability to establish wireless connectivity between meters using existing public cellular networks. Consequently, utility providers and their customers can benefit from improved monitoring, safety, and analytics capabilities.
Additional Benefits:
- The market estimate (ME) sheet in Excel format
- 3 months of analyst support
TABLE OF CONTENTS
1 INTRODUCTION
- 1.1 Study Assumptions and Market Definition
- 1.2 Scope of the Study
2 RESEARCH METHODOLOGY
3 EXECUTIVE SUMMARY
4 MARKET INSIGHTS
- 4.1 Market Overview
- 4.2 Impact of COVID-19 Aftereffects and other Macroeconomic Factors on the Market
- 4.3 Industry Value Chain Analysis
- 4.4 Industry Attractiveness - Porter's Five Forces Analysis
- 4.4.1 Bargaining Power of Suppliers
- 4.4.2 Bargaining Power of Buyers
- 4.4.3 Threat of New Entrants
- 4.4.4 Threat of Substitute Products
- 4.4.5 Degree of Competition
- 4.5 Technology Evolution
5 MARKET DYNAMICS
- 5.1 Market Drivers
- 5.1.1 Increased Investments in Smart Grid Projects
- 5.1.2 Growth in Smart City Deployment
- 5.2 Market Challenges
- 5.2.1 High Costs and Security Concerns
- 5.2.2 Integration Difficulties with Smart Meters
6 MARKET SEGMENTATION
- 6.1 Smart Gas Meter
- 6.2 Smart Water Meter
- 6.3 Smart Electricity Meter
7 COMPETITIVE LANDSCAPE
- 7.1 Company Profiles
- 7.1.1 Badger Meter Inc.
- 7.1.2 Mueller Systems LLC
- 7.1.3 Diehl Metering U.S.
- 7.1.4 Kamstrup A/S
- 7.1.5 Neptune Technology Group Inc.
- 7.1.6 General Electric Company
- 7.1.7 Itron Inc.
- 7.1.8 Landis+GYR Group AG
- 7.1.9 Elster Group GmbH (Honeywell International Inc)
- 7.1.10 Sensus USA Inc. (Xylem Inc.)
- 7.1.11 Aclara Technologies Inc. (Hubbel Inc.)
- 7.1.12 Wasion Holdings Limited
8 MARKET OUTLOOK
- 8.1 Opportunities
- 8.1.1 Integration with Smart City Initiatives
- 8.1.2 Technological Advancements and Connectivity Solutions
- 8.2 Existing Rollout Plans
9 WATER UTILITY COMPANIES ANALYSIS
- 9.1 Water Utility Company Analysis - Alabama
- 9.2 Water Utility Company Analysis - Alaska
- 9.3 Water Utility Company Analysis - Arizona
- 9.4 Water Utility Company Analysis - Arkansas
- 9.5 Water Utility Company Analysis - California
- 9.6 Water Utility Company Analysis - Colorado
- 9.7 Water Utility Company Analysis - Connecticut
- 9.8 Water Utility Company Analysis - Delaware
- 9.9 Water Utility Company Analysis - Florida
- 9.10 Water Utility Company Analysis - Georgia
- 9.11 Water Utility Company Analysis - Hawaii
- 9.12 Water Utility Company Analysis - Idaho
- 9.13 Water Utility Company Analysis - Illinois
- 9.14 Water Utility Company Analysis - Indiana
- 9.15 Water Utility Company Analysis - Iowa
- 9.16 Water Utility Company Analysis - Kansas
- 9.17 Water Utility Company Analysis - Kentucky
- 9.18 Water Utility Company Analysis - Louisiana
- 9.19 Water Utility Company Analysis - Maine
- 9.20 Water Utility Company Analysis - Maryland
- 9.21 Water Utility Company Analysis - Massachusetts
- 9.22 Water Utility Company Analysis - Michigan
- 9.23 Water Utility Company Analysis - Minnesota
- 9.24 Water Utility Company Analysis - Mississippi
- 9.25 Water Utility Company Analysis - Missouri
- 9.26 Water Utility Company Analysis - Montana
- 9.27 Water Utility Company Analysis - Nebraska
- 9.28 Water Utility Company Analysis - Nevada
- 9.29 Water Utility Company Analysis - New Hampshire
- 9.30 Water Utility Company Analysis - New Jersey
- 9.31 Water Utility Company Analysis - New Mexico
- 9.32 Water Utility Company Analysis - New York
- 9.33 Water Utility Company Analysis - North Carolina
- 9.34 Water Utility Company Analysis - North Dakota
- 9.35 Water Utility Company Analysis - Ohio
- 9.36 Water Utility Company Analysis - Oklahoma
- 9.37 Water Utility Company Analysis - Oregon
- 9.38 Water Utility Company Analysis - Pennsylvania
- 9.39 Water Utility Company Analysis - Rhode Island
- 9.40 Water Utility Company Analysis - South Carolina
- 9.41 Water Utility Company Analysis - South Dakota
- 9.42 Water Utility Company Analysis - Tennessee
- 9.43 Water Utility Company Analysis - Texas
- 9.44 Water Utility Company Analysis - Utah
- 9.45 Water Utility Company Analysis - Vermont
- 9.46 Water Utility Company Analysis - Virginia
- 9.47 Water Utility Company Analysis - Washington
- 9.48 Water Utility Company Analysis - West Virginia
- 9.49 Water Utility Company Analysis - Wisconsin
- 9.50 Water Utility Company Analysis - Wyoming
10 REGULATIONS

