
Need help finding what you are looking for?
Contact Us
PUBLISHER: Mordor Intelligence | PRODUCT CODE: 1693822

PUBLISHER: Mordor Intelligence | PRODUCT CODE: 1693822
Japan Engineering Plastics - Market Share Analysis, Industry Trends & Statistics, Growth Forecasts (2024 - 2029)
PUBLISHED:
PAGES: 263 Pages
DELIVERY TIME: 2-3 business days
SELECT AN OPTION
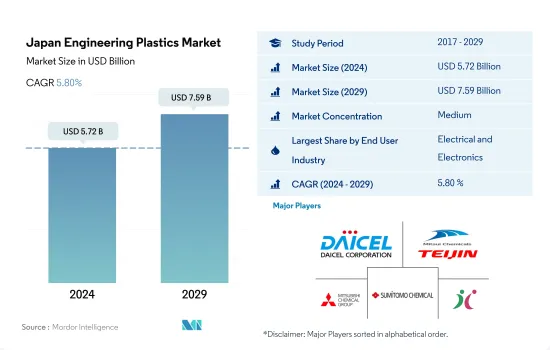
The Japan Engineering Plastics Market size is estimated at 5.72 billion USD in 2024, and is expected to reach 7.59 billion USD by 2029, growing at a CAGR of 5.80% during the forecast period (2024-2029).
The electrical and electronics industry to maintain its dominance in terms of both value and volume
- Engineering plastics have applications ranging from interior wall panels and doors in aerospace to rigid and flexible packaging. In Japan, the engineering plastics market is led by the packaging, electrical and electronics, and automotive industries. Packaging and electrical and electronics industries accounted for around 26.89% and 27.23% of the engineering plastics market volume in 2022.
- The electrical and electronics sector is the largest in the country. For instance, the Japanese electronics industry experienced a 2% Y-o-Y increase in domestic production in 2022, reaching a total of USD 84.34 billion. This growth was mainly attributed to the strong performance of electronic components and devices in exports, the rising usage of electronic components in vehicles, and the increasing demand for electric measuring instruments due to the growth of 5G technology. These factors led to higher consumption of engineering plastics in the country, with volume growth of 1.12% in 2022 compared to the previous year.
- In 2022, the automotive industry accounted for 25.65% of the revenue share, which made it the second largest promising industry in the country. In 2022, the Japanese automotive industry grew at a Y-o-Y rate of 15.15% compared to the previous year. This was mainly due to an increase in vehicle production in the country, which was recorded at 9.41 million units in 2022, 3.49% higher than the previous year.
- Aerospace is the fastest-growing industry in the country in terms of revenue, with a projected CAGR of 7.69%, owing to increased spending in the aerospace industry, which is expected to drive the demand for engineering plastics during the forecast period. Japan's aerospace component production revenue is expected to reach around USD 17 billion by 2029.
Japan Engineering Plastics Market Trends
Government policies to support domestic electrical and electronics production
- The Japanese electronics industry excels in the production of components and devices, creating key technologies, such as all-solid batteries and medical cameras. The government's efforts toward decarbonization and the industry's proficiency in this field will enable further innovations by developing functions geared toward factory automation and telework-led workstyle reforms.
- The country faced chip shortages caused by the trade war between the United States and China, and the increased demand that followed the move to remote working that affected the production of electronics in the country in 2019. Consecutively, due to COVID-19 pandemic-related disruptions in 2020, the number of businesses in the Japanese electronic parts, devices, and electronic circuits manufacturing industry hit a decade low of approximately 3.79 thousand establishments, a decrease from around 3.86 thousand in the previous year. The country produced consumer electronic equipment of JPY 42,908 million, by value, and industrial electronic equipment of JPY 25,5676 million, by value, in 2020.
- Japan registered an increase of 19.2% in electrical and electronics production revenue from 2020 to 2021. The total production value of the electronics industry in Japan reached close to JPY 11 trillion in 2021. The industry encompasses consumer electronic equipment, industrial electronic equipment, and electronic components and devices. Consumer electronics account for a third of Japan's economic output.
- The US President and Japanese Prime Minister pledged to bolster semiconductor manufacturing capacity, and the country is also investing in the innovation sector, which may boost the electronic industry in the country during the forecast period.
Japan Engineering Plastics Industry Overview
The Japan Engineering Plastics Market is moderately consolidated, with the top five companies occupying 63.27%. The major players in this market are Daicel Corporation, MCT PET Resin Co Ltd, Mitsubishi Chemical Corporation, Sumitomo Chemical Co., Ltd. and Techno-UMG Co., Ltd. (sorted alphabetically).
Additional Benefits:
- The market estimate (ME) sheet in Excel format
- 3 months of analyst support
Product Code: 5000160
TABLE OF CONTENTS
1 EXECUTIVE SUMMARY & KEY FINDINGS
2 REPORT OFFERS
3 INTRODUCTION
- 3.1 Study Assumptions & Market Definition
- 3.2 Scope of the Study
- 3.3 Research Methodology
4 KEY INDUSTRY TRENDS
- 4.1 End User Trends
- 4.1.1 Aerospace
- 4.1.2 Automotive
- 4.1.3 Building and Construction
- 4.1.4 Electrical and Electronics
- 4.1.5 Packaging
- 4.2 Import And Export Trends
- 4.3 Price Trends
- 4.4 Recycling Overview
- 4.4.1 Polyamide (PA) Recycling Trends
- 4.4.2 Polycarbonate (PC) Recycling Trends
- 4.4.3 Polyethylene Terephthalate (PET) Recycling Trends
- 4.4.4 Styrene Copolymers (ABS and SAN) Recycling Trends
- 4.5 Regulatory Framework
- 4.5.1 Japan
- 4.6 Value Chain & Distribution Channel Analysis
5 MARKET SEGMENTATION (includes market size in Value in USD and Volume, Forecasts up to 2029 and analysis of growth prospects)
- 5.1 End User Industry
- 5.1.1 Aerospace
- 5.1.2 Automotive
- 5.1.3 Building and Construction
- 5.1.4 Electrical and Electronics
- 5.1.5 Industrial and Machinery
- 5.1.6 Packaging
- 5.1.7 Other End-user Industries
- 5.2 Resin Type
- 5.2.1 Fluoropolymer
- 5.2.1.1 By Sub Resin Type
- 5.2.1.1.1 Ethylenetetrafluoroethylene (ETFE)
- 5.2.1.1.2 Fluorinated Ethylene-propylene (FEP)
- 5.2.1.1.3 Polytetrafluoroethylene (PTFE)
- 5.2.1.1.4 Polyvinylfluoride (PVF)
- 5.2.1.1.5 Polyvinylidene Fluoride (PVDF)
- 5.2.1.1.6 Other Sub Resin Types
- 5.2.2 Liquid Crystal Polymer (LCP)
- 5.2.3 Polyamide (PA)
- 5.2.3.1 By Sub Resin Type
- 5.2.3.1.1 Aramid
- 5.2.3.1.2 Polyamide (PA) 6
- 5.2.3.1.3 Polyamide (PA) 66
- 5.2.3.1.4 Polyphthalamide
- 5.2.4 Polybutylene Terephthalate (PBT)
- 5.2.5 Polycarbonate (PC)
- 5.2.6 Polyether Ether Ketone (PEEK)
- 5.2.7 Polyethylene Terephthalate (PET)
- 5.2.8 Polyimide (PI)
- 5.2.9 Polymethyl Methacrylate (PMMA)
- 5.2.10 Polyoxymethylene (POM)
- 5.2.11 Styrene Copolymers (ABS and SAN)
- 5.2.1 Fluoropolymer
6 COMPETITIVE LANDSCAPE
- 6.1 Key Strategic Moves
- 6.2 Market Share Analysis
- 6.3 Company Landscape
- 6.4 Company Profiles (includes Global Level Overview, Market Level Overview, Core Business Segments, Financials, Headcount, Key Information, Market Rank, Market Share, Products and Services, and Analysis of Recent Developments).
- 6.4.1 AGC Inc.
- 6.4.2 Asahi Kasei Corporation
- 6.4.3 Daicel Corporation
- 6.4.4 Daikin Industries, Ltd.
- 6.4.5 Kuraray Co., Ltd.
- 6.4.6 Kureha Corporation
- 6.4.7 MCT PET Resin Co Ltd
- 6.4.8 Mitsubishi Chemical Corporation
- 6.4.9 PBI Advanced Materials Co.,Ltd.
- 6.4.10 Polyplastics-Evonik Corporation
- 6.4.11 Sumitomo Chemical Co., Ltd.
- 6.4.12 Techno-UMG Co., Ltd.
- 6.4.13 Teijin Limited
- 6.4.14 Toray Industries, Inc.
- 6.4.15 UBE Corporation
7 KEY STRATEGIC QUESTIONS FOR ENGINEERING PLASTICS CEOS
8 APPENDIX
- 8.1 Global Overview
- 8.1.1 Overview
- 8.1.2 Porter's Five Forces Framework (Industry Attractiveness Analysis)
- 8.1.3 Global Value Chain Analysis
- 8.1.4 Market Dynamics (DROs)
- 8.2 Sources & References
- 8.3 List of Tables & Figures
- 8.4 Primary Insights
- 8.5 Data Pack
- 8.6 Glossary of Terms
Have a question?


SELECT AN OPTION
Have a question?
Questions? Please give us a call or visit the contact form.